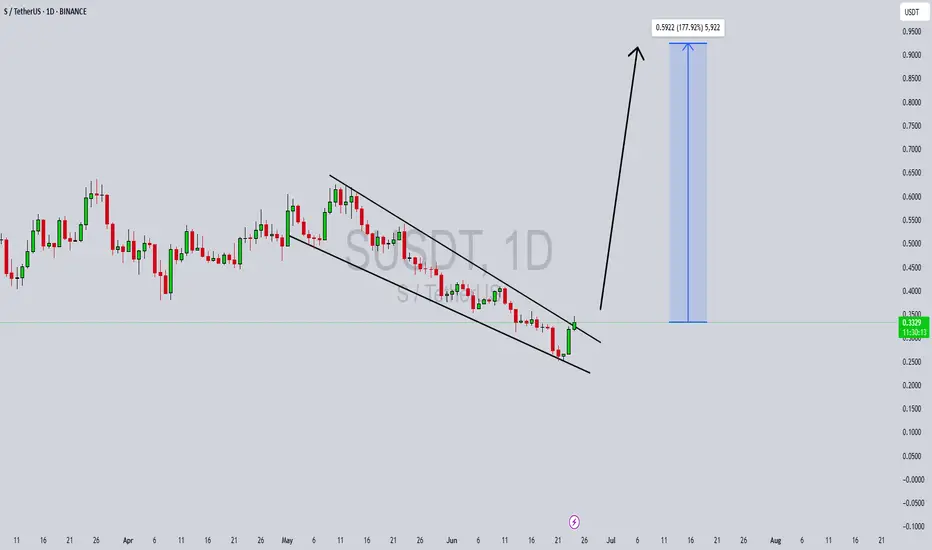
SUSDT Forming Falling WedgeSUSDT is currently displaying a textbook falling wedge pattern, a bullish reversal formation often seen at the end of a downtrend. This setup is known for signaling a breakout to the upside once the price compresses within the narrowing range. In the case of SUSDT, the wedge has been forming with consistent downward sloping resistance and support lines, accompanied by steady volume — a key confirmation of this pattern’s strength. The current technical outlook suggests that a bullish breakout could be imminent.
Technical indicators and chart structure support a possible breakout that could deliver a substantial move. Based on historical wedge breakout performance, SUSDT has the potential to rally with a projected gain of 140% to 150%+ from current levels. This would place the asset in a prime position for traders looking to capitalize on early-stage momentum. The increasing volume profile further adds conviction, signaling active accumulation and growing market interest.
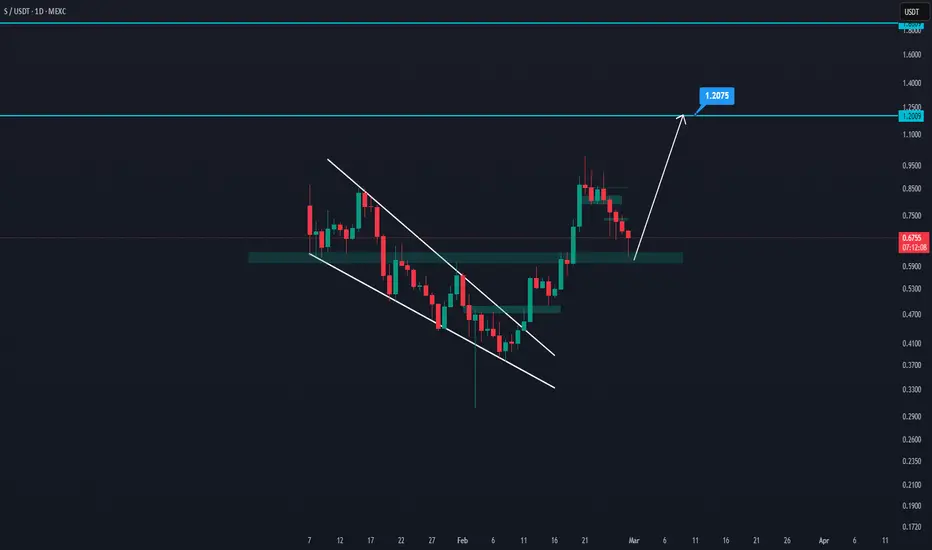
Recent activity and sentiment around SUSDT indicate that investors are starting to pay attention to this opportunity. As capital flows into smaller-cap altcoins showing strong technical setups, SUSDT stands out with its clean wedge formation and bullish potential. If the price breaks above the wedge resistance with volume confirmation, it could trigger a strong upward rally, attracting both short-term traders and long-term holders.
This pattern-driven setup, combined with bullish market behavior and investor activity, puts SUSDT in a favorable zone for significant upside. Keep an eye on key resistance levels and watch for bullish engulfing candles or breakout confirmation to enter at optimal points.
✅ Show your support by hitting the like button and
✅ Leaving a comment below! (What is You opinion about this Coin)
Your feedback and engagement keep me inspired to share more insightful market analysis with you!
Sbtc
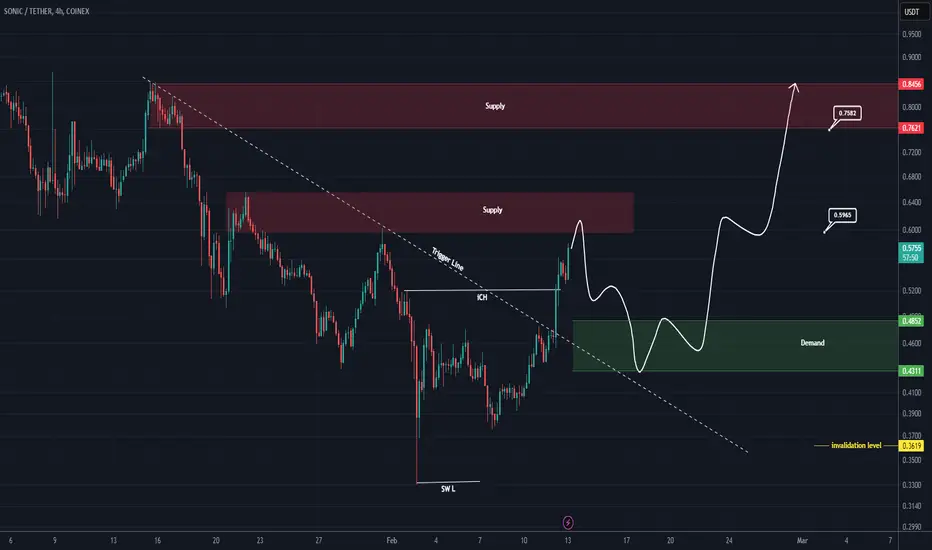
SUSDT buy/long setup (4H)It seems that a lot of orders have accumulated at the lower levels. We have a bullish iCH on the chart, and the trigger line has been broken. The price is now near a supply zone. If it bounces from the green area, we can look for buy/long positions.
Targets are marked on the chart.
A daily candle closing below the invalidation level will invalidate this analysis.
For risk management, please don't forget stop loss and capital management
Comment if you have any questions
Thank You
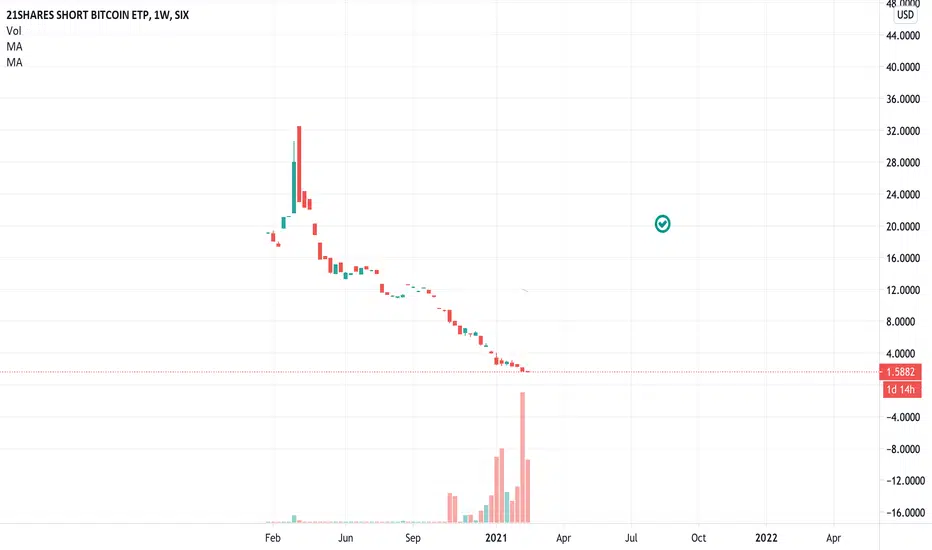
SBTC.USD - short BitcoinIf you want to short Bitcoin, this is one of the options - inverse Bitcoin ETP on SIX Swiss Exchange.
I will not discuss here why would you and whether you should, this is just to outline the possibility.
And as a final note - I am buying some.