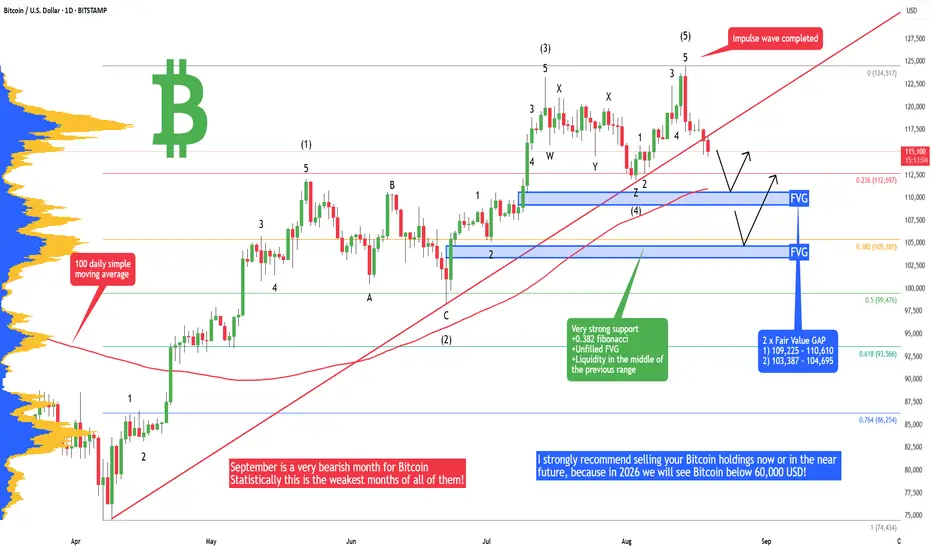
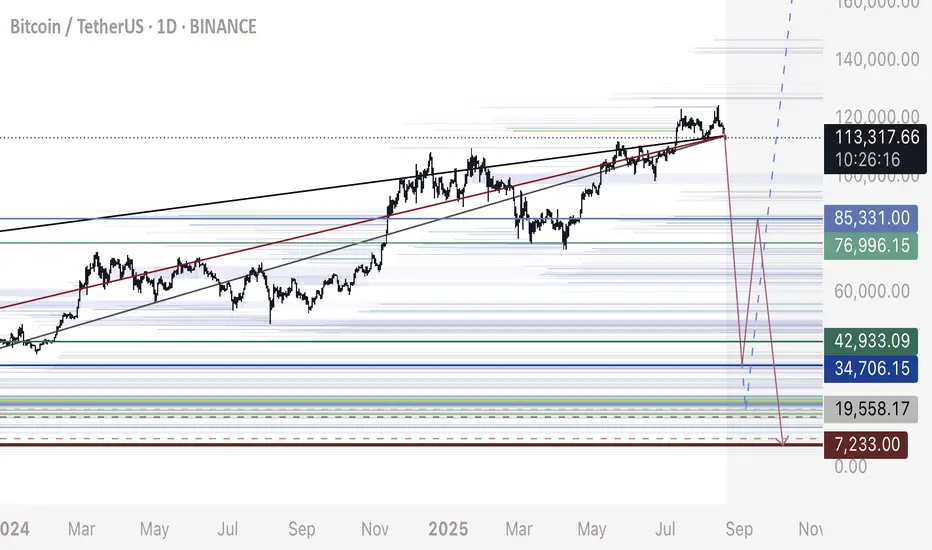
Bitcoin - Avoid BTC at all cost! What is coming will blow you.I strongly recommend selling your Bitcoin holdings now or in the near future, because in 2026 we will see Bitcoin below 60,000 USD! I will tell you why in this analysis.
But first let's look at the local price action on the daily chart and what is going to happen with Bitcoin in the short term. I expect Bitcoin to fall to 110,600 in the immediate short term; this is my first profit target for the intraday position. Why is 110,600 a strong support? We have the first FVG on the daily chart that has never been tested, and also we have a 100-day moving average. This is a pretty good support for intraday trades.
Later in September we will probably see Bitcoin at 104,800. Why is 104,800 a strong support? We have to look at the previous price action from May to July, because we have a range/bull flag, and there is also an unfilled FVG. The previous major swing low of 105,130 is something where people put a lot of stop losses below it. That's a magnet for whales; they probably want to buy here. Also, there is the 0.382 Fibonacci retracement level of the previous impulse wave.
Why is Bitcoin so bearish now? Well, we have completed an impulse wave 12345, and also the red trendline is breaking down! That's in general a bearish price action. Early in the article I was talking about 60k BTC - for this, you need to look at my previous analysis to understand the full picture.
Write a comment with your altcoin + hit the like button, and I will make an analysis for you in response. Trading is not hard if you have a good coach! This is not a trade setup, as there is no stop-loss or profit target. I share my trades privately. Thank you, and I wish you successful trades!
Community ideas
XAUUSDHello Traders! 👋
What are your thoughts on GOLD?
Gold remains trapped in a tight consolidation range between key support and resistance zones.
In the short term, the ongoing decline is expected to extend toward the support area, where a bullish reaction may occur.
As long as price stays within this range, the optimal strategy is to buy near support and sell near resistance.
A clear breakout above resistance or below support is needed to confirm the next directional move
Don’t forget to like and share your thoughts in the comments! ❤️
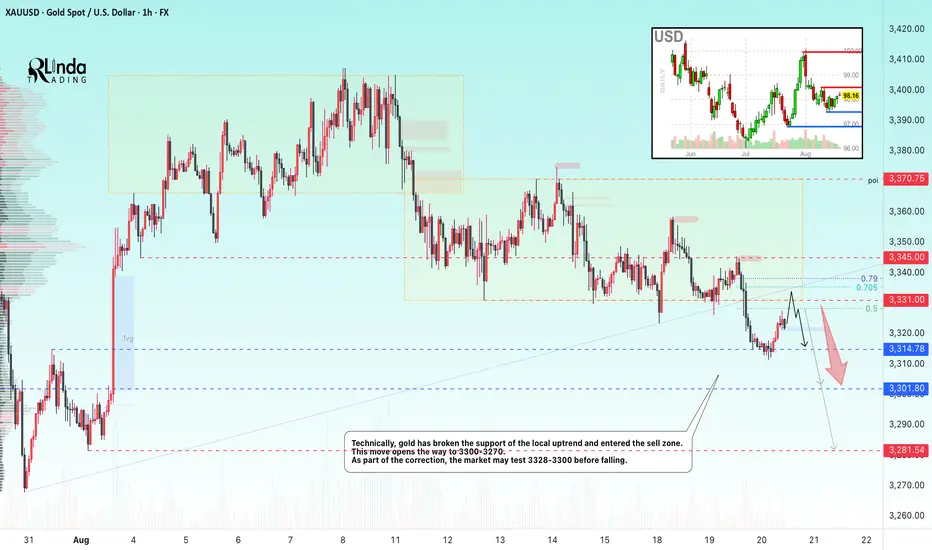
GOLD → Correction and retest of a previously broken level...FX:XAUUSD breaks through the support of the local consolidation “symmetrical triangle” and falls to a minimum of 3311...
Gold remained at a three-week low of around $3,300 in Asian trading on Wednesday as markets awaited the Fed minutes and Powell's speech in Jackson Hole. The dollar is strengthening on expectations that the Fed chair will reject the idea of aggressive rate cuts despite weak labor market and inflation data. The probability of a rate cut in September is estimated at 85%. Strong housing market data and news about negotiations on Ukraine provided additional support to the dollar. Powell's comments on Friday remain the key factor for gold, while current movements are mainly technical in nature.
Resistance levels: 3328, 3331, 3345
Support levels: 3314, 3300, 3328
Technically, a correction is forming after a bearish rally. As part of the correction, the price may test the zone of interest, which is represented by local resistance levels. Distribution could bring the price to 3300-3270.
Best regards, R. Linda!
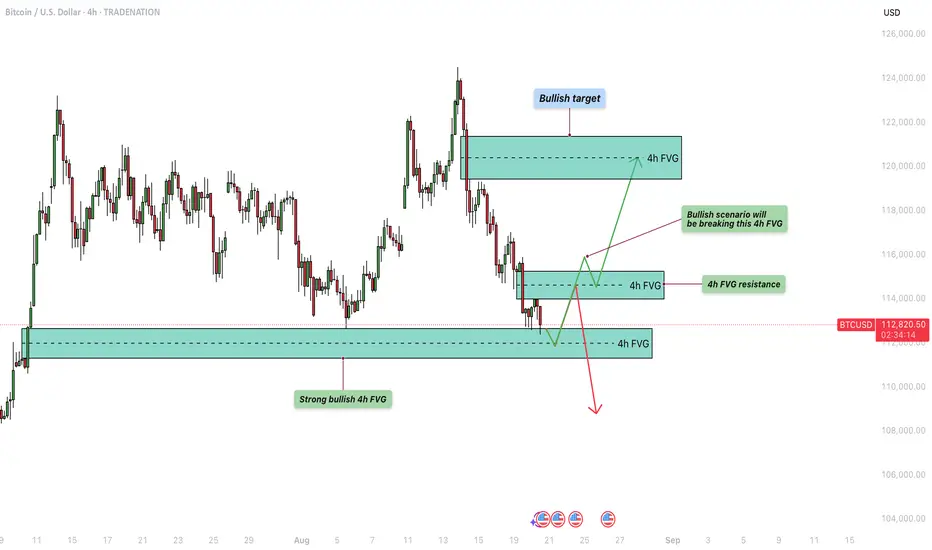
Bitcoin - Can the bulls defend this support?Introduction
After reaching its all-time high, Bitcoin has faced strong rejection, falling from $124.5k down to $113k with notable bearish volume behind the move. On this downward path, several four-hour bearish Fair Value Gaps (FVGs) were left open, signaling areas of inefficiency that the market may look to revisit. At present, Bitcoin is testing a critical support zone formed by overlapping daily and four-hour FVGs. This support level is of particular importance because holding it could provide the foundation for renewed bullish momentum and a potential recovery in price action.
Bullish scenario
For the bullish case to unfold, Bitcoin must successfully maintain support in the $111.2k to $112.7k range, which represents the current four-hour FVG. This zone serves as a pivotal point where buyers need to defend price in order to keep upward potential intact. If the market stabilizes here, the next logical target will be the four-hour bearish FVG just above. In order to confirm strength, Bitcoin would need to close a clear four-hour candle above this resistance, effectively flipping it into support. Should that occur, it opens the door for price to climb toward the $120k region, a level that would reintroduce confidence among bulls and suggest that the broader trend could still have room for continuation.
Bearish scenario
On the other hand, the bearish scenario becomes more likely if Bitcoin fails to defend the $111.2k to $112.7k four-hour FVG and instead flips this zone into resistance. While a breakdown below this area would be concerning, there is still the possibility of a short-term bounce. In such a case, price could retrace back upward toward the bearish four-hour FVG at $114.7k before facing another critical test. If Bitcoin rejects strongly from that zone and subsequently breaks below $111.2k, the market could experience further downside pressure, potentially setting up a deeper correction. This would reinforce the dominance of the ongoing downtrend that has followed the rejection at the all-time high.
Final thoughts
Bitcoin remains in a pronounced downtrend after its sweep of the previous all-time high, yet it currently sits at a strong support level that offers a chance for recovery. The market’s reaction to this support area will play a decisive role in determining whether a rebound toward $120k is achievable or whether a deeper decline is imminent. The four-hour FVG around $114.7k stands out as a key battleground between bulls and bears. If buyers can reclaim and hold this level, momentum could shift back in their favor, but if sellers defend it and force price lower, the bearish trend is likely to persist.
-------------------------
Disclosure: I am part of Trade Nation's Influencer program and receive a monthly fee for using their TradingView charts in my analysis.
Thanks for your support. If you enjoyed this analysis, make sure to follow me so you don't miss the next one. And if you found it helpful, feel free to drop a like 👍 and leave a comment 💬, I’d love to hear your thoughts!
GOLD NEXT MOVE (expecting a bearish move)(mid term)(20-08-2025)Go through the analysis carefully and do trade accordingly.
Anup 'BIAS for the Mid Term
Current price- 3345
BEST Selling area= 3365-70
"if Price stays below 3395, then next target is 3245, 3180 and 3120 and above that 3400 ".
-POSSIBILITY-1
Wait (as geopolitical situation are worsening )
-POSSIBILITY-2
Wait (as geopolitical situation are worsening)
Best of luck
Never risk more than 1% of principal to follow any position.
Support us by liking and sharing the post.
21.08.25 Morning ForecastPairs on Watch -
FX:GBPCAD
FX:GBPUSD
FX:EURGBP
FX:EURUSD
A short overview of the instruments I am looking at for today, multi-timeframe analysis down to what I will be looking at for an entry. Enjoy!

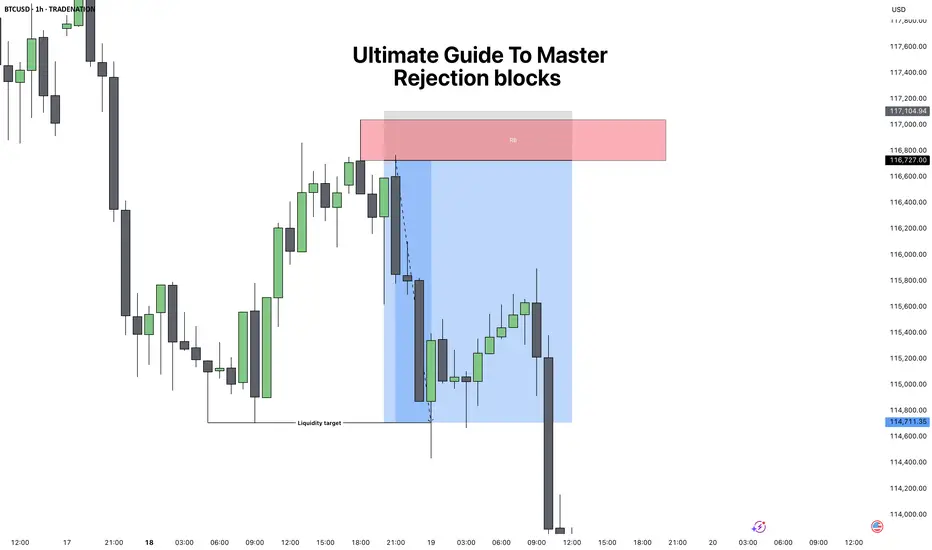
Ultimate Guide to Master: Rejection BlocksRejection Blocks (ICT Concept) – Complete Guide
1. What is a Rejection Block?
A rejection block is a special type of price level that forms when the market attempts to push through but gets denied and reverses. Unlike a traditional order block, which represents accumulation or distribution by institutions, a rejection block shows a failed attempt to continue in one direction. It is a footprint of rejection and often becomes a strong reaction zone in the future.
There are two types:
Bullish Rejection Block:
Forms from a bearish candle whose low is taken out, but price fails to continue lower and closes back above. The low of that candle becomes the key level.
Bearish Rejection Block:
Forms from a bullish candle whose high is breached, but price fails to continue higher and closes back inside. The high of that candle becomes the key level.
These levels can act as hidden support or resistance and often serve as high-probability entry points when combined with market structure.
2. How to Spot a Valid Rejection Block
To correctly identify rejection blocks, you need to look for:
1. Clear Attempt Beyond a Candle
Price must trade beyond the high or low of a prior candle, suggesting continuation.
2. Failure and Return
After breaching the level, price fails and closes back inside the candle’s body.
3. Liquidity Context
A rejection block is more powerful if the wick that caused it swept liquidity (equal highs/lows or a previous key level).
4. Higher Timeframe Confluence
The best rejection blocks line up with higher timeframe bias (for example, spotting a bearish rejection block inside a 4H premium zone during a downtrend).
3. How to Trade Rejection Blocks
Trading them involves waiting for price to come back to the rejection block level and using it as an entry or reaction zone.
Bullish Setup:
When price trades below a bearish candle, fails, and closes higher, mark the low of that candle. On a retracement, price often retests that level as support.
Bearish Setup:
When price trades above a bullish candle, fails, and closes lower, mark the high of that candle. On a retracement, price often retests that level as resistance.
Entry Technique:
You can enter "blindly" when you're understanding the confluences. But to begin with do this Instead, when price returns to the rejection block, drop to a lower timeframe and look for confirmation such as:
* Fair Value Gap (FVG) entries.
* Market Structure Shift (MSS).
* Liquidity sweeps into the level.
Stop Loss Placement:
Always place stops beyond the rejection candle itself (above the high for bearish RB, below the low for bullish RB).
4. Practical Examples and Market Context
Rejection blocks work best when they appear in the following situations:
Liquidity Sweeps:
After equal highs or equal lows are taken out, a rejection block often marks the failure point.
Inside Premium/Discount Zones:
In a bearish bias, look for bearish RBs in premium pricing. In a bullish bias, look for bullish RBs in discount pricing.
During Consolidation Breakouts:
If the market fakes a breakout and closes back inside, the rejection block often becomes the level to fade the fake move.
For example, if BTC takes out a prior daily high, prints a rejection block, and then closes back inside, the odds of reversal are high, especially if price was already in premium territory.
5. Combining Rejection Blocks with ICT Concepts
To increase accuracy, always combine RBs with ICT’s other tools:
Fair Value Gaps:
If a rejection block aligns with an FVG, it adds strength to the level.
Market Structure Shifts:
A rejection block is more powerful if followed by displacement and an MSS.
CISD Pattern:
A rejection block often forms right after the “Stop Hunt” part of the CISD sequence, serving as a clean entry.
Liquidity Pools:
Look for RBs near equal highs/lows, old highs/lows, or session liquidity (London/New York).
Conclusion
Rejection blocks are subtle but highly effective levels that show where the market tried to extend but failed, leaving behind a hidden form of support or resistance. By themselves they are useful, but when combined with ICT concepts like liquidity sweeps, MSS, and FVGs, they become powerful entry tools. The key is to always wait for price to return and confirm the level before entering, and to only trade them in alignment with higher timeframe bias.
Disclosure: I am part of Trade Nation's Influencer program and receive a monthly fee for using their TradingView charts in my analysis.
___________________________________
Thanks for your support!
If you found this idea helpful or learned something new, drop a like 👍 and leave a comment, I’d love to hear your thoughts! 🚀
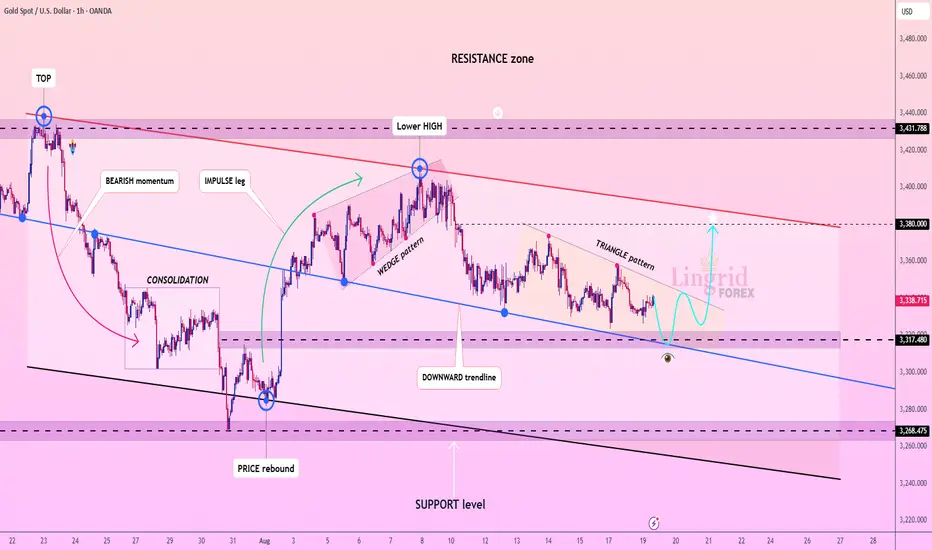
Lingrid | GOLD Broke Above Corrective Dynamic ResistanceOANDA:XAUUSD is attempting to recover after a strong sell-off from the resistance zone, with price currently testing the compression channel breakout. Structure highlights a descending sequence with a lower high, flag formations, and a downward trendline keeping the sideways tone intact. If the breakout holds above the compression channel, price could push toward 3,380, but rejection may open room back into deeper support. Broader momentum shows a corrective bearish leg softening, with potential bullish relief rally if buyers defend current levels.
📉 Key Levels:
Buy trigger: Sustained breakout above 3,320 support-turned-resistance.
Buy zone: 3,320–3,330, if buyers maintain control after breakout.
Target: 3,380 near-term resistance.
Invalidation: Breakdown below 3,250 would negate bullish setup.
💡 Risks:
Failure to sustain breakout, leading to continuation of the downtrend.
Strong USD momentum from macroeconomic releases could weigh on gold.
Geopolitical risk shifts that reprice safe-haven demand unpredictably.
If this idea resonates with you or you have your own opinion, traders, hit the comments. I’m excited to read your thoughts!
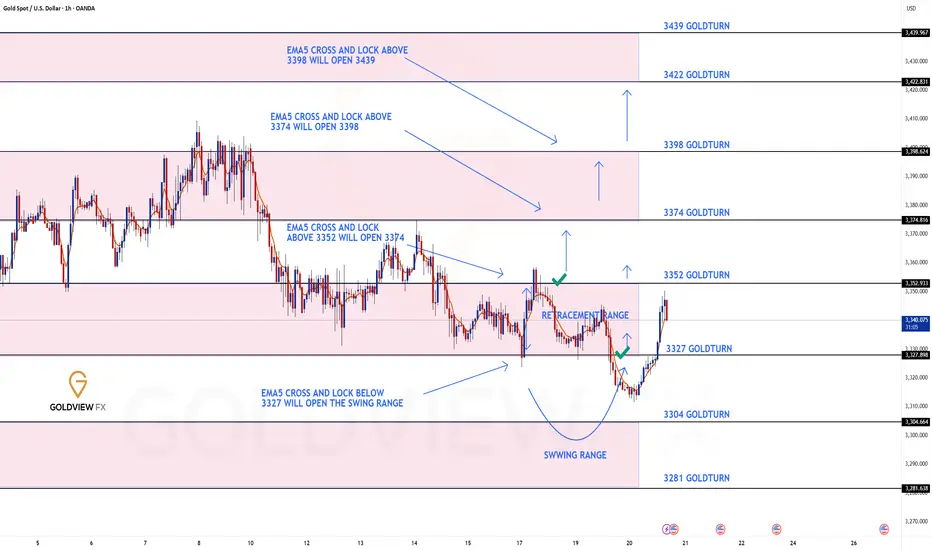
GOLD ROUTE MAP UPDATEHey Everyone,
Quick follow up update on our 1H chart idea:
After completing both our Bullish target at 3352 and Bearish target at 3327, we now have a lock below 3327 which opened the swing range down towards 3304. We did get the drop, but not the full test of 3304 before price turned back up.
Right now, we are seeing a break back above 3327 and heading towards a retest of 3352 once again. This is in line with our ongoing plan to buy dips, but we must also keep in mind that the swing range remains open. This means any swings can still clear the gap left in that 3304 region before moving higher.
So, while we continue to buy dips, we need to be mindful that open swing ranges can extend moves in either direction.
We will keep the above in mind when taking buys from dips. Our updated levels and weighted levels will allow us to track the movement down and then catch bounces up.
We will continue to buy dips using our support levels taking 20 to 40 pips. As stated before each of our level structures give 20 to 40 pip bounces, which is enough for a nice entry and exit. If you back test the levels we shared every week for the past 24 months, you can see how effectively they were used to trade with or against short/mid term swings and trends.
The swing range give bigger bounces then our weighted levels that's the difference between weighted levels and swing ranges.
BULLISH TARGET
3352 - DONE
EMA5 CROSS AND LOCK ABOVE 3352 WILL OPEN THE FOLLOWING BULLISH TARGETS
3374
EMA5 CROSS AND LOCK ABOVE 3374 WILL OPEN THE FOLLOWING BULLISH TARGET
3398
EMA5 CROSS AND LOCK ABOVE 3398 WILL OPEN THE FOLLOWING BULLISH TARGET
3422
BEARISH TARGETS
3327 - DONE
EMA5 CROSS AND LOCK BELOW 3327 WILL OPEN THE SWING RANGE
3304
3281
As always, we will keep you all updated with regular updates throughout the week and how we manage the active ideas and setups. Thank you all for your likes, comments and follows, we really appreciate it!
Mr Gold
GoldViewFX
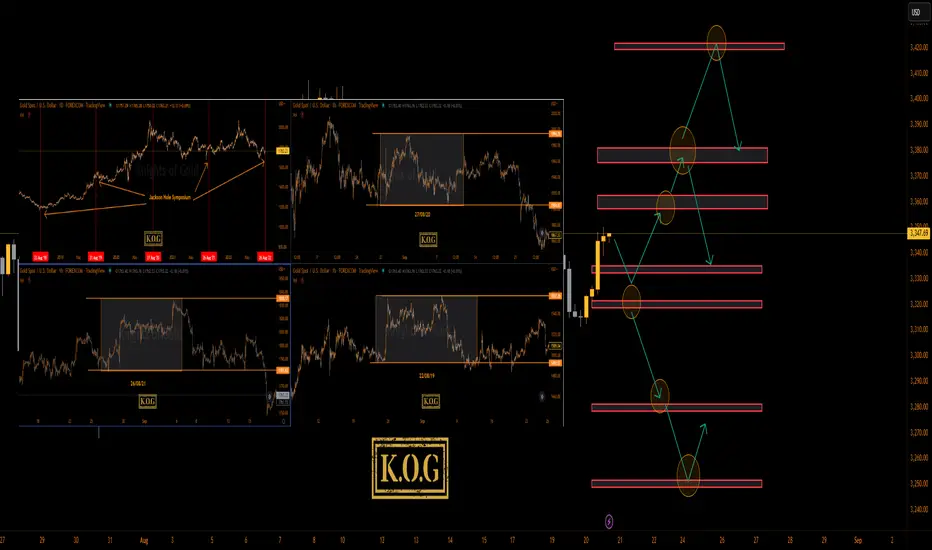
THE KOG REPORT - Jackson Hole Pt 2Jackson Hole 2025:
Here’s what to expect from the 2025 Jackson Hole Economic Policy Symposium, held August 21–23 in Jackson Hole, Wyoming:
Event Overview & Theme
• The 48th annual symposium is hosted by the Federal Reserve Bank of Kansas City from August 21 to 23, 2025.
• The theme is “Labour Markets in Transition: Demographics, Productivity, and Macroeconomic Policy.” It focuses on structural changes like aging populations, fertility declines, declining labour mobility, and the evolving role of AI in labour markets.
• The full agenda will be released on Thursday evening, August 21, with Federal Reserve Chair Jerome Powell’s speech scheduled for Friday morning (U.S. time): 10 a.m. EDT / 8 a.m. MDT.
Key Participants & Format
• A select group of around 120 invitees will attend, including central bankers, policymakers, academics, and journalists.
• Formats include research paper presentations, panels, Q&As, and the keynote address. All presentations and transcripts will be published online during and after the event
What to Watch For
1. Powell’s Speech & Policy Signals
Powell’s keynote—titled "Economic Outlook and Framework Review"—is expected to outline possible interest-rate decisions, update the Federal Reserve’s policy framework, and respond to critiques that its 2020 approach delayed necessary responses to inflation.
This is likely one of his most consequential speeches, delivered amid mounting political pressure, internal Fed disagreements, and a contested labour market environment.
2. Global Central Bankers & International Engagement
Notable international participants include ECB President Christine Lagarde and likely the Bank of England’s Andrew Bailey, expected to join panels on Saturday.
Their contributions will underscore the symposium’s global reach and offer comparative perspectives on monetary policy challenges.
3. Market Expectations & Reactions
Markets anticipate a 25 basis-point rate cut in September, with several sources placing the probability at ~85%.
Simultaneously, investor caution is elevated due to geopolitical tensions—especially around Trump’s influence, Ukraine talks, and tech policy developments.
4. Broader Economic Context
The symposium takes place amid mixed U.S. data: weak job growth and rising producer prices raise concerns about both slowing labour markets and persistent inflation.
Retail earnings (e.g. Target, Walmart, Home Depot) and recent CPI data also add to the backdrop, offering clues on consumer resilience and inflation trends.
GOLD:
Based on the back test of the event they tend to test the low of the range which in this scenario is around the 3280-90 region, however, if we look at the structure we do have a reversal in play here with the support level being the 3330-25 level. Above 3330 we have that extension of the move we spoke about last week 3360-65 which is still untouched. So, if we that in mind and they support that lower level in the coming session, there is a possibility they take us up into that region sitting around 3360-75 due to the volume that is expected, and if rejected they correct that move downside to again attempt to break through the 3300 level. The key level in this scenario is 3375 which needs to be broken to go higher taking us above 3400.
On the flip. 3330-20 breaks forcefully, in this scenario there is possibility that for price to attempt the range low sitting around the 3280 level which needs to hold in order to go back up. Please note, an aggressive swing here can break through that level resulting in a move all the way back down into the 3230-50 levels before then exhausting.
The range is huge and where we’ve seen 500-700pip movement over the years, we’re seeing over a couple of days lately, so we need to exaggerate every move and only look at the extreme levels.
RED BOX TARGETS:
Break above 3350 for 3360, 3365, 3374, 3390 and 3420 in extension of the move
Break below 3335 for 3320, 3310, 3305, 3297, 3280 and 3265 in extension of the move
What we’re trying to show you here is that its going to be a very difficult event to trade for new traders. Its going to be choppy, its going to be volatile, its going to whipsaw and its likely to move. If you’re caught the wrong side of it its going to kill your account. Best practice here is to let the market make the moves it wants to, wait for the price to settle in whatever level they want to drive it to, once this has happened then look for the setup to get in to the trade.
Please do support us by hitting the like button, leaving a comment, and giving us a follow. We’ve been doing this for a long time now providing traders with in-depth free analysis on Gold, so your likes and comments are very much appreciated.
As always, trade safe.
KOG
The link below will take you to the previous report on this event:
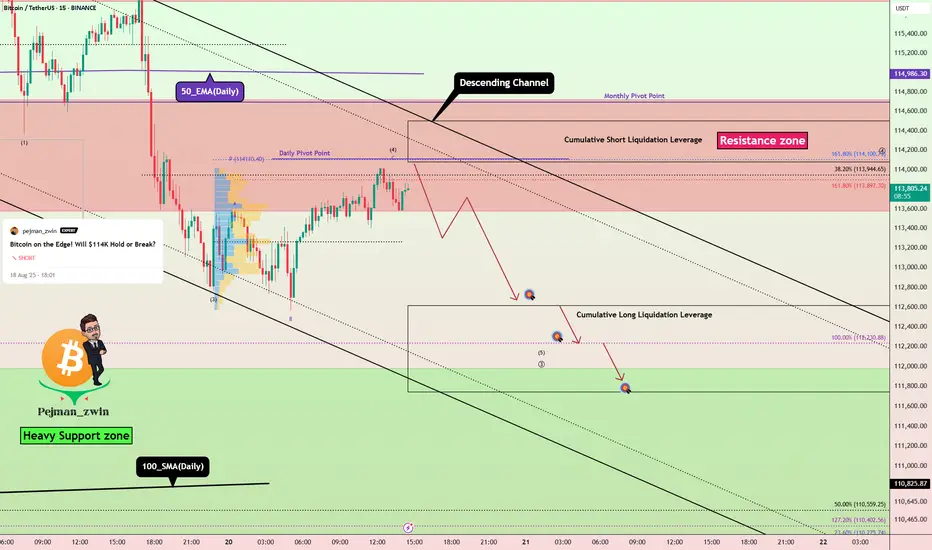
Bitcoin Short Setup _ Short-termBitcoin ( BINANCE:BTCUSDT ) has managed to break the Support zone($114,720-$113,570)/Now=Resistance zone and 50_EMA(Daily) , as I expected in the previous idea . And now it seems that Bitcoin is completing a pullback .
Also, on the 1-hour time frame , if you look closely, Bitcoin seems to be moving inside a descending channel .
In terms of Elliott wave theory , Bitcoin seems to be completing microwave 4 of the main wave 3 , so that microwave 4 could have an Expanding Flat structure(ABC/3-3-5) .
I expect Bitcoin to drop to at least $112,640 after completing the pullback ( microwave 4 of the main wave 3 ).
Second Target: $112,323
Cumulative Short Liquidation Leverage: $116,755-$115,778
Cumulative Short Liquidation Leverage: $114,500-$114,077
Cumulative Long Liquidation Leverage: $112,615-$111,743
Note: From today until Friday, important indexes will be released from the US, which can create excitement in financial markets, especially crypto, and even change the market trend when released.
Note: Most likely, after Bitcoin touches the Heavy Support zone($111,980-$105,820) and 100_SMA(Daily), we should wait for Bitcoin to bounce back (you might be able to look for a long position trigger in that zone).
Note: Stop Loss(SL): $114,823
Please respect each other's ideas and express them politely if you agree or disagree.
Bitcoin Analyze (BTCUSDT), 15-minute time frame.
Be sure to follow the updated ideas.
Do not forget to put a Stop loss for your positions (For every position you want to open).
Please follow your strategy and updates; this is just my Idea, and I will gladly see your ideas in this post.
Please do not forget the ✅' like '✅ button 🙏😊 & Share it with your friends; thanks, and Trade safe.
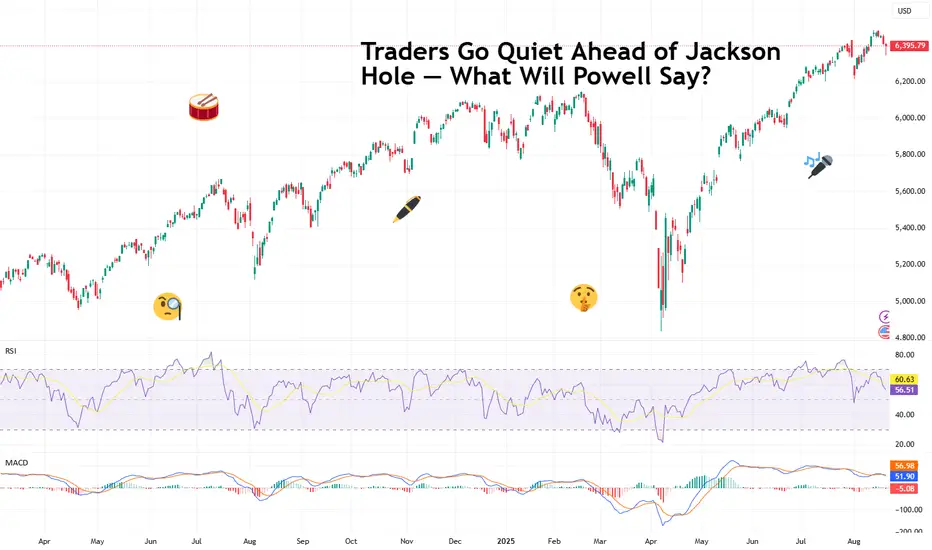
Traders Go Quiet Ahead of Jackson Hole — What Will Powell Say?Markets have been eerily quiet this week. Not because traders suddenly discovered meditation, but because everyone is waiting for one man in Wyoming to make things move.
Federal Reserve Chair Jerome Powell, the man who moves markets with a simple “Good afternoon,” is about to step onto the stage at the annual Jackson Hole Economic Symposium. And when he does, markets will hang on every word — because it’s his final speech as Fed boss at the premium event.
⛰️ Jackson Hole: Where Hiking Boots Meet Basis Points
The Jackson Hole conference isn’t your average PowerPoint snoozefest. Each year, central bankers from around the world swap suits for Patagonia fleeces and gather in Wyoming’s Grand Teton National Park. Think Davos, but with more elk.
This year’s theme? “Labor Markets in Transition.” Translation: the Fed wants to talk demographics, productivity, and immigration — the forces shaping how Americans work and how the economy grows. But make no mistake: nobody’s tuning in for a TED Talk on labor force participation rates. They want Powell’s take on interest rates.
🎯 Powell’s Big Moment
Powell’s speech may only run about 15 minutes (he’s not known for monologues), but the stakes couldn’t be higher. His term as Fed chair ends in May, and President Donald Trump has spent most of this year taking swings at him — calling him a “major LOSER” and grumbling that the Fed is moving “Too Late” on rate cuts.
Trump has even floated the idea of firing Powell early, which, technically speaking, isn’t supposed to happen. But this is 2025, and “not supposed to happen” has lost most of its meaning.
So, Jackson Hole could be Powell’s last best chance to lock in a legacy: defending the Fed’s independence while signaling where rates are headed next.
⛅️ Markets Already Have a Guess
Wall Street isn’t exactly sitting in suspense. Interest-rate swaps are pricing in an 80% chance of a 25-basis-point cut in September, with two full cuts baked in before the year is out.
Why? Because the data leaves Powell little wiggle room:
Jobs market: Recent revisions show weaker-than-thought employment growth . Maximum employment? Not quite.
Inflation: July’s consumer price index came in at 2.7% year-on-year — stable, but not scary enough to justify keeping rates where they are forever.
Tariffs: Trump’s sweeping duties could pressure inflation further, but they’re also weighing on growth. Powell’s challenge is threading the needle between those forces.
Translation: the Fed looks ready to flip from “higher for longer” to “cutting season.”
🧘♂️ Traders on Mute
If you think markets look a little sleepy, you’re not wrong. On Monday, the S&P 500 basically took a nap , slipping 0.01% as traders sat on their hands. Tuesday was even worse with big tech nosediving all day long.
It’s not just Powell they’re waiting for. Roughly 95% of S&P 500 companies have now reported earnings, (mandatory note: catch all earnings dates in the Earnings Calendar ) with more than 80% beating expectations.
Companies have been surprisingly nimble, offsetting tariffs and riding the weaker dollar . Yet despite the blowout earnings season, nobody wants to make big moves until Powell clears the air.
Call it the pre-Jackson Hole silence — the calm before the potential volatility storm.
🥊 Powell vs. Trump
There’s also political theater baked into this. Trump has made no secret of his desire for lower rates to juice growth and pump markets. Powell, however, has tried to keep the Fed above the political fray.
But that balancing act has been messy. Lower too quickly, and Powell risks stoking more inflation. Hold too high, and he risks slowing the labor market just as it’s showing cracks. Either way, he’ll be accused of playing politics.
This isn’t just about economics. It’s about central bank independence — a fancy way of asking: Can Powell make decisions without getting steamrolled by the White House?
🔮 What to Watch For
Here’s what traders will parse in his speech:
Tone: Does Powell sound more dovish (hinting at cuts) or still hawkish (concerned about tariffs fueling inflation)?
Framework: Will he unveil a new policy strategy for inflation and jobs?
Forward guidance: Any nods to September’s meeting or beyond will be amplified a thousand times on trading desks worldwide.
In other words, the market doesn’t just want Powell’s words. It wants the subtext and the context.
🚀 Why It Matters for Traders
For traders (yes, you), Powell’s Jackson Hole moment has real portfolio consequences:
Equities: A dovish Powell could extend the market’s record run — the S&P 500 and Nasdaq already logged new all-time highs this summer.
Bonds: Rate cuts could mean yields falling, bond prices rising. Treasuries might not be the snooze trade they’ve been.
Dollar: Lower rates could push the greenback down, offering a boost to commodities and emerging markets. Lower rates = lower deposit yields = less appeal to hold greenback.
Crypto: Yes, even Bitcoin BITSTAMP:BTCUSD cares. A dovish Fed means more liquidity sloshing around — which historically finds its way into risk assets.
🏁 The Takeaway
Markets are quiet now, but don’t expect them to stay that way. Powell’s Jackson Hole speech is shaping up as one of the most important of his career — maybe his swan song as Fed chair.
Off to you : Here’s a question (or two). Will he go dovish, handing traders the rate cuts they crave? Or will he stand firm, reminding everyone that the Fed won’t be bullied by politics? Share your thoughts in the comments!
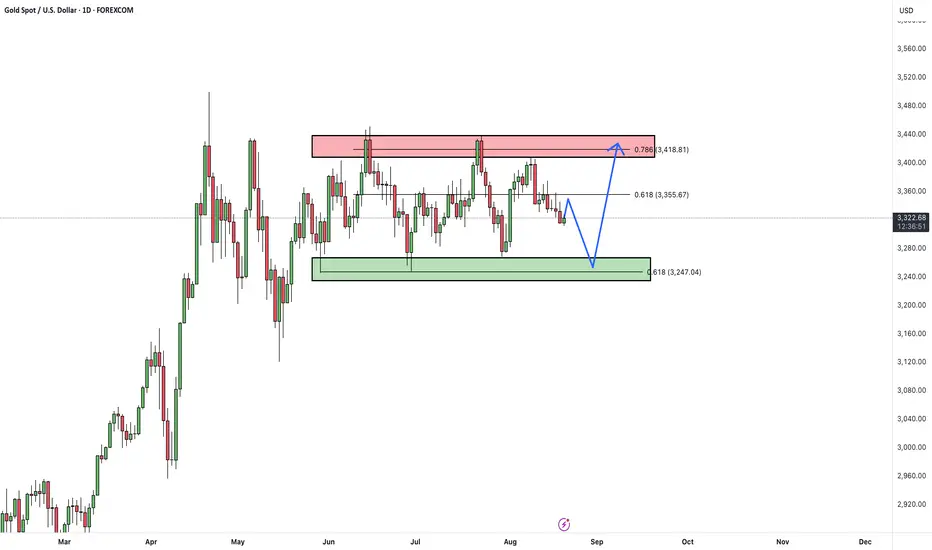
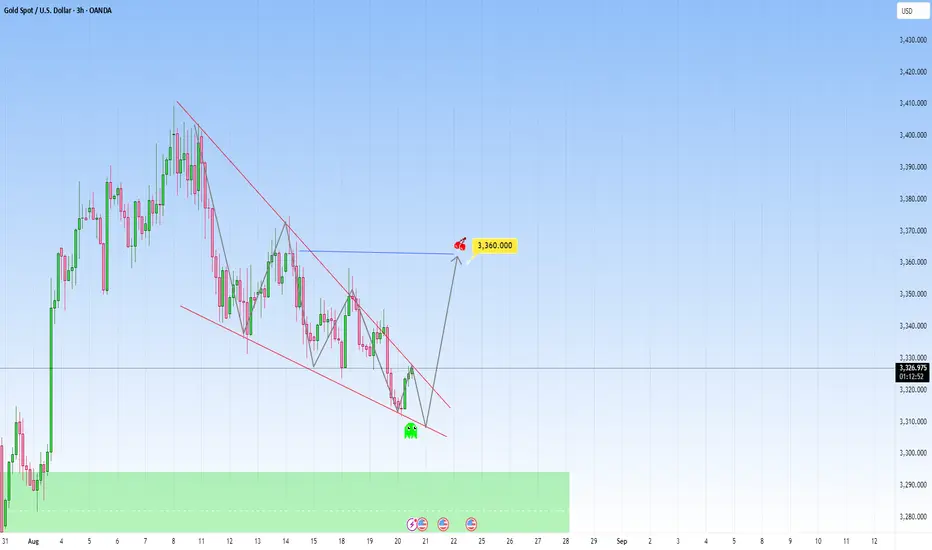
Gold in a falling wedge pattern: Ready for a strong ride upPrice on XAUUSD looks quite interesting right now, this recent has brought a new look to it, as it's forming a more optimistic pattern.
The most recent interaction here is particularly interesting, because it's already showing early signs of recovering and decreased bearish momentum. What may follow: low-volume candles suggesting exhaustion and potential upwards.
My target would be toward 3360. If this move plays out, it will make a beautiful play of a narrative that’s we've been following for Gold.
This setup is so compelling. It’s a story being shown, but still requires patience and confirmation.
Though a scenario for more downside is possible as we have a clear support zone below. Still, I am taking the side for more upside because of the pattern forming here.
Nasdaq - Preparing for another correction!🚔Nasdaq ( TVC:NDQ ) is starting to look weak:
🔎Analysis summary:
Over the course of the past couple of months, we witnessed an incredible rally on the Nasdaq. Following this previous price action, it is quite likely that we will soon see another correction. This could start with the current retest of the channel resistance trendline.
📝Levels to watch:
$23.000
SwingTraderPhil
SwingTrading.Simplified. | Investing.Simplified. | #LONGTERMVISION

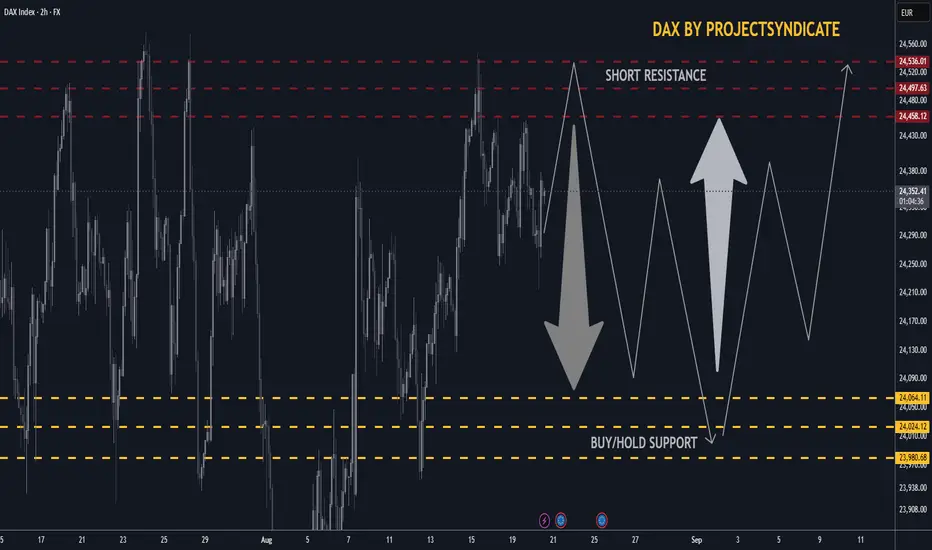
DAX/GER30 SHORT/LONG sequence Swing Trade +500/+500 points 🔸Hello traders, let’s review the 2hour chart for GER30/DAX. Strong recovery from recent lows, however price testing key resistance and support zones where major reactions are expected.
🔸Speculative setup defined by resistance at 24,500 and key S/R demand zone at 24,000. Both zones have recently been validated with +500 point reactions.
🔸Currently both resistance and support levels are respected and price action remains technical around these areas.
🔸Recommended strategy for DAX traders:
Short Sell at Market from resistance 24,500
SL above resistance, TP 24,200 / 24,100 / 24,000.
Buy & Hold Long from key S/R 24,000
SL below support, TP 24,300 / 24,400 / 24,500.
🎁Please hit the like button and
🎁Leave a comment to support our team!
RISK DISCLAIMER:
Trading Futures, Forex, CFDs and Stocks involves a risk of loss.
Please consider carefully if such trading is appropriate for you.
Past performance is not indicative of future results.
Always limit your leverage and use tight stop loss.
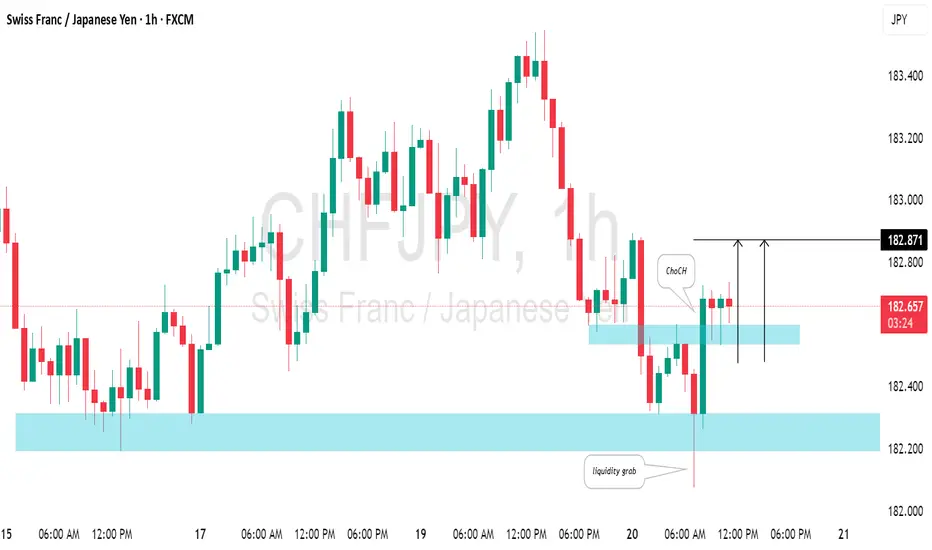
CHFJPY: Move Up Ahead?!The CHFJPY pair exhibits a strong bullish bias this morning.
The price action has generated a high-momentum bullish hourly candle, successfully breaching a minor intraday resistance level.
This movement confirms a Change of Character (CHoCH) pattern, suggesting a high probability of continued bullish momentum.
Our projection anticipates the price reaching the 182.87 level.
BTC - Following Crash PlanBTC has been following my analysis of predicting a potential crash here.
We can use DXY to anticipate when a significant liquidity grab / flash crash will occur.
Since DXY is retesting a major breakdown on the weekly - monthly, it would be wise to watch for volatility today on Bitcoins price, noting these liquidity regions if we are about to enter a bull run ranging out 3-5 years.
Targets and potential corrective patterns marked on this chart.
Happy trading.
Lingrid | GOLD Clings to Critical Support ZoneOANDA:XAUUSD has been consolidating, moving inside a descending channel after a sharp rejection from resistance. Structure shows a wedge followed by a triangle pattern inside the downward trendline, pointing to compression before a potential breakout. A bullish scenario opens if price bounces from support near 3,315 and breaks above the 3,380 resistance handle. Overall, broader context shows gold locked in a sideways move but coiling into a corrective structure that could fuel a bullish rally.
📉 Key Levels:
Buy trigger: Rejection at 3,320
Buy zone: 3,310–3,320 support area.
Target: 3,380 then 3,431.
Invalidation: Sustained close below 3,270 support.
💡 Risks:
Failure to break the downward trendline, keeping bearish momentum intact.
Weak buying volume near support, leading to breakdown continuation.
Broader macro pressure from USD strength or yields limiting upside momentum.
If this idea resonates with you or you have your own opinion, traders, hit the comments. I’m excited to read your thoughts!
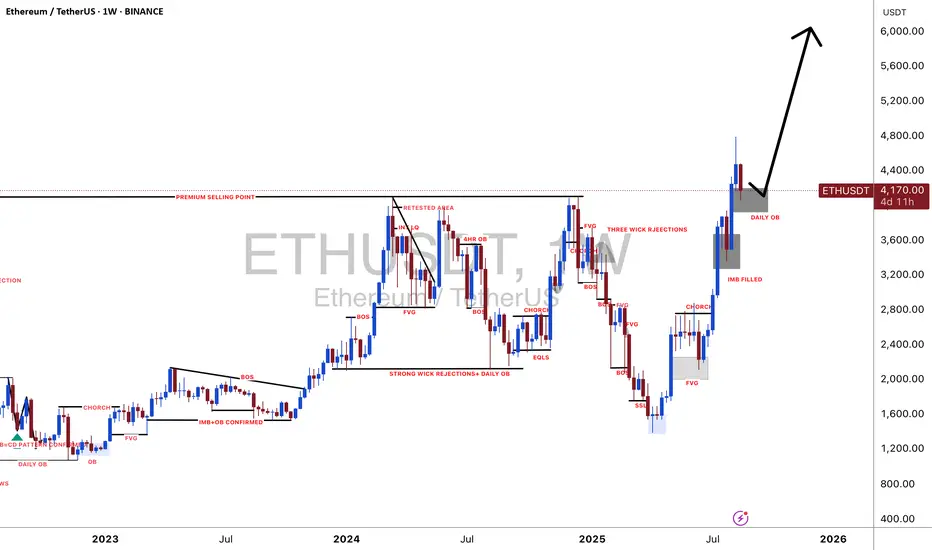
#ETHUSDT: $6000 Is The Next Target!!As we have been predicting since last one year or so, the ETH has reached almost $5000, now we can expect price to continue rising since it already made the correction. Target is $6000 this is swing target. Good luck and trade safe.
Team Setupsfx
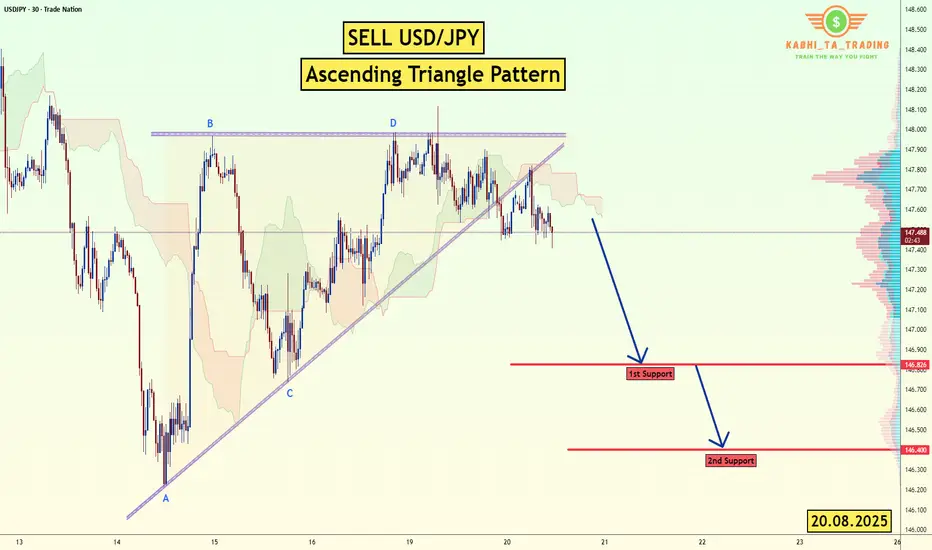
USD/JPY - Triangle Breakout (20.08.2025)The USD/JPY Pair on the M30 timeframe presents a Potential Selling Opportunity due to a recent Formation of a Ascending Triangle Pattern. This suggests a shift in momentum towards the downside in the coming hours.
Possible Short Trade:
Entry: Consider Entering A Short Position around Trendline Of The Pattern.
Target Levels:
1st Support – 146.82
2nd Support – 146.40
🎁 Please hit the like button and
🎁 Leave a comment to support for My Post !
Your likes and comments are incredibly motivating and will encourage me to share more analysis with you.
Best Regards, KABHI_TA_TRADING
Thank you.
Disclosure: I am part of Trade Nation's Influencer program and receive a monthly fee for using their TradingView charts in my analysis.
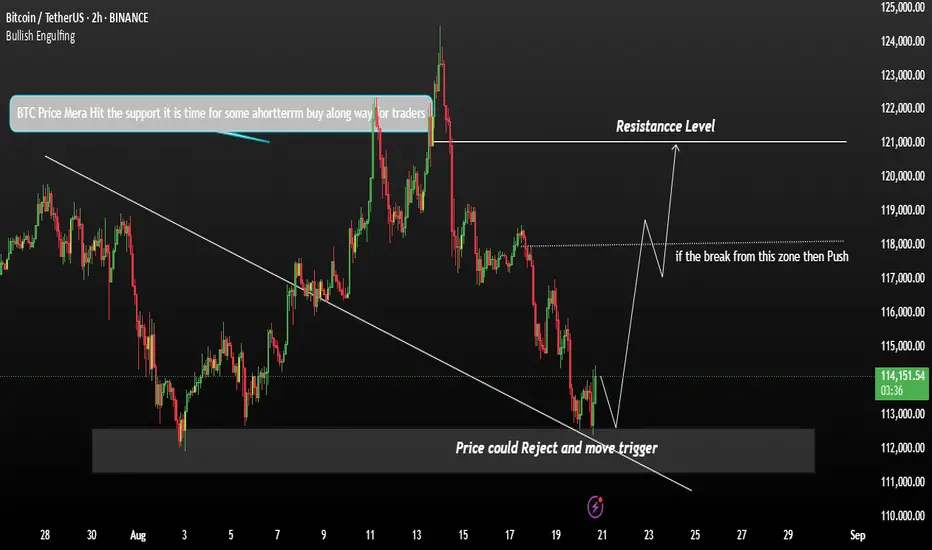
BTC Momentum Reject Bearish move to upside]BTC is showing signs of consolidation after recent growth and correction phases on the lower timeframes The market currently appears bearish, with red candles dominating the charts However, there may be a short-term buying opportunity forming.
Price recently rejected from a support level, indicating potential buying interest An attempt to break through support was denied, and the price reversed If BTC manages to hold and push above the current level 114K, we could see upside momentum It looks like you're sharing a technical analysis view on Bitcoin (BTC), but the message is a bit unclear due to grammar and structure. Let me help clean it up and rephrase your analysis so it's clearer and more actionable:
You May find more details in the chart
Trade wisely best of Luck.
Ps; Support with like and comments for better analysis,
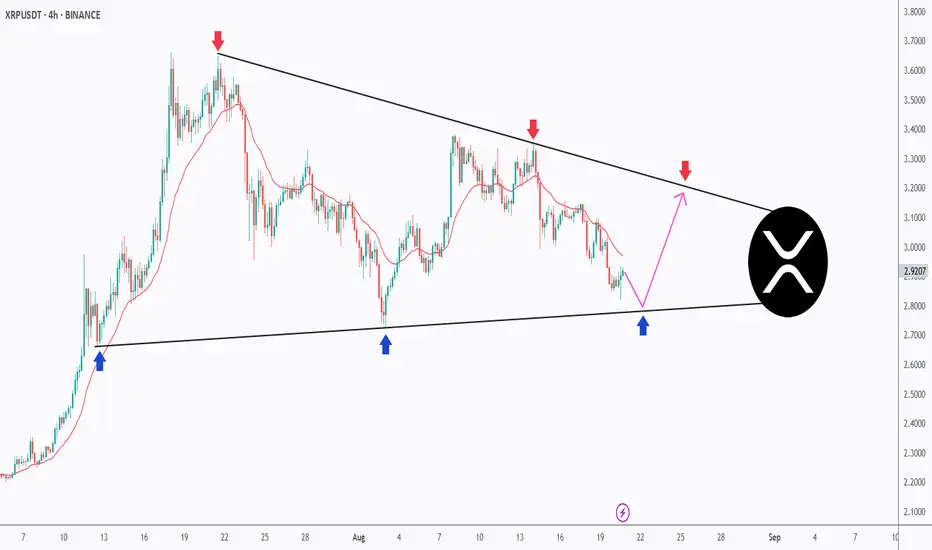
The Perfect Triangle – XRP’s Setup of the Month!XRP has been coiling up inside a textbook symmetrical triangle on the 4H timeframe.
🔻 Sellers are defending the descending trendline (red arrows).
🔹 Buyers keep stepping in at the rising support (blue arrows).
📉 Price is now retesting the lower bound, and as long as this zone holds, we can anticipate a potential bounce back toward the upper boundary.
🚀 A breakout from this formation will likely define XRP’s next major move — either continuation higher or a bearish breakdown.
This clean structure makes XRP one of the most exciting charts to watch this month!
⚠️ Disclaimer: This is not financial advice. Always do your own research and manage risk properly.
📚 Always follow your trading plan regarding entry, risk management, and trade management.
Good luck!
All Strategies Are Good; If Managed Properly!
~Richard Nasr
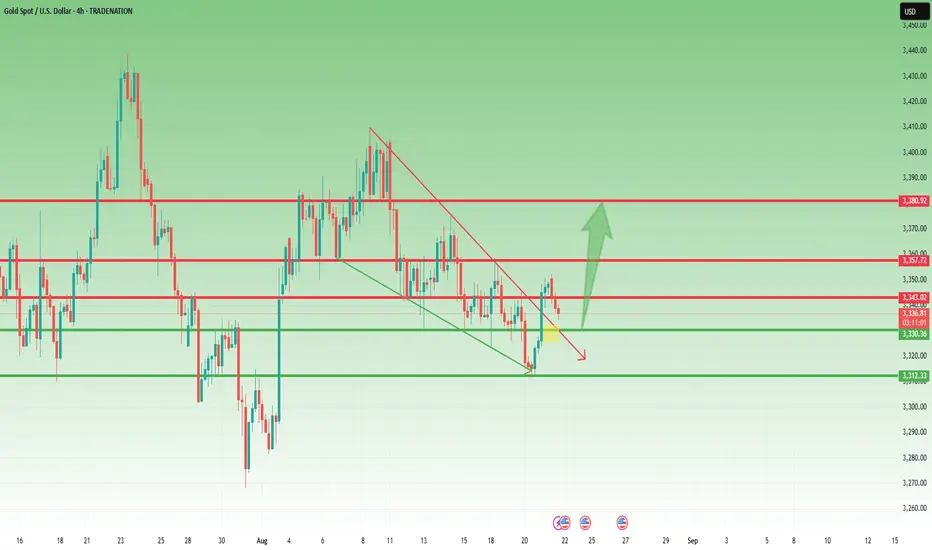
XAUUSD – Bullish Outlook Confirmed1. Yesterday’s Context
In my yesterday’s analysis, I mentioned that although Gold had broken below the 3330 support, it was most probably a false break.
Yesterday’s price action confirmed this view: Gold pushed back above the broken level, accelerated higher, and even broke above the falling wedge trendline, reaching a high around 3352. On top of that, the daily chart closed with a strong bullish engulfing pattern.
________________________________________
2. The Key Question
Is this the start of a larger bullish continuation?
________________________________________
3. Why the Setup Looks Bullish
• False break below 3330 quickly reversed.
• Break above the falling wedge trendline = strong bullish signal.
• Daily bullish engulfing confirms momentum shift.
• Technical structure now favors continuation to the upside.
________________________________________
4. Trading Plan
At the time of writing, Gold is in a normal correction after yesterday’s strong rally.
• I remain bullish.
• I am looking to buy dips into support zones.
• Target: around 3380 as the next upside level of interest.
________________________________________
5. Final Note 🚀
The outlook remains unchanged: the bias is bullish, and yesterday’s breakout gives conviction that buying dips is the right strategy.
Disclosure: I am part of TradeNation's Influencer program and receive a monthly fee for using their TradingView charts in my analyses and educational articles.