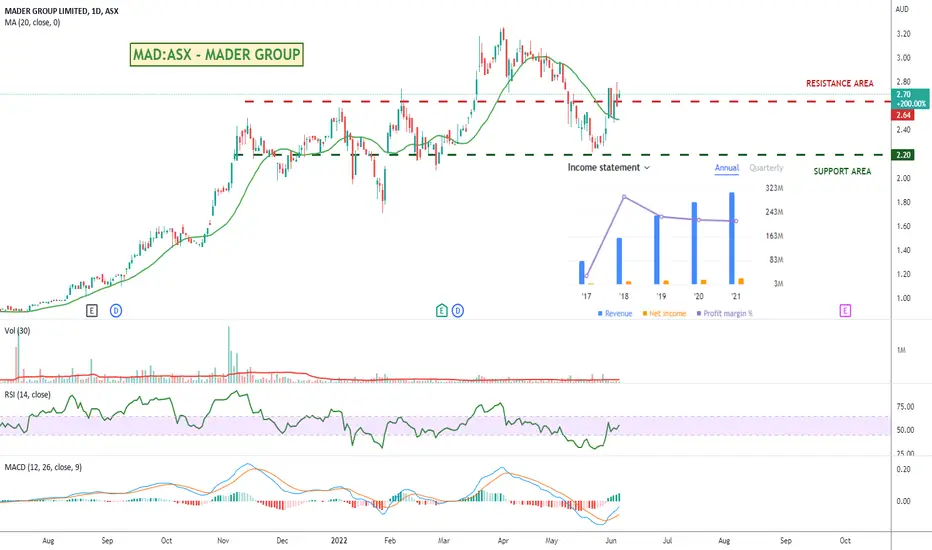
Australias Mader Group looking interestingMAD is back above that minor resistance level with the RSI and MACD showing a bit of strength.
Will be interesting to see if it gets rejected here or continues to move up over the next day or so.
Could be worth some more research.
Search in ideas for "zAngus"
Hype Play: Mattell (Barbie)Might be a fun one to watch. Mattell is coming up to earnings and with so much hype around the Barbie movie they are anticipating it will flow onto sales results. Whether it is too soon for this earnings round or more likely to have a bigger impact on the next one with the movie not yet released it will be interesting to see how the movie hype does indeed translate to sales.
Might be worth keeping en eye on.

MOMENTUM STOCK: Opera starting to recover?NASDAQ:OPRA is starting to look interesting again. After a MASSIVE 600% run followed by a deep 60% pullback some of the signals are showing some life might be coming back in the stock.
We are past earnings so hopefully no more surprises to come.
The RSI is heading back up
We got a deep cross of the MACD over the signal line, well below the zero line
Might need to wait for confirmation but could be one to watch. Definitely not trading advice, more just a previous runner that might be changing direction.

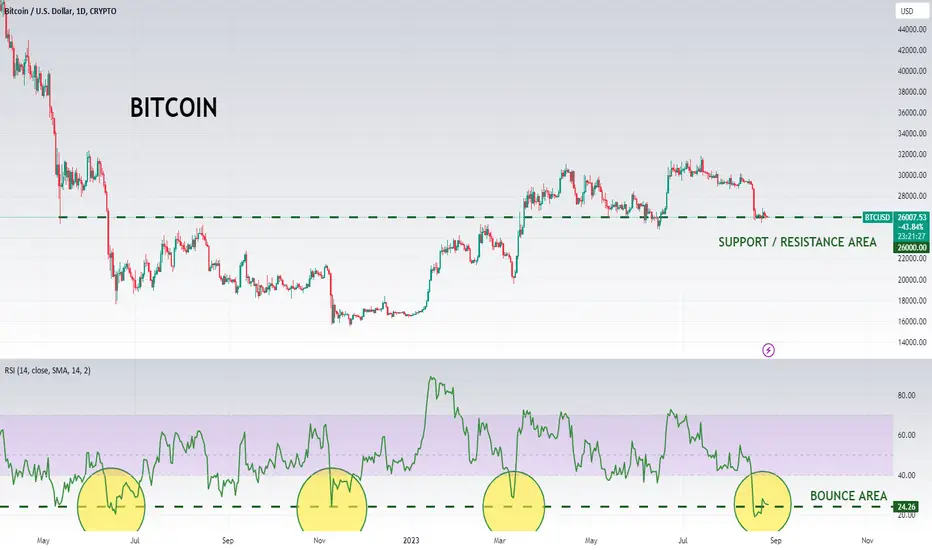
Bitcoin still stalled out.Bought a bunch of Bitcoin when it dropped previously to $16k and have been looking to top up but I've tried a few entries now over the last few weeks on what I thought might be a bottom opportunity here only to get stopped out again on weakness.
I like the look of where the RSI is, and it looks to be a reasonably good support area, but the markets continue to be great humblers :)
Will keep trying :)
Ryan Reynolds Buys Position in Canadian Payments Tech CompEarly days, but he has been flipping businesses quite successfully lately. On Monday, Reynolds revealed his investment in the Canadian financial technology firm, approximately one month after selling his partial ownership in the affordable wireless provider Mint Mobile to T-Mobile US Inc. for $1.35 billion.
Some upside to old levels so who knows.
Might be worth keeping an eye on.

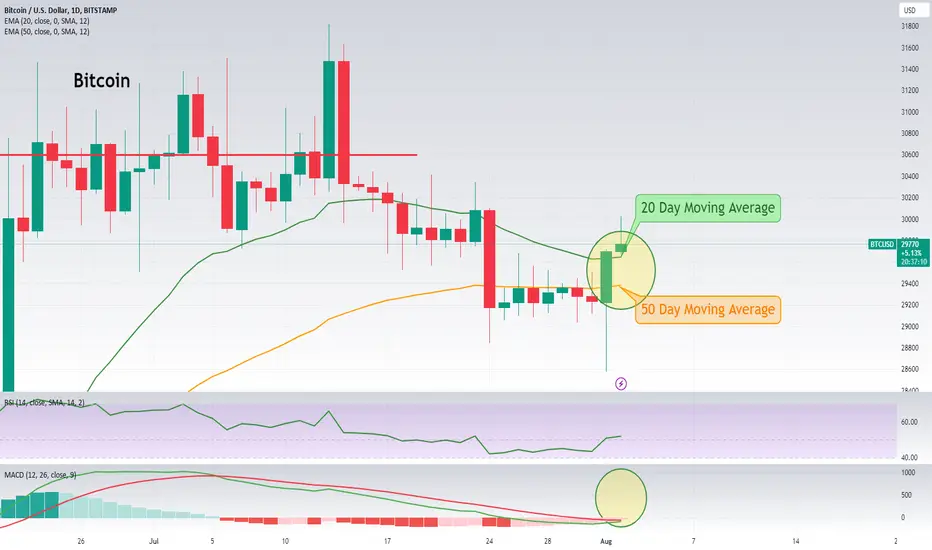
Bitcoin: Back Up Above Its Moving AveragesBITSTAMP:BTCUSD is finally back up above the 20 and 50 day moving averages that were providing resistance (if you believe in that sort of thing).
MACD looking more interesting though. Back below the 0 line and crossing which often indicates a bullish value area.
Here's hoping it regains some of its upwards momentum.
Bitcoin: Breaking out? Consolidating? About to Drop?We have been getting stuck in these sideways moves for a while now with Bitcoin, so what do you think?
1 = About to break out.
2 = Consolidating and will continue sideways for a while.
3 = This is the top and expect a drop back down the chart.

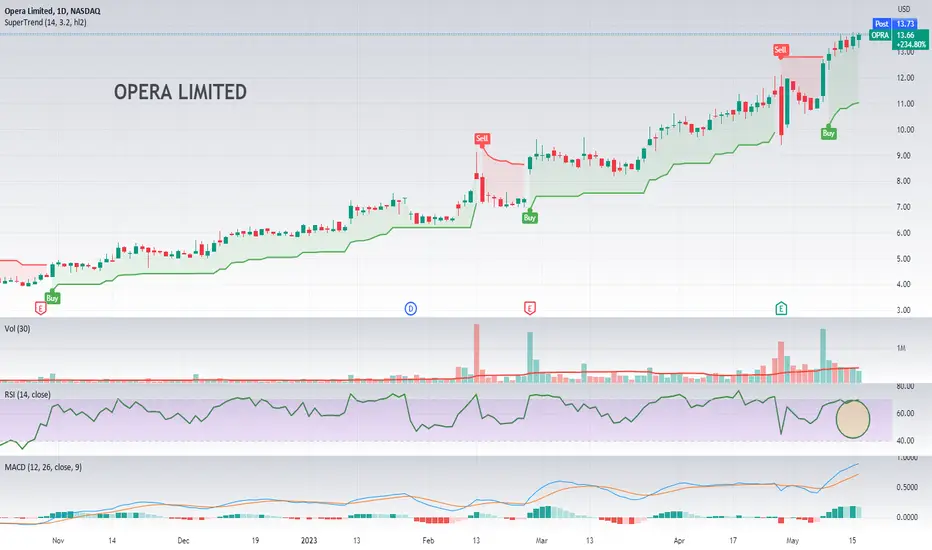
Momentum Stock: Opera LimitedOpera Ltd provides mobile and PC web browsers and operates in two primary segments, Browser and News, and Other. The company offers a variety of mobile and PC browser products, including Opera Mini, Opera for Android and iOS, Opera GX Mobile, and Opera Touch. Additionally, it also provides the Opera News service, a personalized news discovery and aggregation service powered by AI.
The company has shown robust price performance over the past year, with a 195.34% increase in share value. The growth has not just been in the long term; in the short term, the price has surged by 23.06% over the last month and 4.27% over the last five days. The current price is $13.66, just shy of its 52-week high of $13.78.
The company's market capitalization is $1.22 billion, indicating that it is a small-cap company. Despite this, Opera has seen substantial revenue growth, with a YoY quarterly revenue growth of 21.6%. However, it's crucial to note that it has seen a YoY quarterly earnings growth decline of -60%.
From a valuation perspective, the trailing PE ratio is at 33.975, which may seem high for some investors. However, given the company's growth, this could be justified. The company's Price to Sales ratio (TTM) is 2.22, and its Price to Book ratio (MRQ) is 0.65, suggesting that the stock might be undervalued relative to its assets.
From a technical perspective, the stock is in an upward momentum. The stock's current price of $13.66 is well above both the 50-day moving average of $10.36 and the 200-day moving average of $6.74. The volume has also been increasing, indicating a strong interest in the stock.
Furthermore, the technical oscillators, including the Relative Strength Index and MACD, indicate that the stock is in a bullish trend. The RSI is 69.69, which is just below the overbought threshold, suggesting that the stock still has room for upside.
However, investors should be aware of the increasing short interest in the stock, which has gone from 131,774 to 212,609. While not a large percentage of the float, this increase could indicate some market skepticism.
Opera does not pay a dividend, so it may not be suitable for income-focused investors. However, the company has a solid profit margin of 11.53% and a reasonable operating margin of 16.42%.
Wall Street analysts seem bullish on the stock. The stock has a rating of 5, with 4 analysts giving it a 'Strong Buy' rating. The target price is $14.25, suggesting a potential upside of around 4.3% from the current price.
Opera Ltd appears to be an interesting investment opportunity. The company is showing strong price gains, and its valuation ratios suggest that it might be undervalued relative to its assets and sales. The positive analyst ratings and technical indicators also lend support to this view. However, as always, potential investors should conduct their own thorough research before making investment decisions.
Right now to me it looks too expensive, and I would want to wait for a pull back closer to the SuperTrend line and an RSI in the low 50's. I would use TradingView to set an alert on the RSI to message me when it is CROSSING UP through 55. That way it has had its pullback and is now heading back up and I don't have to look at it again until then. Nice run so far though.
In terms of risk management, this is a much more volatile stock and you would need a higher trailing stop loss of around 18% which would have kept you in most of this trade. If it broke below that it could have been a good sign to exit and look for a new entry when the trend resumed.
One to watch.
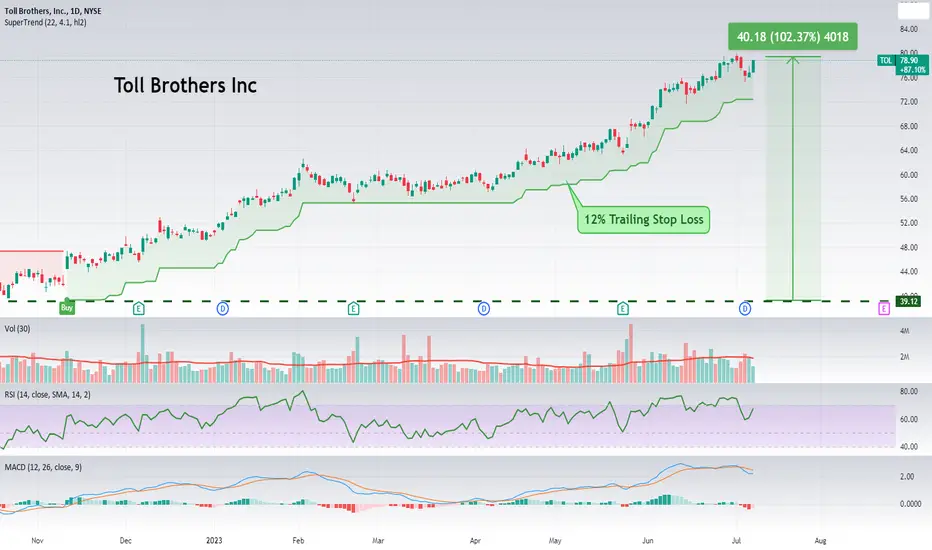
Momentum Stock: Toll BrothersToll Brothers, Inc. is an American real estate company known for its emphasis on luxury. It operates primarily in the residential real estate sector, focusing on the design, construction, and sale of various types of homes across the country. These range from detached and attached homes in luxury residential communities to condominiums through its City Living division. Their clientele primarily includes first-time, move-up, empty-nester, active-adult, and second-home buyers.
In addition to residential properties, Toll Brothers also has a broad scope of operations. The company designs a range of single-story living and first-floor primary bedroom suite home designs. It also develops communities with recreational amenities like golf courses, marinas, and fitness centers. It has land development and selling arms, as well as apartment development, operation, and rental divisions. The company also provides several interior fit-out options such as flooring, lighting, and home-automation, thereby increasing its engagement with customers and strengthening its role in the housing market.
Toll Brothers' strong financial performance and market position can make it an attractive proposition for stock investors. As of 11th July 2023, Toll Brothers has a market capitalization of $8.63 billion and an EBITDA of $1.84 billion. The company also exhibits a healthy Profit Margin of 13.59% and an Operating Margin TTM of 16.86%, indicating strong operational efficiency.
The performance of Toll Brothers' stock also stands out. The stock has appreciated by 68.16% in the past year (or closer to 100% from the lows and highs of its run), while its five-year and all-time price performance stands at 106.82% and 3844.98% respectively. Such long-term appreciation signals robust business growth and operational strength, thereby generating significant investor interest.
Moreover, the company has a solid dividend policy, providing a yield of 1.09%. This could be an attractive aspect for income-oriented investors. Additionally, the company's P/E ratio stands at 6.37, which is relatively low, suggesting the stock could be undervalued given the company’s earnings.
Toll Brothers also has strong institutional backing. Major institutions, including Vanguard Group Inc and BlackRock Inc, hold substantial shares in the company, which generally lends credibility and stability to the stock.
However, potential investors should also consider the associated risks. The real estate market is cyclical and can be affected by various factors, including interest rates, economic conditions, and government regulations. Furthermore, investors should keep an eye on the company's debt levels and monitor insider selling, which might suggest potential concerns among those with intimate knowledge of the company.
Toll Brothers presents an interesting investment opportunity due to its strong market position in the luxury housing market, robust financial performance, consistent dividend policy, and significant stock appreciation over time. Potential investors should weigh these strengths against the inherent risks associated with the real estate market and the company's specific financial structure.
In terms of any kind of short term entry, I would want to wait for a pullback with an indication of the uptrend continuing in order to get better value. The RSI and MACD are both pretty high at the moment which you would expect for a momentum stock, but you can see where they have dipped down to in the past and where better value for an entry might be found.
For risk management, a trailing stop loss of around 12% would have kept you in most of this trade. If it broke below that it could have been a good sign to exit and look for a new entry when the trend resumed.
As always how you interpret and decide to act on any results is up to you. This is just data not financial or trading advice and past performance is in no way any guarantee of future performance. Think of it as a way to spot stocks you might be interested in and can add to your watch list and perform further research on and or discuss with your broker.
Again. Not trading advice . Industries and companies change. Trends can end. Do your own research / discuss it with your advisor, but might be one to watch.
Momentum Stock: Elf BeautyELF Beauty Inc is a cosmetics company that offers a range of beauty products primarily for young adults. Their product line includes makeup, skincare, and other related beauty accessories, positioning themselves as a value-oriented, high-quality brand.
Price Performance
Looking at their stock price performance, ELF Beauty Inc has shown robust growth over the past few years. The current price stands at $90.14, marking a substantial increase from its earlier values, as reflected by its impressive 1-year gain of approximately 281.63% and 5-year gain of 350.70%. Its 6-month gain and year-to-date gain are also notable at 68.33% and 60.48%, respectively, indicating sustained and consistent upward momentum.
Relative Strength Index Analysis
The company's relative strength index (RSI) stands at 53. The RSI is a momentum indicator that measures the speed and change of price movements. An RSI value of 70 or above indicates that a stock might be overbought and possibly due for a price correction, while an RSI value of 30 or below could imply that the stock is oversold and might be undervalued. An RSI of 53 for ELF Beauty Inc suggests that the stock is neither overbought nor oversold at the current price level.
Financial Highlights Analysis
ELF Beauty Inc has a market capitalization of approximately $4.78 billion and an EBITDA of $79.6 million. Its Price to Earnings (P/E) ratio is high at 103.092, which may suggest overvaluation, but this can be justified if the company’s future earnings growth is strong. Moreover, the PEG ratio of 2.03 indicates that the company's earnings are expected to grow at a decent pace. The company's profit margin stands at 9.43%, reflecting its ability to generate profits from its revenues. The return on equity (ROE) at 13.56% indicates that ELF Beauty Inc is utilizing its investors' funds effectively.
Valuation Analysis
A closer look at the company’s valuation metrics reveals that the Trailing PE is considerably high at 103.092 while the Forward PE is significantly lower at 45.8716, indicating expectations of improved earnings. The price-to-sales ratio (P/S) of 6.43 and price-to-book ratio (P/B) of 8.35 suggest a relatively high valuation, which can be justified if the company maintains a steady growth trajectory.
Share Statistics and Technical Analysis
There are about 53.3 million shares of ELF Beauty Inc outstanding with approximately 49.9 million floating in the market. The Beta value of 1.5039 suggests that the company’s stock price is relatively more volatile than the overall market. This high beta might offer potential for higher returns but also poses a higher risk.
Dividends and Splits
ELF Beauty Inc does not currently pay dividends, which is not unusual for growth-oriented companies that prefer to reinvest earnings back into the business to fuel further expansion.
Analyst Recommendations and Forecasts
The analyst sentiment towards ELF Beauty Inc is generally positive, as represented by an average rating of 4.0769 out of 5. This rating is a composite score, reflecting the views of 13 analysts in total. A closer examination of individual recommendations reveals that five analysts have issued a "strong buy" recommendation, four analysts have recommended a "buy," while four analysts have suggested a "hold" for the stock. Importantly, no analysts have recommended a "sell" or "strong sell," underscoring the overall optimistic outlook.
The target price set by Wall Street analysts is $97.1, which indicates a potential upside of around 7.7% from the current price of $90.14. The favorable difference between the current price and the target price, combined with the generally positive analyst sentiment, suggests that the market professionals see potential for further growth in ELF Beauty's stock. However, it is always important to keep in mind that these are forecasts and not guarantees, and the actual performance could differ based on a variety of factors.
Major Shareholders
Major institutional shareholders include BlackRock Inc, Vanguard Group Inc, and State Street Corporation. Recent changes in share ownership reveal mixed trends, with some institutions increasing their holdings while others have decreased. It is worth noting that high institutional ownership can often be a positive sign, but it's also important to consider the trend of ownership changes.
Insider Trading Analysis
Insider trading activity can offer valuable insights into how those most closely associated with a company view its potential. Looking at the recent insider trading activities for ELF Beauty Inc, there has been a mix of buying and selling activity over the past 12 months. However, the overall net activity suggests a relatively neutral stance, and therefore, it is difficult to draw firm conclusions based on this alone.
Overview
Overall, ELF Beauty Inc has demonstrated strong growth and performance in the past, with its stock price reflecting this success. The company's financials are robust, and it seems to be positioned well for future growth. The company's valuation may seem high, but considering the strong growth in the cosmetics and beauty industry, it could be justified. Furthermore, a positive analyst outlook points to potential future gains.
However, it is important to remember that while the analysis presented here provides a comprehensive overview of the company, potential investors should always conduct their own due diligence and consider their individual risk tolerance and investment goals before making investment decisions.
Short Term Outlook
In terms of any kind of short term entry, the stock has had a pretty strong pullback and you would need to wait to see if it turns around. We are coming up to earnings so I would definitely want to wait to see how that plays out before making any purchasing decisions.
I would pay particular attention to any upwards movement on both the RSI and MACD for any kind of confirmation. For downside risk management, a trailing stop loss of around 12% would have kept you in most of this trade. If it broke below that it could have been a good sign to exit and look for a new entry when the trend resumed.
As always how you interpret and decide to act on any results is up to you. This is just data not financial or trading advice and past performance is in no way any guarantee of future performance. Think of it as a way to spot stocks you might be interested in and can add to your watch list and perform further research on and or discuss with your broker.
Again. Not trading advice . Industries and companies change. Trends can end. Do your own research / discuss it with your advisor, but might be one to watch.

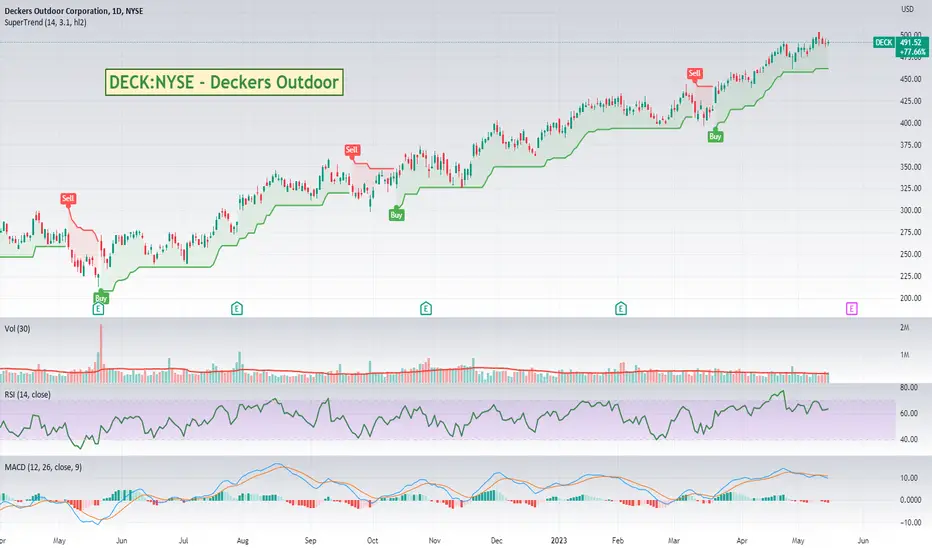
Momentum Stock: Deckers Outdoor CorporationDeckers Outdoor Corporation is a global leader in designing, marketing, and distributing innovative footwear, apparel, and accessories. With popular brands such as UGG, Teva, Sanuk, and HOKA ONE ONE under its banner, the corporation has positioned itself prominently within the retail and consumer goods sector. Notably, the company's commitment to innovation, quality, and sustainability has been instrumental in attracting a loyal customer base and in expanding its global retail footprint.
As of the 15th May 2023, from a financial perspective DECK's recent performance has been promising. The stock has made significant gains over the past year, with its price appreciating by 107.66%. This trend of robust growth has continued across the last six months (49.07%), three months (16.81%), and one month (5.24%). However, the stock has slipped slightly over the past five days, decreasing by -1.08%, which might be a momentary correction in an otherwise upward trend.
An examination of DECK's moving averages, which smooth out price fluctuations and provide a clearer trend picture, indicates positive momentum. The 50-day Exponential Moving Average (EMA) is at $462.47, and the 200-day EMA stands at $389.52. Both are significantly lower than the current closing price of $491.52, suggesting a bullish trend.
The volume of shares traded, another important indicator of momentum, stands at 368,527, slightly above the 14-day average volume of 312,794.79. This increased trading activity could indicate heightened investor interest in the stock.
The Relative Strength Index (RSI), a momentum oscillator that measures the speed and change of price movements, stands at 63.34. This figure suggests the stock is nearing overbought territory (an RSI above 70 indicates overbought conditions), but it's not there yet, leaving some room for further price appreciation.
In terms of valuation, DECK's Price-to-Earnings (PE) ratio is 26.64, and its forward PE, which is based on predicted earnings, is 16.56. These figures suggest that the stock is currently fairly valued or slightly overvalued, depending on the market comparison.
Moreover, DECK has a solid market capitalization of $13.09 billion and a decent EBITDA of $678 million, contributing to its strong financial standing. It's also worth noting that the company has a healthy profit margin of 13.83% and a return on equity of 29.63%, indicating efficient management and profitable operations.
The analysts' average target price for DECK is $506.5, which indicates a potential upside of about 3% from the current closing price. The majority of analysts rate the stock as a "Strong Buy" or "Buy," with only a few recommending a "Hold" and none advising "Sell" or "Strong Sell." This suggests a generally positive outlook from the analyst community.
However, it's essential to note that despite DECK's strong performance and positive indicators, the stock does not offer a dividend, which may deter income-focused investors. Plus, as with any investment, DECK's performance should be viewed in light of the investor's individual financial goals, risk tolerance, and investment horizon. It's always advisable to diversify investments and not rely too heavily on one stock or sector.
Risk Management - A Trailing Stop Loss of 15% would have kept you in most of this trade. If it broke below that it could have been a good sign to exit and look for a new entry when the trend resumed.
Might be one to watch.
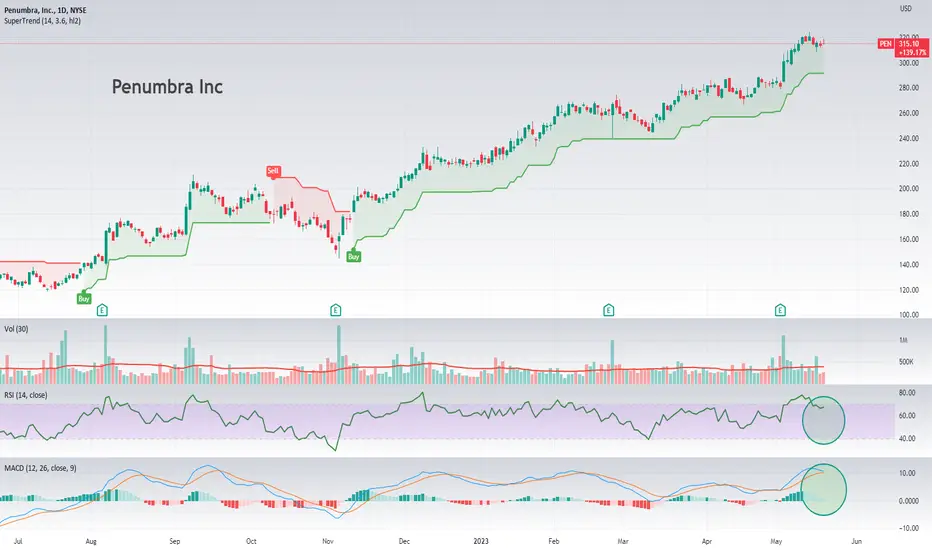
Momentum Stock: Penumbra IncPenumbra, Inc. is a global healthcare company focused on innovative therapies. The company designs, develops, manufactures, and markets innovative devices and has a broad portfolio of products that addresses challenging medical conditions and significant clinical needs across two major markets, neuro and vascular.
Pricing and Performance
Currently priced at $315.10, Penumbra has experienced steady growth with its stock value rising over 687.75% since inception. In the past year alone, the company saw a rise of 113.02%, with an impressive 61.18% in the last 6 months and 38.74% year to date. Even with short-term volatility, as indicated by a decrease of 1.74% over the past week, the longer-term trend has been positive.
Financial Highlights
Penumbra has a market capitalization of approximately $12 billion. It reported an EBITDA of $41.6 million, highlighting its ability to generate operational profits. However, a price-to-earnings (P/E) ratio of 1964.25 suggests the stock is highly overvalued relative to its earnings. The company does not pay a dividend, indicating that it may be reinvesting its earnings to fuel its high growth. The estimated earnings per share for the current year is $1.53, expected to increase to $2.55 next year, suggesting analysts expect continued growth.
Valuation
The company's trailing price to earnings ratio, at 1964.25, and forward price to earnings ratio, at 277.77, suggest a high valuation. Moreover, the company's price to sales ratio of over 10 further signals potential overvaluation. However, these high ratios might be justified by the company's strong growth and potential in the market.
Share Statistics
Penumbra has approximately 38.18 million shares outstanding, with a majority of these (91.3%) held by institutional investors. The relatively low percentage of insider ownership (3.91%) might indicate a lack of confidence from the management, or simply a high level of institutional interest.
Technical Analysis
The company has a relatively low beta value of 0.54, indicating that the stock is less volatile than the market. Despite the high short ratio of 12.13, the short percent is relatively low at 0.1448, suggesting that the majority of investors are bullish on the stock.
Analyst Ratings
Out of 12 analysts covering the stock, 8 rate it as a strong buy and 3 as a buy, while only one suggests a hold. No analysts recommend selling. The average target price is $314.22, just below the current stock price, indicating that analysts believe the stock is fairly valued at current levels.
Institutional Holdings
The stock is highly held by institutions, with FMR Inc, BlackRock Inc, and Vanguard Group Inc being among the largest shareholders. This high level of institutional ownership often signals confidence in the company's outlook.
Insider Transactions
Recent insider trading activity shows both sales and acquisitions of the company’s shares. The transactions have generally been sales, which might be a cause for concern, as it could indicate that insiders are cashing in on the recent price increase, but this is only one of many factors to consider.
Outlook
While Penumbra's high P/E ratio might suggest overvaluation, the company's consistent growth, positive earnings forecasts, and high institutional ownership indicate that it may have strong future potential. As always, individual investors should consider their risk tolerance and investment goals before investing.
In terms of any kind of short term entry, the stock "reads" as potentially expensive so I would want to wait for a pullback to below and then crossing back up through the low 50's area for the RSI . For risk management, a trailing stop loss of around 12% would have kept you in most of this trade. If it broke below that it could have been a good sign to exit and look for a new entry when the trend resumed.
As always how you interpret and decide to act on any results is up to you. This is just data not financial or trading advice and past performance is in no way any guarantee of future performance. Think of it as a way to spot stocks you might be interested in and can add to your watch list and perform further research on and or discuss with your broker.
Again. Not trading advice . Industries and companies change. Trends can end. Do your own research / discuss it with your advisor, but might be one to watch.
Bitcoin Finally Breaking Out.After having travelled sideways for weeks BTC is finally making a move breaking out above it upper Bollinger and above its previous horizontal resistance.
Is this the start of a new run? Too soon to tell. Will it need a pull back to retest that resistance area and begin to use it as support - also too soon to tell.
I'd like to see it get to FWB:31K and see if it starts to trigger many if any stop losses that short holders might have placed up around there.
One to watch...

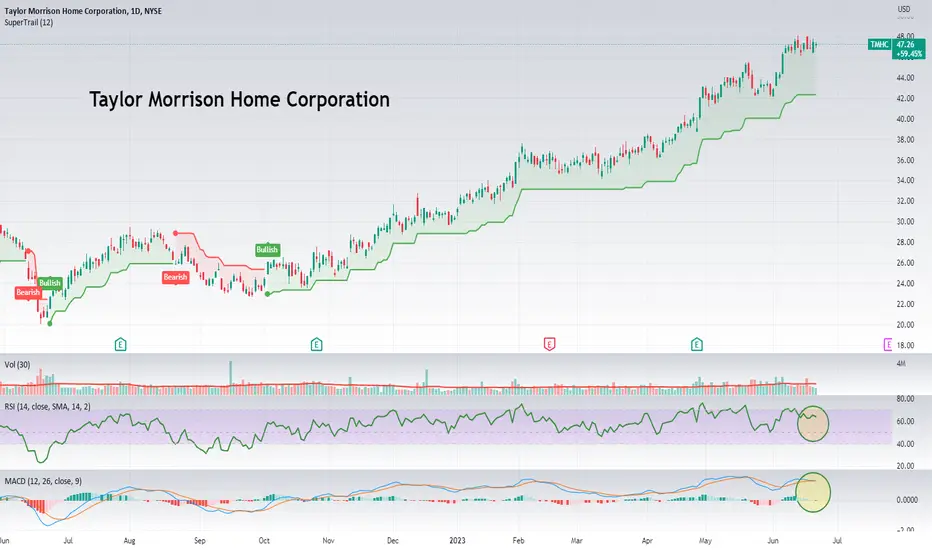
Momentum Stock: Taylor Morrison Home CorporationTaylor Morrison Home Corporation is a national homebuilder and land developer in the U.S., specializing in the construction and sale of single-family detached and attached homes. The company's investment appeal lies in its strategic expansion across desirable real estate markets, providing geographical diversification and resilience against localized market downturns. Further bolstering its attractiveness to investors, Taylor Morrison has a strong commitment to customer satisfaction and quality homes, alongside robust financial performance. Its emphasis on sustainable practices aligns with growing ESG investment trends, making it an intriguing choice for investors seeking stability, growth, and sustainability within a single investment.
In terms of any kind of short term entry, I would want to wait for a pullback with an indication of the uptrend continuing in order to get better value. The RSI and MACD are both pretty high at the moment which you would expect for a momentum stock, but you can see where they have dipped down to in the past and where better value for an entry might be found.
For risk management, a trailing stop loss of around 12% would have kept you in most of this trade. If it broke below that it could have been a good sign to exit and look for a new entry when the trend resumed.
As always how you interpret and decide to act on any results is up to you. This is just data not financial or trading advice and past performance is in no way any guarantee of future performance. Think of it as a way to spot stocks you might be interested in and can add to your watch list and perform further research on and or discuss with your broker.
Again. Not trading advice . Industries and companies change. Trends can end. Do your own research / discuss it with your advisor, but might be one to watch.
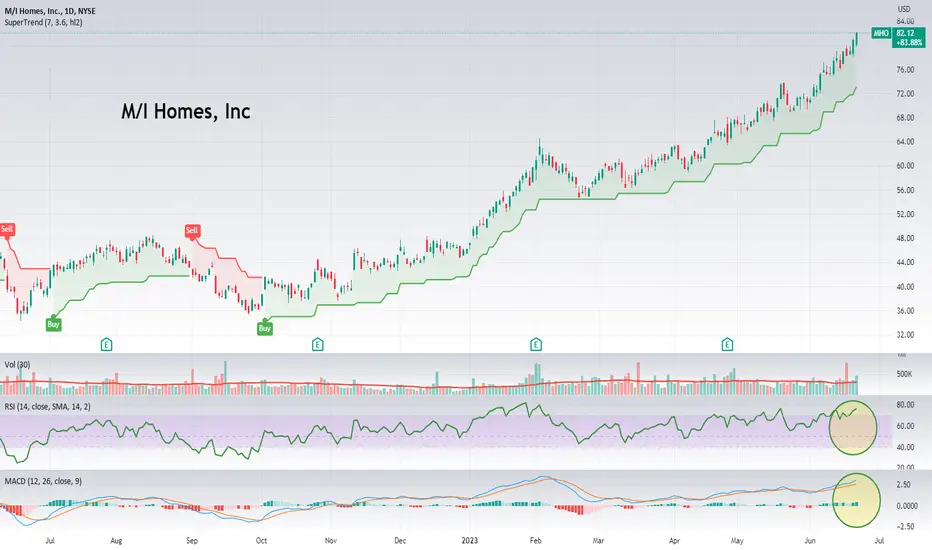
Momentum Stock - M/I HomesM/I Homes, Inc . is a leading US-based home construction company that offers comprehensive homebuying experiences, including financing. Its long-standing market presence, consistent growth, robust financial performance, and commitment to sustainable practices make it a compelling option for investors seeking stability and long-term value creation.
In terms of any kind of short term entry, I would want to wait for a pullback with an indication of the uptrend continuing in order to get better value. For risk management, a trailing stop loss of around 16% would have kept you in most of this trade. If it broke below that it could have been a good sign to exit and look for a new entry when the trend resumed.
As always how you interpret and decide to act on any results is up to you. This is just data not financial or trading advice and past performance is in no way any guarantee of future performance. Think of it as a way to spot stocks you might be interested in and can add to your watch list and perform further research on and or discuss with your broker.
Again. Not trading advice . Industries and companies change. Trends can end. Do your own research / discuss it with your advisor, but might be one to watch.
Momentum Stock: Sterling InfrastructureSterling Infrastructure is an established organization in the heavy civil construction sector with a primary focus on infrastructure projects.
It has had a great run over the last 12 months but looking at the technicals that I like it does look overextended and I would be wanting to wait for a pull back into a better value area before considering any trade.
For risk management, a trailing stop loss of around 14% would have kept you in most of this trade. If it broke below that it could have been a good sign to exit and look for a new entry when the trend resumed.
As always how you interpret and decide to act on any results is up to you. This is just data not financial or trading advice and past performance is in no way any guarantee of future performance. Think of it as a way to spot stocks you might be interested in and can add to your watch list and perform further research on and or discuss with your broker.
Again. Not trading advice . Industries and companies change. Trends can end. Do your own research / discuss it with your advisor, but might be one to watch.

Momentum Stock: UFP TechnologiesUFP Technologies specializes in the design and custom manufacturing of components, subassemblies, products, and packaging using specific foams, films, and plastics. The company's primary focus is on the medical market, where its single-use and single-patient devices and components find applications in a variety of medical devices, disposable wound care products, infection prevention, minimally invasive surgery, wearables, orthopedic soft goods, and orthopedic implant packaging.
Beyond the medical field, UFP Technologies also provides its engineered products and components to customers across various industries, including automotive, aerospace and defense, consumer, electronics, and industrial markets. Its products are used in diverse applications such as military uniform and gear components, automotive interior trim, athletic padding, environmentally protective packaging, air filtration, abrasive nail files, and protective cases and inserts.
They have been having a great run over the last many years, but are a very volatile stock to try and hang onto. In terms of any kind of entry, I would want to wait for a significant pullback to a better value area. It certainly looks expensive on the current technicals but you can see longer term how it has performed.
As always how you interpret and decide to act on any results is up to you. This is just data not financial or trading advice and past performance is in no way any guarantee of future performance. Think of it as a way to spot stocks you might be interested in and can add to your watch list and perform further research on and or discuss with your broker.
Again. Not trading advice . Industries and companies change. Trends can end. Do your own research / discuss it with your advisor, but might be one to watch.

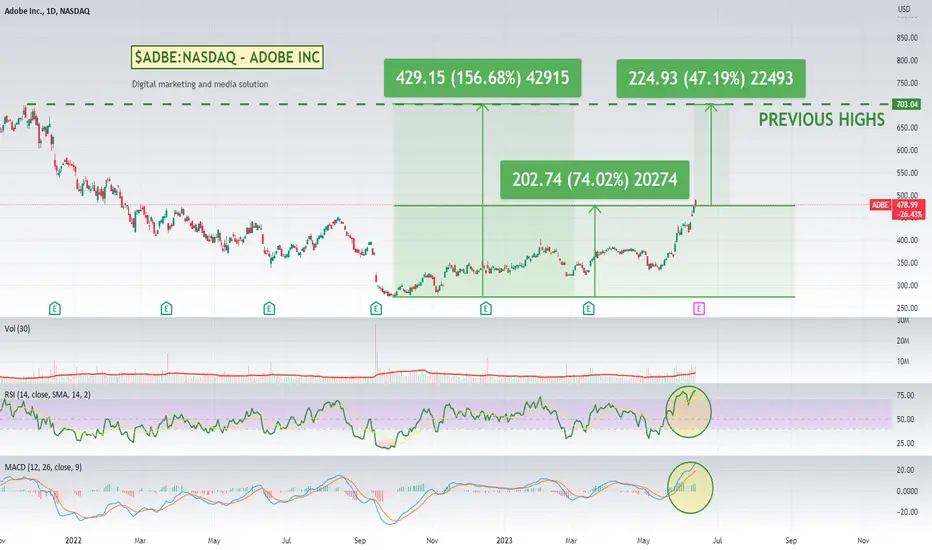
Momentum Stock: Adobe IncAdobe has been on a good upward run over the last 9 months recovering a bit over half of its drop from previous highs. I think they are well positioned to take advantage of all the AI momentum and be able to deeply integrate it with their products. Could lead to a significant revival for the brand and its products.
With earnings only 2 days out it is looking a bit expensive on some of the technicals, but I think longer term it could be an interesting stock.
As always how you interpret and decide to act on any results is up to you. This is just data not financial or trading advice and past performance is in no way any guarantee of future performance. Think of it as a way to spot stocks you might be interested in and can add to your watch list and perform further research on and or discuss with your broker.
Again. Not trading advice . Industries and companies change. Trends can end. Do your own research / discuss it with your advisor, but might be one to watch.
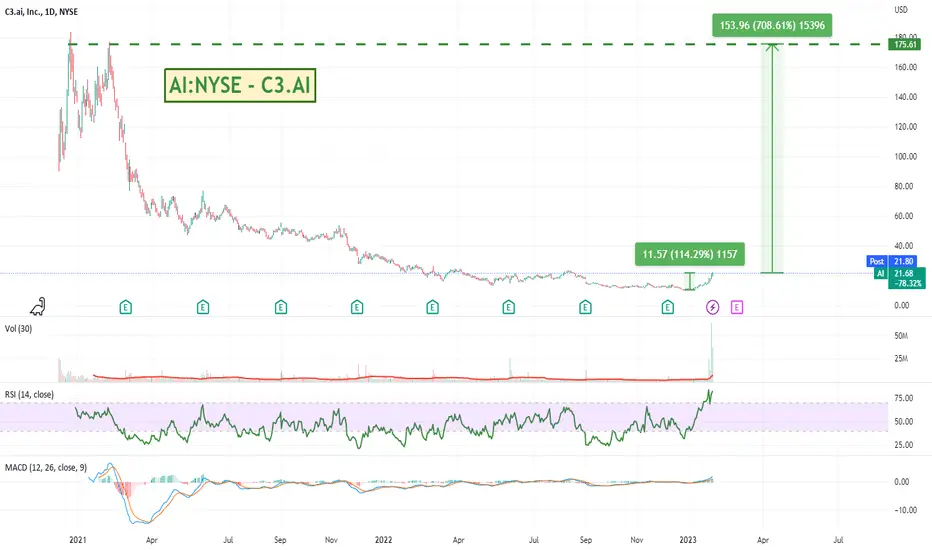
C3.AI Running Hard on the AI HypeUp 100% over the last few days but WELL down from its original launch highs. Looks well and truly overbought, but the hype around AI will probably be the next big bubble. I'm starting to look for AI stocks but they are definitely super speculative at these early stages.
Stocks like NVDIA and AMD more likely to be the big boy long term winners, but some of these smaller speccies could be worth a watch.
Check out their web page and see what you think.
c3.ai
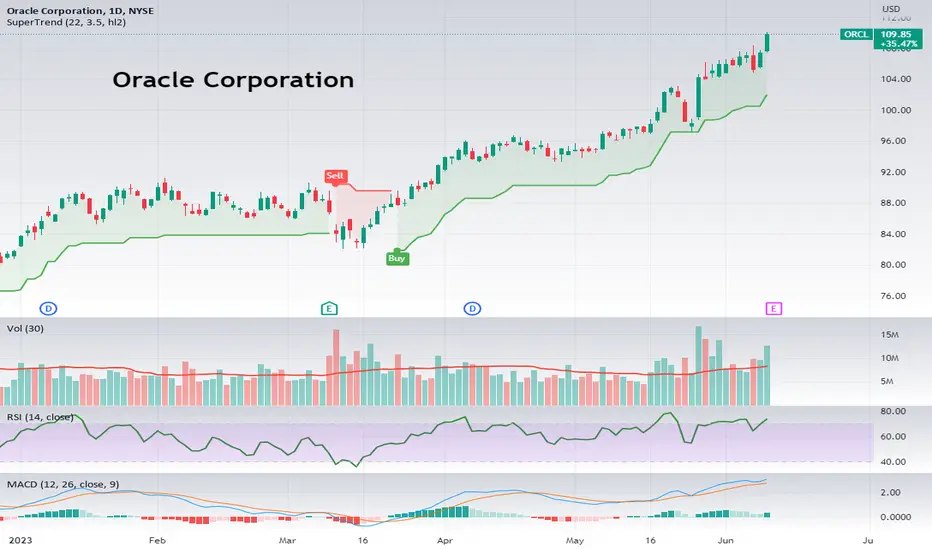
Momentum Stock: Oracle CorporationOracle Corporation is renowned for developing and selling database software and technology, cloud engineered systems, and enterprise software products, particularly its own brands of database management systems.
It has been in a nice steady uptrend for most of the year and is up a bit over 55% for the previous 12 month period. Earnings are only a few days away so will be interesting to see what happens.
Mongo , a similar business had a massive 40% gap up its earnings.
Oracle might be a bit expensive at the moment looking at the RSI, MACD and how far away from the SuperTrend it is, but anything could happen with earnings.
A trailing stop loss of around 8% would have kept you in most of this trade which is very low volatility. If it broke below that it could have been a good sign to exit and look for a new entry when the trend resumed.
As always how you interpret and decide to act on any results is up to you. This is just data not financial or trading advice and past performance is in no way any guarantee of future performance. Think of it as a way to spot stocks you might be interested in and can add to your watch list and perform further research on and or discuss with your broker.
Again. Not trading advice . Industries and companies change. Trends can end. Do your own research / discuss it with your advisor, but might be one to watch.
Momentum Stock: Symbiotic IncSymbotic Inc. is a company that specializes in the creation and implementation of automation technology, more specifically, robotics designed to streamline and enhance the efficiency of warehouse operations for retailers and wholesalers. Their main offering, the Symbotic system, is a comprehensive warehouse automation solution for product distribution. This not only includes the design and assembly of modular inventory management systems but also the installation and configuration of embedded software that drives these systems.
What makes Symbotic stand out is their innovative utilization of artificial intelligence (AI) and sophisticated software in tandem with cutting-edge robotics . Their AI-powered robots are capable of autonomously navigating expansive warehouse structures as large as a football field, reaching speeds of over 20 mph. This enables the rapid and precise movement of goods through the supply chain, providing substantial benefits in terms of time, cost, and resource efficiency.
From an investor's perspective, Symbotic's focus on AI and robotics within the warehousing and logistics industry could be highly attractive. Their technology targets a key area in the retail and wholesale sectors that stands to greatly benefit from increased automation and efficiency. As businesses strive for faster and more cost-effective supply chains to meet growing consumer demand, the products and services offered by Symbotic could potentially see increased adoption.
Additionally, the company's emphasis on AI technology aligns with broader market trends toward digitization and automation, which may create substantial growth opportunities in the future. It's also worth noting that as of 2023, Symbotic operates not only in the United States but also has clients in Canada, suggesting a capacity for international expansion.
All these factors, combined with the growing demand for innovative, AI-driven solutions in the logistics industry, make Symbotic a company worth considering for investors interested in the intersection of AI, robotics, and supply chain management. In the short-term however you would probably want to wait for a pull back or consolidation in price before making any decisions to enter depending on how long you want to hold the stock for.
As always how you interpret and decide to act on any results is up to you. This is just data not financial or trading advice and past performance is in no way any guarantee of future performance. Think of it as a way to spot stocks you might be interested in and can add to your watch list and perform further research on and or discuss with your broker.
Again. Not trading advice . Industries and companies change. Trends can end. Do your own research / discuss it with your advisor, but might be one to watch.

Strong Aftermarket Move for NVIDIA on earnings. Nvidia Corp. has given a bullish revenue outlook for the current quarter, with sales in the three months ending in April expected to be about $6.5 billion, compared to analysts' average estimate of $6.35 billion. The positive forecast is due to Nvidia's push into artificial intelligence processors, which is helping offset sluggish demand for personal computer chips. The company has also announced its own AI cloud service, in partnership with Oracle, Microsoft and Google, which will offer the ability to use Nvidia GTX machines for AI processing via simple browser access. The shares climbed as much as 9.1% after the report was released, making Nvidia the world's most valuable chipmaker again. However, the company's dependence on the PC market for a large chunk of sales still dragged on its results last quarter.
Worth a watch.

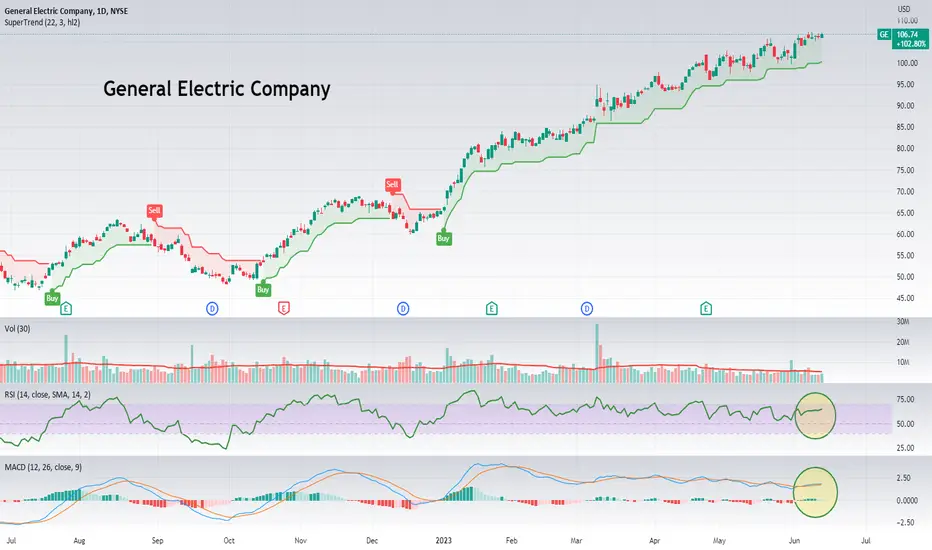
Momentum Stock: General Electric CompanyGeneral Electric is a diversified technology and financial services company. It operates in a vast array of sectors including power generation, aviation, healthcare, and financial services. Headquartered in Boston, Massachusetts, it serves customers in Europe, China, Asia, the Americas, the Middle East, and Africa.
Over the past six months, General Electric's stock price has risen a staggering 70.83%, with a one-year increase of 96.90%. The five-year growth stands at 26.88%, and an all-time increase of 1685.87%. This strong upward price movement could potentially interest investors looking for capital appreciation.
In terms of valuation, General Electric has a trailing P/E ratio of 14.65, which compares favorably with the industry average, implying it is undervalued relative to its earnings. The forward P/E ratio, which considers future earnings, stands at 18.14, indicating that the market expects the company to continue growing. The company's Price/Sales ratio is 1.14, which is relatively low and could signify a good buying opportunity.
A key aspect to note in the fundamentals of GE is its EPS. It had an EPS of 7.25 in the most recent financial year. The estimates for the next year are positive with an anticipated EPS of 4.01, indicating that the company is expected to continue to be profitable.
GE's Revenue Per Share TTM stands at 71.68 and they have a positive Quarterly Revenue Growth YOY of 14.3%, suggesting that GE is generating a considerable amount of revenue compared to its competitors. This makes it a potentially attractive option for investors looking for a company with strong growth prospects.
The company's Return on Equity (ROE) stands at 0.2289, suggesting it is efficient at generating profits from shareholders' equity. GE also has a profit margin of 11.31%, indicating it has been successful at converting sales into profits.
The company's dividend yield stands at a modest 0.003, suggesting it may be an attractive investment for income-focused investors, though the yield is relatively low. The forward annual dividend rate is 0.32, and the company has a consistent history of paying dividends, which could be an appealing feature for income-driven investors.
Analysts have a positive view on the company with a rating of 4.2 out of 5, and the target price set by Wall Street is $107.29, slightly above the current price, indicating a positive outlook for the stock.
Insider trading activities reveal a mixture of sell-offs from some of the company's senior executives, which is not unusual for a company of this size and could be due to personal financial planning rather than a lack of confidence in the company's future. It's also worth noting that institutional ownership in the company is high, with the likes of Capital Research Global Investors and Vanguard Group Inc. holding substantial shares. This high level of institutional ownership often indicates a strong level of confidence in the company's prospects.
Overall, General Electric seems to be a fundamentally strong company, with its robust revenue growth, efficient use of equity, and profitability. Its upward price movement, consistent dividend payout, and favorable analyst ratings further strengthen its case. However, as always, investors should conduct their own thorough research before making investment decisions.
In terms of volatility and risk management, a trailing stop loss of around 10% would have kept you in most of this trade. If it broke below that it could have been a good sign to exit and look for a new entry when the trend resumed but the stock seems to be pretty stable and we are still over a month out from the next earnings report.
As always how you interpret and decide to act on any results is up to you. This is just data not financial or trading advice and past performance is in no way any guarantee of future performance. Think of it as a way to spot stocks you might be interested in and can add to your watch list and perform further research on and or discuss with your broker.
Again. Not trading advice . Industries and companies change. Trends can end. Do your own research / discuss it with your advisor, but might be one to watch.