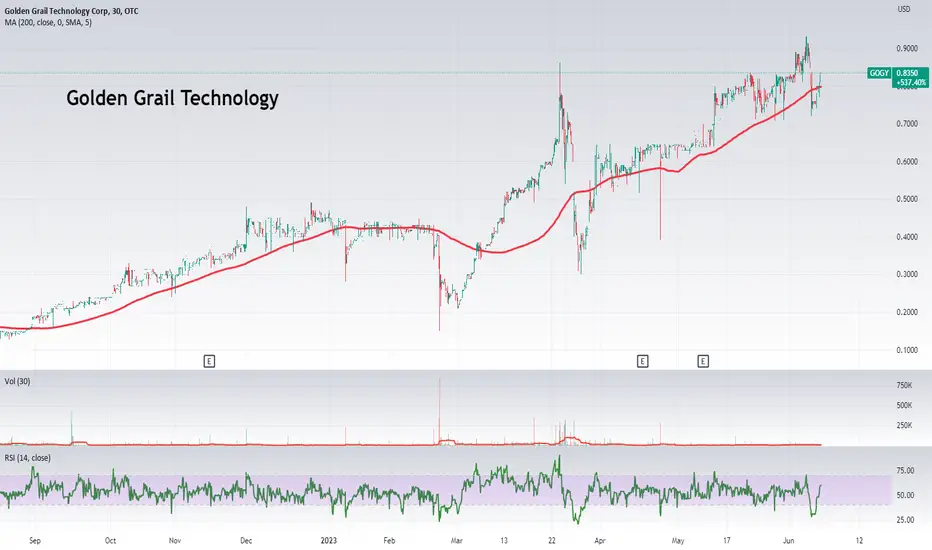
Momentum Stock: Golden Grail TechnologyGolden Grail Technology trades as Golden Grail Beverages and is self-described as an an innovative and rapidly growing company with a strong focus on acquiring and advancing brands within the emerging beverage market.
The stock is up a bit over 500% since this latest run began but you can see it is super volatile and super speculative. The drinks market is an incredibly competitive one but with this stock still below $1 there might be some interest from the penny investors.
Hard to recommend it as a trade, but thought I would point it out just so people can see what's out there.
Search in ideas for "zAngus"
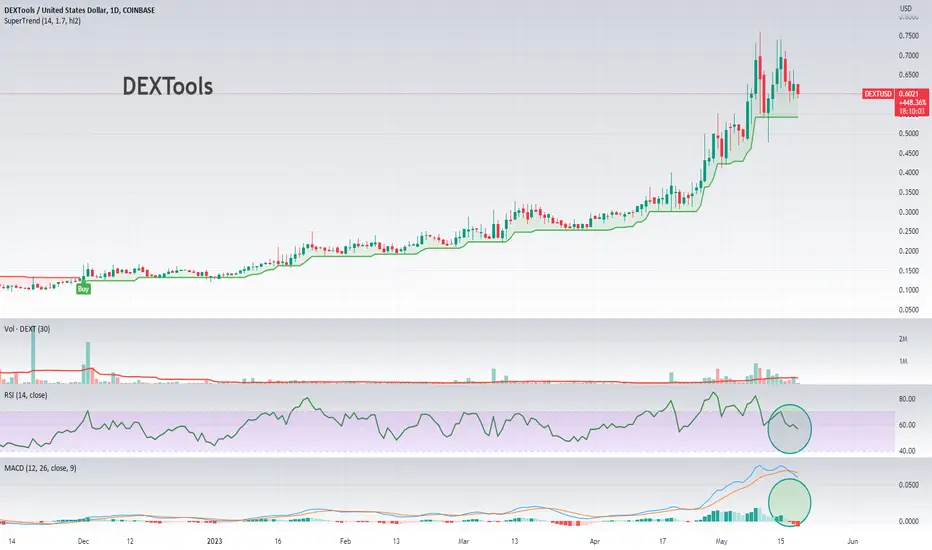
Momentum Cryptocurrency: DEXToolsDEXTUSD is a pair involving the DEXTools (DEXT) token and the US dollar (USD). DEXTools is a platform that facilitates decentralized finance (DeFi) application users, making it a tool suite for traders who want to make the most out of DeFi. It provides features like real-time data analytics, wallet info, pool explorers, pair explorers, and many more for multiple decentralized exchanges.
Potential Appeal to Investors
The recent rise of DeFi has sparked interest in DEXTUSD as an investment, considering DEXTools' pivotal role in the DeFi ecosystem. DeFi users and traders find value in the data analytics and trading tools provided by DEXTools, which has spurred demand for the DEXT token.
Price Performance
DEXTUSD has shown impressive performance over various time periods. The token has seen a substantial year-to-date change of 349.89%, suggesting high growth potential. Over the past month, it has increased by 73.06%, with a week change of 8.18%. This trend illustrates a continuous upward trajectory, which could be a positive indicator for potential investors.
The long-term trend is equally promising, with a five-year and all-time change of 215.16%. The increasing demand and usage of DEXTools in the DeFi space could be a contributing factor to this trend.
Market Capitalization and Trading Volume
With a market capitalization of around 56.842 million USD and a fully diluted market cap of approximately 119.76 million USD, DEXTUSD presents a mid-sized opportunity for cryptocurrency investors. The 24-hour trading volume of 908.018K USD also indicates a healthy trading activity.
Technical Indicators
The Relative Strength Index (RSI) stands at 56.4002, indicating that DEXTUSD is nearing overbought territory, but not there yet. The MACD Level of 0.0590 shows a bullish market sentiment, as the MACD line is above the signal line.
The moving averages also paint a favorable picture. The Exponential Moving Averages (EMA) and Simple Moving Averages (SMA) for 10, 20, 30, 50, 100, and 200 days all show that the current price is above the respective averages, which is a positive trend.
Outlook
DEXTUSD seems to present a promising opportunity for cryptocurrency investors, considering its pivotal role in the burgeoning DeFi space, strong price performance, and healthy market indicators. However, like any investment, it also carries risks, and potential investors should conduct thorough research and possibly seek advice from financial advisors.
In terms of any kind of short term entry, I would want to wait for a pullback to below an RSI of around 50 with an indication of the uptrend continuing in order to get better value. I'd also like to see the MACD lines much closer to the histograms and probably for a cross back up over the signal line. At the moment there is way too much volatility. For risk management, you would need to eyeball it and keep a manual stop loss of around 20% in mind due to the crazy long wicks. If it broke below that it could have been a good sign to exit and look for a new entry when the trend resumed.
As always how you interpret and decide to act on any results is up to you. This is just data not financial or trading advice and past performance is in no way any guarantee of future performance. Think of it as a way to spot coins you "might" be interested in and can add to your watch list and perform further research on and or discuss with your broker.
Again. Not trading advice . Crypto is a crazy pump and dump space. Trends can end. Do your own research / discuss it with your advisor, but might be one to watch.
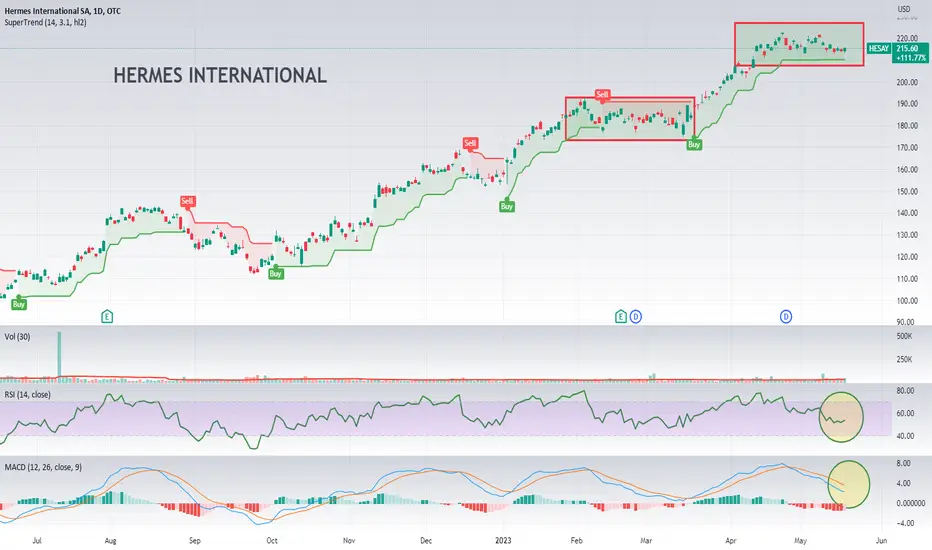
Momentum Stock: Hermes InternationalHermes International SA is a French luxury goods manufacturer that has been a distinguished name in the luxury industry since its inception in 1837. The company operates across a diverse range of high-end goods including leather accessories, ready-to-wear clothing, jewelry, silk and textile products, art of living and tableware, perfumes, and watches. It also handles the weaving, engraving, printing, dyeing, and finishing of textiles, as well as the purchasing, tanning, dyeing, and finishing of precious leathers. Its products are available through a global network of stores and also through specialized stores for watches, perfumes, and tableware. The company's rich history and global presence make it a noteworthy player in the luxury goods sector.
Hermes International's potential interest to investors could be attributed to its consistent financial performance and growth. In the past five years, it has shown a strong price performance with over 208% gain, and in the last year alone, the price of the stock has increased by more than 86%. This kind of sustained growth signifies the company's ability to adapt and prosper even in the face of market fluctuations and potential challenges.
The company's recent numbers also tell a story of healthy financials. It boasts a Market Capitalization of approximately $225.8 billion, a testament to its size and stability. It has a profit margin of 29.02%, and an operating margin of 41.54% on a trailing twelve-month basis, showing strong profitability. Additionally, the company has reported year-over-year quarterly revenue growth of 29.1% and earnings growth of 35.8%, demonstrating its ability to grow its operations and profits.
The company also has a robust dividend policy, currently offering a yield of 0.66%. Regular dividend payouts can be attractive to income-focused investors who are looking for a return on their investment beyond stock price appreciation.
In terms of valuation ratios, Hermes' Trailing Price to Earnings (PE) ratio is 61.78 and its Forward PE is 46.95, indicating expectations for future earnings growth. The Price to Sales (P/S) ratio on a trailing twelve-month basis is 16.29, signifying a premium valuation, which might be justified given the company's strong brand and steady performance.
In terms of risk, Hermes exhibits a Beta of 0.7474, which means it's less volatile than the overall market. This might appeal to conservative investors looking for less volatile investment options in a well-established, profitable company.
Despite its high valuations, the stable financials, sustained growth, and a lower risk profile make Hermes International SA a potentially attractive choice for investors looking for long-term investments in the luxury goods sector. Of course, it's always important for potential investors to conduct their own due diligence and consider their risk tolerance and investment strategy before investing.
In terms of any kind of short term entry, the stock has been consolidating for a while and you would need to keep an eye on which way it breaks especially as it has been going up for a while. I would pay particular attention to any upwards movement on both the RSI and MACD for any kind of confirmation. For downside risk management, a trailing stop loss of around 11% would have kept you in most of this trade. If it broke below that it could have been a good sign to exit and look for a new entry when the trend resumed.
As always how you interpret and decide to act on any results is up to you. This is just data not financial or trading advice and past performance is in NO WAY any guarantee of future performance. Think of it as a way to spot stocks you might be interested in and can add to your watch list and perform further research on and or discuss with your broker.
Again. Not trading advice . Industries and companies change. Trends can end. Do your own research / discuss it with your advisor, but might be one to watch.
Momentum Stock: Altisource Asset ManagementAltisource Asset Management Corporation is an alternative lending company that focuses on providing liquidity and capital to underserved markets. They also offer portfolio management and corporate governance services to institutional investors in the United States.
In terms of any kind of short term entry, the stock has had a pretty strong run and you might need to be patient and wait for a bit of a pullback closer to the SuperTrend line. It is a highly volatile stock with lots of movement so you would have needed a wide trailing stop loss of around 24% to have kept you in most of this trade.
As always how you interpret and decide to act on any results is up to you. This is just data not financial or trading advice and past performance is in no way any guarantee of future performance. Think of it as a way to spot stocks you might be interested in and can add to your watch list and perform further research on and or discuss with your broker.
Again. Not trading advice . Industries and companies change. Trends can end. Do your own research / discuss it with your advisor, but might be one to watch.

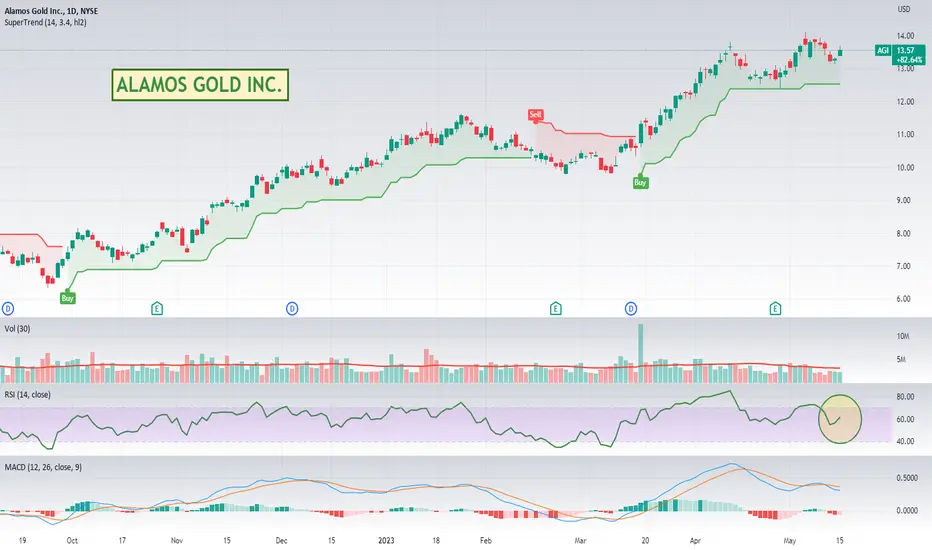
MOMENTUM STOCK: Alamos GoldAlamos Gold is a prominent Canada-based gold producer that operates multiple mines across North America. Since its establishment, the company has made significant strides in the gold mining industry and currently boasts of a diverse portfolio of operations in Canada, the United States, and Mexico. These include the Young-Davidson and Island Gold mines in northern Ontario, Canada, and the Mulatos mine in Sonora, Mexico.
The company has a reputation for efficient and sustainable mining practices, demonstrating a commitment to environmental stewardship while ensuring a steady production of gold. Alamos Gold's production portfolio presents a strong mix of high-quality, low-cost operations, and this balance has been instrumental in delivering consistent financial performance.
Additionally, Alamos Gold has a pipeline of development and exploration projects that could further boost its growth. It has continually invested in exploration and development, seeking to expand its gold reserves and increase its production capacity. These projects, if successful, could significantly enhance the company's future profitability and shareholder returns.
For stock investors, Alamos Gold presents several compelling reasons for consideration. The first is the company's solid operational track record and its consistent gold production. In an industry where operational efficiency and resource management are key, Alamos Gold stands out.
Furthermore, the company's commitment to sustainable practices may appeal to investors who prioritize environmental, social, and governance (ESG) factors in their investment decisions. Alamos Gold's focus on responsible mining underscores its awareness of the broader impacts of its operations and its commitment to mitigating potential adverse effects.
Finally, the potential for future growth through the company's exploration and development pipeline could be attractive to investors looking for long-term capital appreciation. The gold mining industry can be cyclical, and companies that can cost-effectively increase their reserves and production may be better positioned to weather industry downturns and benefit from periods of higher gold prices.
In summary, Alamos Gold's consistent performance, commitment to sustainable mining, and growth prospects make it an intriguing proposition for potential investors.
From a technical analysis perspective it might be a little expensive at the current price but the RSI and the MACD both look like some upward momentum might be returning to the stock.
I do like that it is still below $20, so might be considered psychologically cheap, but gold stocks are always super speculative, so as with all investments, it's important to thoroughly research and understand the company, the industry, and the associated risks before making an investment decision.
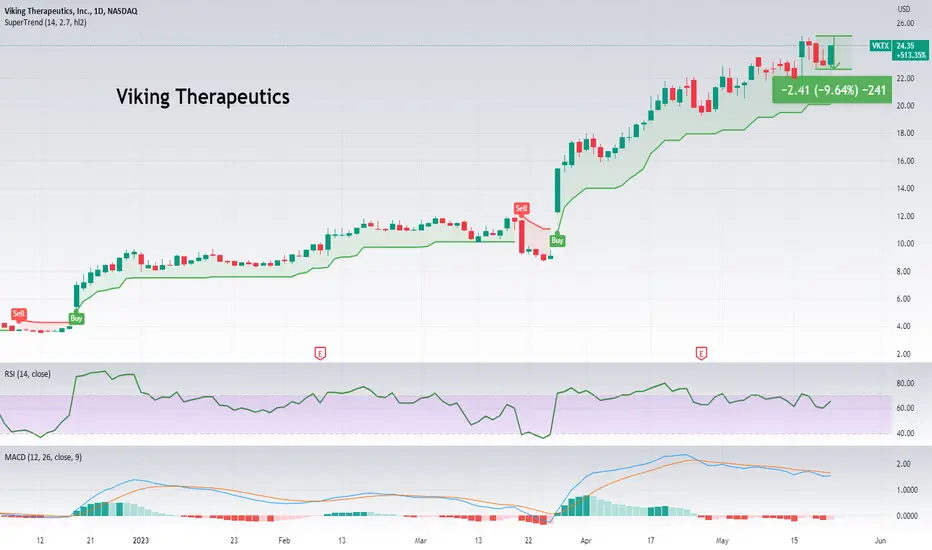
Momentum Stock: Viking TherapeuticsViking Therapeutics Inc is a clinical-stage biopharmaceutical company and is focused on the development of therapies designed to treat metabolic and endocrine disorders. This includes conditions like fatty liver disease and type 2 diabetes, which have been on the rise globally.
The stock's price performance has been quite remarkable in recent periods. The share price has shown a steady increase over different timescales, with particularly impressive growth over the past six months and one year, seeing a 499.75% and 945.06% surge respectively. The year to date growth is at 164.96%, showcasing a persistent bullish trend for Viking Therapeutics.
The Relative Strength Index (RSI) of 65 indicates that the stock is currently close to the overbought territory, suggesting a strong momentum in the stock's price. It also hints at potential future price corrections, which is common after periods of rapid growth.
However, investors may want to approach this stock with caution despite its impressive performance. Biotech stocks like VKTX can be quite volatile due to the binary nature of clinical trials results. Positive outcomes can result in significant stock price appreciations, as we might be seeing here. On the other hand, a failed clinical trial can drastically affect the stock price in the opposite direction.
Moreover, Viking Therapeutics, as a clinical-stage company, likely doesn't have a product on the market yet, meaning it probably doesn't have revenue or profit to fall back on. This can be a point of concern as it makes the stock's performance heavily reliant on the successful development and subsequent approval of its therapies.
Stocks like this are HIGHLY speculative and trying to time any kind of an entry can be difficult. It has just had a 10% pull back and regained most of it quite quickly. It could continue to run, who knows. If you decide to trade it, keep a close eye on it. A trailing stop loss of around 15% would have kept you in most of this trade. If it broke below that it could have been a good sign to exit and look for a new entry when the trend resumed.
As always how you interpret and decide to act on any results is up to you. This is just data not financial or trading advice and past performance is in no way any guarantee of future performance. Think of it as a way to spot stocks you might be interested in and can add to your watch list and perform further research on and or discuss with your broker.
Again. Not trading advice . Industries and companies change. Trends can end. Do your own research / discuss it with your advisor, but might be one to watch.
Momentum Stock: Flutter EntertainmentFlutter Entertainment is a leading global sports betting, gaming and entertainment provider. The company's portfolio includes a variety of well-known brands such as Paddy Power, Betfair, FanDuel, and PokerStars. Flutter Entertainment operates in a multitude of markets worldwide, offering a diverse range of entertainment services, from sportsbooks and exchanges to poker, casinos, and other games.
Potential investors might find Flutter Entertainment appealing due to its significant and sustained growth in the stock market. Over the past year, its stock price has increased by 86.44%, indicating a robust performance. The company's stock has also shown positive momentum in the shorter term, rising by 53.32% over the past six months and 8.30% in the past month. Even the week's performance shows a slight increase of 1.74%. The only minor dip is a 0.59% decrease today, which could be seen as a natural market fluctuation or a momentary pause in an otherwise upward trend.
The performance of Flutter Entertainment's stock suggests that the company has been successfully navigating the challenges and opportunities of the sports betting and online gaming industries. These sectors have seen substantial growth recently due to a shift in consumer behavior towards online platforms, a trend that has been accelerated by pandemic-led restrictions. As a key player in this rapidly expanding industry, Flutter Entertainment is well-positioned to continue benefiting from these trends.
The impressive price performance and the company's position within the growing online gaming industry may attract both growth-oriented investors and those who follow momentum investing strategies. However, as always, potential investors should conduct thorough due diligence before making any investment decisions, as stock performance is influenced by a wide array of factors, from the company's own financial health to broader market and industry trends.
In terms of any kind of short term entry, I would want to wait for a pullback to below an RSI of around 55 with an indication of the uptrend continuing in order to get better value. For risk management, a trailing stop loss of around 12% would have kept you in most of this trade. If it broke below that it could have been a good sign to exit and look for a new entry when the trend resumed.
Not trading advice. Trends can end. Do your own research / discuss it with your advisor, but might be one to watch.

Momentum Cryptocurrency: Injective ProtocolINJUSD represents the cryptocurrency pair of the Injective Protocol token (INJ) and the US Dollar (USD). Injective Protocol is a decentralized exchange (DEX) that runs on the Ethereum network. It has been designed to facilitate peer-to-peer (P2P) trading using a high-speed, low-cost infrastructure. The platform is fully decentralized, meaning it allows traders to operate in a permissionless and censorship-resistant manner, a key advantage over traditional, centralized exchanges.
Potential Appeal to Investors
Investors may find INJUSD appealing due to the unique characteristics of the Injective Protocol. With its focus on decentralization, speed, and low costs, Injective Protocol is uniquely positioned in the growing field of DeFi. By leveraging the advantages of blockchain technology, Injective Protocol offers a level of accessibility and transparency that is typically lacking in traditional financial systems.
Price Performance
The INJUSD pair has seen substantial growth in recent times. Its 6-month growth rate is a staggering 289.96%, with an even more impressive year-to-date change of 423.74%. The 1-year stands at 325.71% illustrating a strong long-term growth trend. Despite the past month's decrease of -22.98%, the overall bullish trend could potentially signify a promising investment.
It has had a pull back to below a previous support area and if it breaks back up above this it could be a positive sign.
Market Capitalization and Trading Volume
Injective Protocol (INJ) has a notable market capitalization of 531.317 million USD, with a fully diluted market cap of 664.1 million USD. The substantial trading volume over the past 24 hours, around 58.016 million USD, suggests robust market activity and liquidity for the INJUSD pair.
Technical Indicators
The Relative Strength Index (RSI) at 47.815 suggests the asset is currently neither overbought nor oversold. Meanwhile, the MACD Level of -0.218 signals that bearish sentiment may currently dominate.
However, the overall picture from the moving averages is more positive. The Exponential Moving Averages (EMA) and Simple Moving Averages (SMA) for 10, 20, 30, 50, 100, and 200 days all show that the current price is above these averages. This is typically seen as a bullish sign.
Outlook
In conclusion, INJUSD presents an interesting opportunity for investors due to the unique aspects of Injective Protocol. Its strong performance over time and healthy market indicators make it a potentially promising investment. However, as with all investments, potential investors should consider their risk tolerance and investment objectives before making a decision and consider seeking advice from financial professionals.
In terms of any kind of short term entry it has had quite a large pullback into a reasonably good value area. I would want to wait for the MACD to cross back up above its signal line for confirmation. For risk management, again being crypto it's something your really need to eyeball. A stop loss of around 20% would have kept you in most of this trade. If it broke below that it could have been a good sign to exit and look for a new entry when the trend resumed.
As always how you interpret and decide to act on any results is up to you. This is just data not financial or trading advice and past performance is in no way any guarantee of future performance. Think of it as a way to spot coins you might be interested in and can add to your watch list and perform further research on and or discuss with your broker.
Again. Not trading advice . Cryptocurrencies can pump and dump. Trends can end. Do your own research / discuss it with your advisor, but might be one to watch.

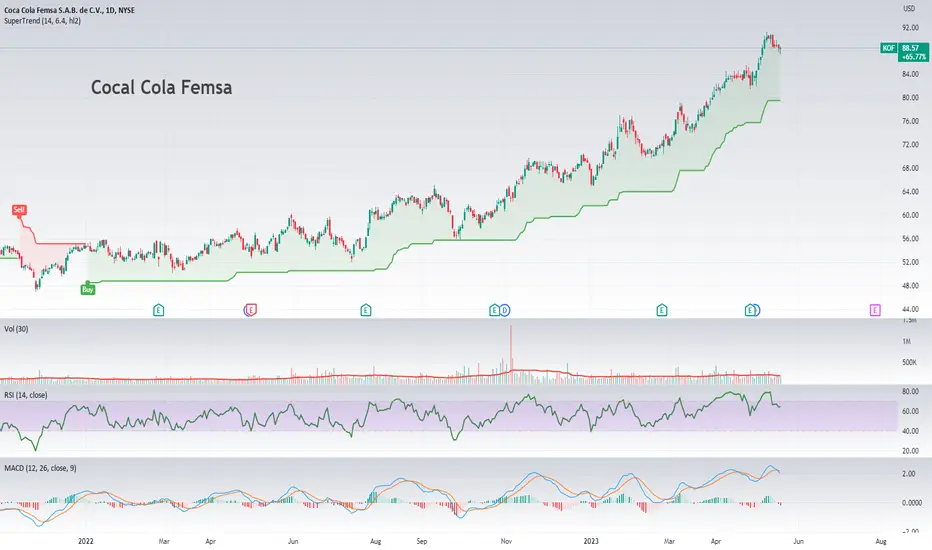
Momentum Stock: Coca Cola FemsaCoca-Cola FEMSA SAB de CV , listed on the New York Stock Exchange as KOF, is the largest franchise bottler of Coca-Cola products in the world. The company produces and distributes Coca-Cola, Fanta, Sprite, Del Valle, and other trademark beverages of The Coca-Cola Company across a broad geographical region, which includes countries in Latin America and the Philippines. Its operations encompass procurement and manufacturing processes, commercialization and distribution of beverages.
Pricing Analysis
KOF's current price stands at $88.57, showcasing a commendable performance over different time horizons. Over the past year, the stock has delivered a substantial return of about 57.79%. Even more impressively, it has surged by approximately 1080.95% since its inception. Given the stock's Relative Strength Index (RSI) of 64.23, it may be slightly overbought in the short term, but this is not necessarily a cause for concern.
Financial Highlights
The company has a sizable market capitalization of roughly $18.79 billion, with an EBITDA of about $39.35 billion. Currently, KOF has a high P/E ratio of 95.1, suggesting that investors are willing to pay a high price for its earnings, potentially due to optimistic future growth expectations. Its PEG ratio also stands high at 20.28, indicating the stock might be overvalued when factoring in the company's growth rate. It is important to consider these ratios in the context of the industry averages and the company's growth prospects.
KOF's dividend per share is $58, yielding a dividend yield of 0.0368, which may be attractive to income-focused investors. The company's profitability margins are also healthy, with a profit margin of 8.61% and an operating margin TTM of 12.79%.
Valuation Metrics
KOF's trailing P/E is high at 95.1, but the forward P/E is significantly lower at 14.64, indicating that analysts expect strong earnings growth moving forward. The Price/Sales ratio TTM is 0.0633, suggesting the stock could be undervalued given the company's sales. The company's Enterprise Value stands at approximately $15.72 billion, a number below its market cap due to its negative net debt.
Share Statistics
KOF has approximately 210 million shares outstanding with a float of 52.52 million shares. Nearly 4.78% of the shares are held by insiders, and institutions hold about 58.88% of the shares, indicating a high level of institutional confidence in the company.
Technical Analysis
The company has a relatively low beta of 0.79, indicating that the stock is less volatile than the market. KOF's 52-week high is $91.23, while its 52-week low stands at $49.86, suggesting the stock has been on a strong upward trajectory over the past year.
Dividends and Splits
KOF offers a forward annual dividend rate of $3.25 with a yield of 3.68%, and the payout ratio is 60.91%, indicating the company is returning a significant portion of its earnings to shareholders. The company's track record of dividends shows regular payouts, indicating consistency and potentially making it an attractive option for income investors.
Analysts Ratings
Among the analysts covering KOF, four have given it a "strong buy" rating, two have recommended a "buy," while six analysts suggest holding the stock. None of the analysts have recommended selling the stock, indicating a generally positive sentiment towards the company. However, the average target price of $83.8 is below the current stock price , suggesting that analysts, on average, believe the stock may be slightly overpriced at the moment.
Institutional and Fund Holders
Significant institutional stakeholders in KOF include the Gates Bill & Melinda Foundation, Tweedy Browne Co LLC, and Renaissance Technologies Corp, which hold 2.96%, 0.92%, and 0.52% of total shares, respectively. On the other hand, leading fund holders like Tweedy Browne International Value Fund, Seafarer Overseas Gr and Income Instl, and Robeco QI Emerging Cnsrv Eqs I €, hold 0.65%, 0.29%, and 0.23% of total shares, respectively. These holdings, especially from prestigious institutions and funds, can be seen as a vote of confidence in the company's prospects.
Outlook
In summary, KOF appears to be a strong company with solid financials and a consistent track record of dividend payouts. The positive analyst sentiment, robust growth over the years, and substantial institutional ownership further bolster the stock's appeal. However, investors should be mindful of the relatively high P/E ratio and the possibility of the stock being overpriced. Additionally, the company's stock performance should be viewed in the context of its peers and the broader market conditions. As always, potential investors should conduct thorough research and possibly seek advice from financial advisors before making an investment decision.
In terms of any kind of short term entry, I would want to wait for a pullback to below an RSI of below 45 or so as it does pull back a long way with an indication of the uptrend continuing in order to get better value. For risk management, a trailing stop loss of around 15% would have kept you in most of this trade. If it broke below that it could have been a good sign to exit and look for a new entry when the trend resumed.
As always how you interpret and decide to act on any results is up to you. This is just data not financial or trading advice and past performance is in no way any guarantee of future performance. Think of it as a way to spot stocks you might be interested in and can add to your watch list and perform further research on and or discuss with your broker.
Again. Not trading advice . Industries and companies change. Trends can end. Do your own research / discuss it with your advisor, but might be one to watch.
Momentum Stock: Arch Capital GroupArch Capital Group Ltd is involved in insurance, reinsurance, and mortgage insurance products globally. It offers a wide range of coverage options, including casualty, property, marine, aviation, and travel insurance, among others operating primarily through brokers, selling both insurance and reinsurance products.
Financial Performance and Market Position
Arch Capital Group has demonstrated impressive financial performance over the past few years. The company has experienced steady growth, with its share price appreciating by 177.26% over the past five years, and 57.92% over the past year. The company's robust performance has resulted in an impressive all-time price performance of 3106.67%.
Currently, Arch Capital Group Ltd. has a market capitalization of approximately $27.868 billion and generated over $10.84 billion in revenue in the trailing twelve months (TTM). The company's EBITDA stands at $2.2 billion, signifying solid operational efficiency.
Valuation
The company's PE ratio of 14.44, which is lower than the average for the S&P 500, suggests that the stock could be undervalued compared to its earnings. This notion is further supported by the forward PE of 11.34, implying that earnings are expected to grow. However, the PEG ratio is 2.24, suggesting that the company may be overvalued when considering its growth rate.
Ownership Structure
The institutional ownership for Arch Capital Group Ltd is 91.16%, indicating that the stock is popular among sophisticated investors. The company's major shareholders include Vanguard Group Inc., BlackRock Inc., and State Street Corporation, which are known for their strategic and long-term investments. The considerable holding by these established institutions reflects their confidence in the company's financial health and future prospects.
Analyst Ratings
According to the given data, the stock is favorably rated by analysts, with a rating of 4.18 out of 5. Analysts have set a target price of $82.95, suggesting that they expect the stock price to appreciate from its current level of $73.04. With four strong buy ratings, five buy ratings, and two hold ratings, the consensus among analysts appears to be quite bullish.
Recent Insider Activity
Insider activity can offer some insight into the company's outlook. Recently, several executives have been selling their shares, including Louis T Petrillo, Maamoun Rajeh, Francois Morin, and Nicolas Papadopoulo. Although this selling activity could be a red flag, it's important to remember that insiders may sell their shares for many reasons that are not necessarily related to their outlook on the company.
Outlook
Arch Capital Group Ltd. appears to be a potentially promising investment. The company has a strong market presence, robust financial performance, and solid growth. Its favorable valuation metrics, particularly the PE ratio, suggest that the stock may be undervalued. The company's stock also enjoys strong institutional backing and has received positive ratings from analysts. While the recent insider selling warrants monitoring, it does not automatically indicate a negative outlook. As always, prospective investors should conduct their own due diligence and consider their risk tolerance before investing.
In terms of any kind of short term entry, the stock has had a pretty strong pullback and you would need to wait to see if it turns around. I would pay particular attention to any upwards movement on both the RSI and MACD for any kind of confirmation. For downside risk management, a trailing stop loss of around 10% would have kept you in most of this trade. If it broke below that it could have been a good sign to exit and look for a new entry when the trend resumed.
As always how you interpret and decide to act on any results is up to you. This is just data not financial or trading advice and past performance is in no way any guarantee of future performance. Think of it as a way to spot stocks you might be interested in and can add to your watch list and perform further research on and or discuss with your broker.
One to watch.

Momentum Stock: Perion Network Ltd.Perion Network Ltd. is an international technology company that specializes in developing innovative digital advertising solutions for brands and publishers. Its primary focus is to provide data-driven execution strategies across a multitude of channels, including search, social, and display, which enables advertisers to connect and engage with their target audiences more effectively.
The company operates through three main divisions. Its 'Search Advertising' division offers sophisticated technology that empowers brands to maximize their online search traffic and revenue, while the 'Display and Social Advertising' division utilizes advanced AI-based solutions to create personalized, cross-channel advertising campaigns. Finally, the 'Content Monetization' division provides unique content and ad experiences that drive user engagement and revenue for publishers.
Investors might be attracted to Perion Network for several reasons. Firstly, it operates in the growing digital advertising industry, which continues to expand with the rise of internet usage worldwide. Its innovative technology solutions, coupled with the company's data-driven approach, position it well to capitalize on this trend.
Secondly, Perion's diversified revenue streams - from search to display and social advertising - provide a certain level of financial stability. This diversification reduces the company's reliance on a single market segment, thereby potentially mitigating risks associated with fluctuations in individual market sectors.
Thirdly, Perion has a track record of strategic acquisitions, which have helped expand its product portfolio, increase its global reach, and drive its growth. This proactive growth strategy may appeal to investors looking for companies with aggressive expansion plans.
Lastly, the company's ongoing investment in AI and machine learning technologies demonstrates its commitment to staying at the forefront of industry innovation. As these technologies continue to shape the future of digital advertising, Perion's early and continued investment in this area could potentially provide a competitive advantage.
From a technical perspective , I like that it has had quite a deep 25% pullback after its last earnings and its MACD is looking like momentum might start to shift back to the upside. Need to wait for confirmation, but one to watch perhaps.
As always, potential investors should conduct thorough research and consider all financial aspects before making an investment decision.

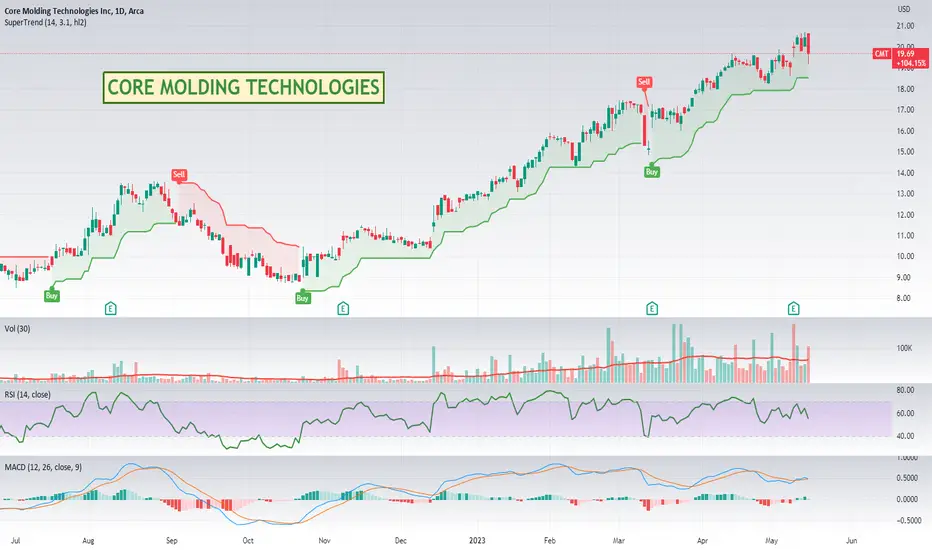
Momentum Stock: Core Molding TechnologiesCore Molding Technologies is a manufacturer of sheet molding compound (SMC) and molder of fiberglass reinforced plastics. The company's specialty lies in large-format moldings and offers a wide variety of fiberglass processes, including compression molding of SMC, glass mat thermoplastics (GMT), and bulk molding compounds (BMC); spray-up, hand-lay-up, and resin transfer molding (RTM). Additionally, the company offers liquid molding of dicyclopentadiene (DCPD). Core Molding Technologies serves a diverse range of markets, including medium and heavy-duty truck, marine, automotive, agriculture, construction, and other commercial products.
What makes Core Molding Technologies potentially interesting to stock investors is its niche role in the materials industry and its diverse client base. The company's focus on large-format moldings and various fiberglass processes allows it to cater to a wide variety of industries, which can provide a level of resilience against market downturns in any one industry. Additionally, its expertise in a broad range of molding and manufacturing techniques suggests a high degree of adaptability and potential for growth.
Furthermore, as many industries are increasingly looking for lightweight, durable materials to improve energy efficiency and performance, Core Molding Technologies is well-positioned to benefit from these trends. Its products are often used in sectors such as automotive and construction, where the push for more sustainable and efficient materials is strong. This offers potential growth opportunities for the company and, by extension, its shareholders.
As with any investment, potential investors should carefully research and consider their own risk tolerance, investment objectives, and the company's financial performance, management, competitive positioning, and future prospects before investing in Core Molding Technologies.
Might be worth further research.
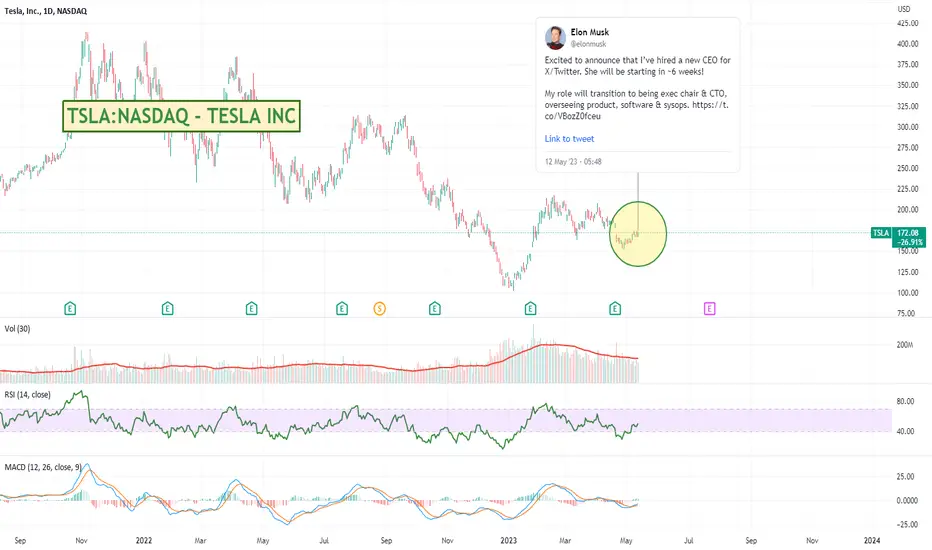
"Excited to announce that I’ve hired a new CEO for X/Twitter"Elon just announced he has found a new CEO for Twitter.
5:48 AM · May 12, 2023 - Elon Musk @elonmusk
"Excited to announce that I’ve hired a new CEO for X/Twitter. She will be starting in ~6 weeks!
My role will transition to being exec chair & CTO, overseeing product, software & sysops."
Keep an eye on the share price.
Watching for a potential bounce on ANKRJust thought this was a potentially interesting area to keep an eye on for this coin.
RSI and MACD showing signs of oversold / better value. Be interesting to see what it does from here.

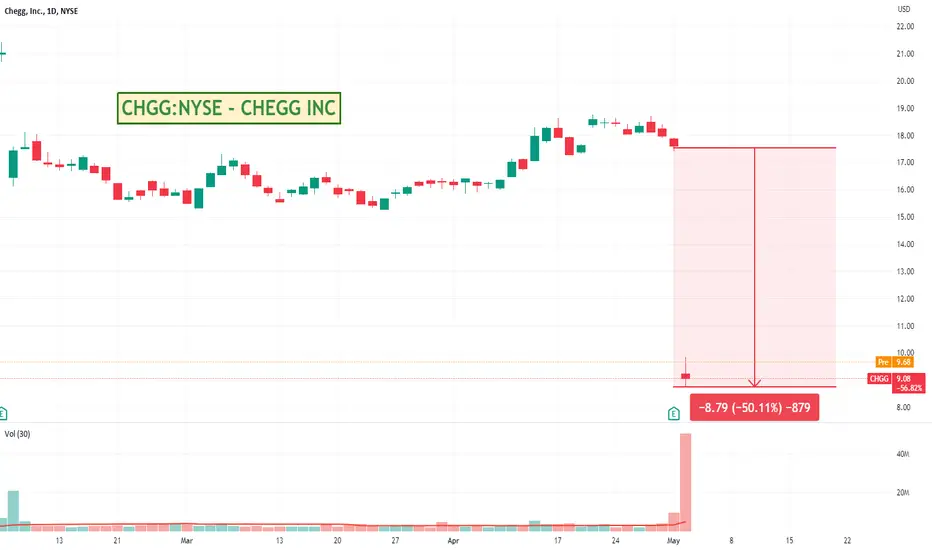
Chegg Plunges After Company Warns ChatGPT Is Impacting GrowthWonder if this is the first of many.
I wouldn't like to be any online training / support desk type business with the rapid adoption of ChatGPT.
Could be a good opportunity for the shorters out there to look around for similar businesses that might feel the impact.
In Cheggs case I wonder if this drop will snowball, or be considered an over reaction by the market and some upside might be found.
Wonder if they will be able to reinvent themselves somehow and how quickly.
Interesting ...
Coinbase Earnings due. Will it gain or lose 40%?Tricky position. Lot of FUD circling Coinbase with increasing Government regulatory attention. With earnings due in a couple of days it will be interesting to see if it rallies 40% + back up to its previous resistance area or perhaps just as likely, drop another 40% back to its recent low.
One to watch either way. Best to wait for confirmation.

Hermes International running well.Hermes is a French fashion house offering a wide range of goods.
They have had a great run over the last 12 months or so in a softer economy so could be interesting to keep an eye on. Up 100% over the year, but the RSI and MACD indicate better value might be ahead if looking for an entry.
One to watch.

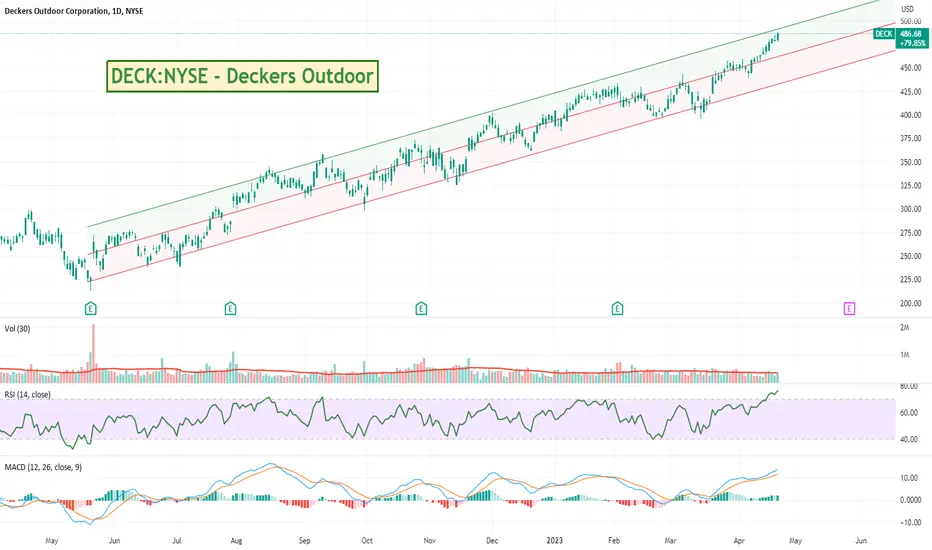
Momentum Stock: Deckers OutdoorsDeckers has had a nice steady run over the last 12 months climbing around 65% over the last 12 months, and more before that.
Probably too expensive at this stage and I'd be waiting for a pullback into the lower end of its range with sign of a recovery.
One for the watchlist.
e.l.f. Beauty - Nice steady runnere.l.f. Beauty, also known as e.l.f. Cosmetics, is a cosmetics company that offers a wide range of affordable and high-quality beauty products. The company's name stands for "eyes, lips, face," which reflects its focus on makeup products designed for these facial features. e.l.f. Beauty's product lineup includes cosmetics, skincare items, makeup brushes, and various beauty tools.
The brand is known for its cruelty-free products, meaning they do not test on animals or use animal-derived ingredients. e.l.f. Beauty's mission is to provide accessible and affordable beauty products that allow everyone to enhance their natural beauty without breaking the bank. The company has gained popularity for offering quality products at lower price points compared to other cosmetic brands in the market.
From a technical point of view, an entry might be expensive at this stage. I'd wait for an RSI pull back to the mid 50's and wait for it to head back up again - or get much closer to its 50 day MA or the SuperTrend line and head back up.
Might be worth a watch.

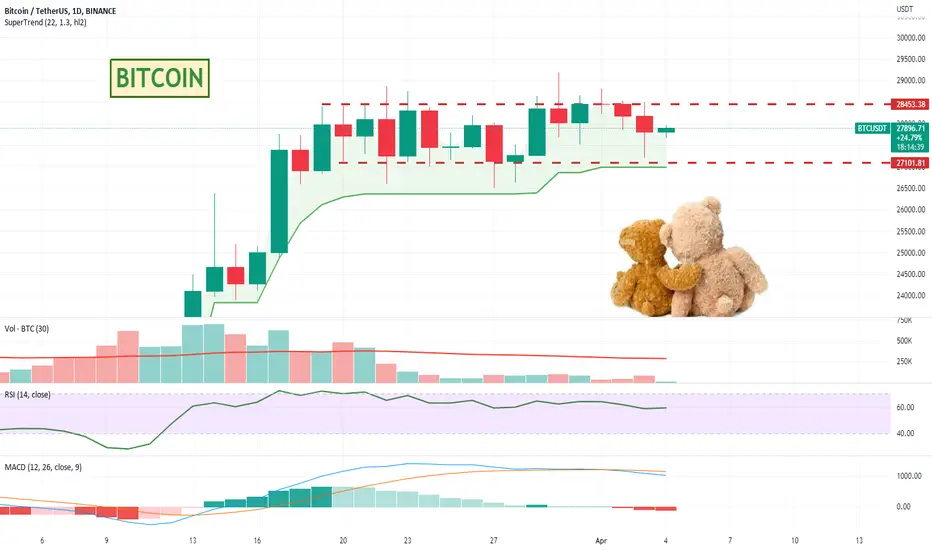
Bitcoin Still Trending Sideways.The Bitcoin market has exhibited an oscillatory consolidation phase within a well-defined horizontal channel, oscillating between the $27,100 and $28,500 price thresholds over the last 18 days. The Relative Strength Index (RSI) has maintained a moderately bullish equilibrium at a constant level of 60, reflecting a tentative market sentiment with investors remaining cautious.
The Moving Average Convergence Divergence (MACD) indicator and its corresponding signal line have been oscillating in close proximity to one another, showcasing a subdued trend momentum. However, their pronounced deviation from the baseline indicates a latent undercurrent of bullish pressure that could potentially catalyze a decisive breakout in the near future.
The anemic trading volume observed during this period further underscores the market's ambivalence, as market participants adopt a wait-and-see approach, refraining from committing to sizable positions. This attenuation of liquidity can also contribute to heightened susceptibility to erratic price fluctuations and temporary bouts of volatility.
In summary, the Bitcoin market is currently exhibiting a phase of indecision as it traverses a lateral trading range, with key technical indicators such as the RSI and MACD displaying an intricate interplay of bullish and bearish forces. Market participants should remain vigilant for potential catalysts that may tip the balance in favor of a decisive price movement, as the diminishing trading volume may exacerbate the impact of any exogenous shocks to the market.
Short version. Bears are chillin. Price action is good for the gridbots, but not much else at the moment.
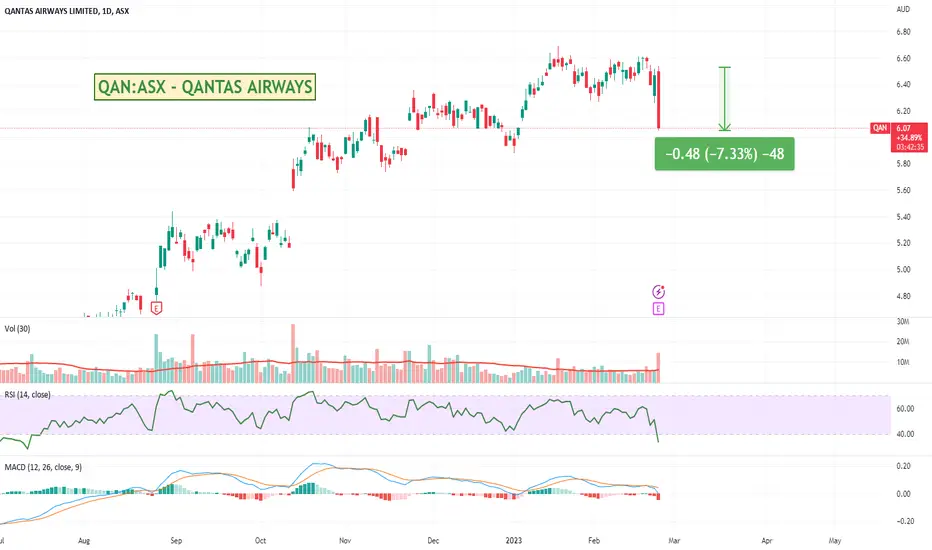
Australia Qantas Announces Great Results. Price drops 7%.Qantas has announced an interim underlying pre-tax profit of $1.43 billion in its first return to profitability since the coronavirus pandemic started. The airline's record first-half result was at the top end of its forecast , with revenue of $9.9 billion. All segments of its business turned profitable during the half year, led by Qantas Domestic, which recorded $785 million in earnings before interest and tax. Qantas expects travel demand to continue driving the recovery in 2023 and 2024, with domestic capacity set to exceed pre-Covid levels in the second half of 2023.
Good news is bad news again. Seems like an over reaction. Might be worth keeping an eye on.
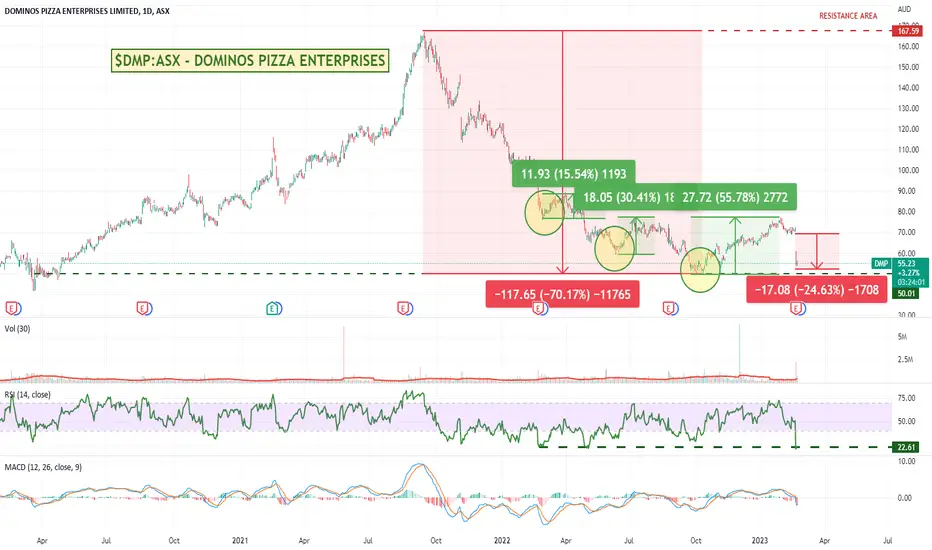
Australia's Dominos Blasted -24% On Earnings. Overreaction?Domino's Pizza Enterprises Ltd.'s stock in Sydney dropped 24%, its biggest decline ever, after reporting a 21% drop in first-half earnings as customers resisted price hikes implemented to offset inflationary pressures. The company stated that the increase in prices hurt customer counts, especially in Europe and Asia.
From personal experience I can confirm. I'd order Dominos weekly because they were about half the price of my local Pizza guy. After the price changes there isn't much difference, so my local dude is getting a lot more of my orders each week.
Still, seems like a big over reaction and the last few times the RSI is this low there has been between a 15% to 30% recovery. The big gap down will also draw some attention and look to get filled.
Might be some coin in a short term trade at least for anyone interested.
Worth a look.
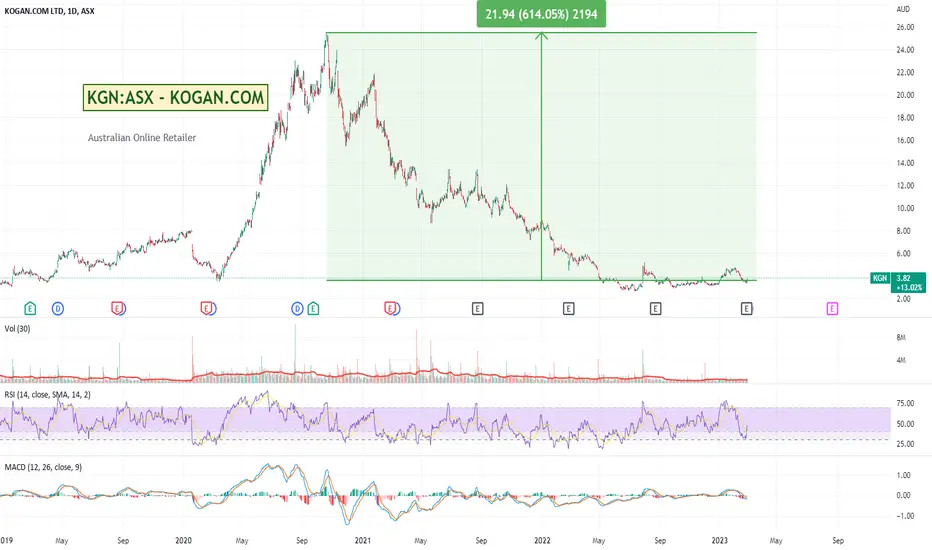
Australias Kogan Posted Its First Profit In Ages. Stock Up 9%.Kogan.com has reported a "return to profitability" happened in January, when it recorded its first positive underlying earnings since July 2022, totalling $1.5m.
It is down a LONG way from its old highs. Will be interesting to see if this is the start of any kind of price recovery.
Might be a bit too soon, but one to watch.