SUI Wave (4) Still Underway?Its unclear weather CRYPTOCAP:SUI wave 4 is complete or still underway as a larger triangle of flat correction, in a ending diagonal wave 4 (defined by wave 4 falling to wave 1 at the 0.5 Fib).
Price terminated 3 waves up at the High Volume Node resistance and is now finding support at the weekly pivot, 0.236 Fibonacci retracement. Further decline brings up the the 0.382 High Volume Node support.
Weekly RSI is at the EQ.
Safe trading
Season

$ETH Did The Poke Above All Time High!As I said in my last update it would be unusual to complete the Elliot wave motif wave without a poke above all time high first and we got that this week adding confluence to an expected retracement ahead in wave 2. Poke above all time high shows long term strength.
Weekly RSI has bearish divergence from the wave 3 top in overbought territory.
Initial target is the (4) bottom and weekly pivot point at $3200 followed by $2800 High Volume Node and then the weekly 200EMA, S1 pivot and High Volume Node support at $2250. I will look out for longs in these areas.
Analysis is invalidated if proceed into price discovery.
Safe trading

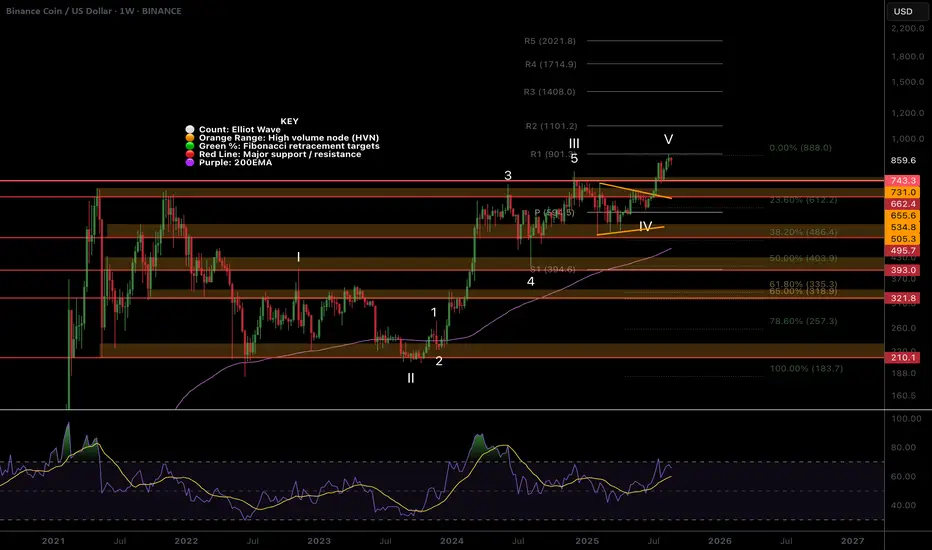
BNB Retracement Ahead?CRYPTOCAP:BNB wave 5 looks complete at the weekly R1 pivot. RSI continues to print weekly bearish divergence from the wave 3 high.
Wave IV was a difficult count but appears to be a triangle which is a final pattern before the terminal move. Wave 2 retracement target usually ends at the bottom of wave 4 so $90 in this case which also finds confluence with 0.382 Fibonacci retracement and a swing below the weekly pivot, a good long signal.
Analysis is invalidated if we continue into price discovery.
Safe trading
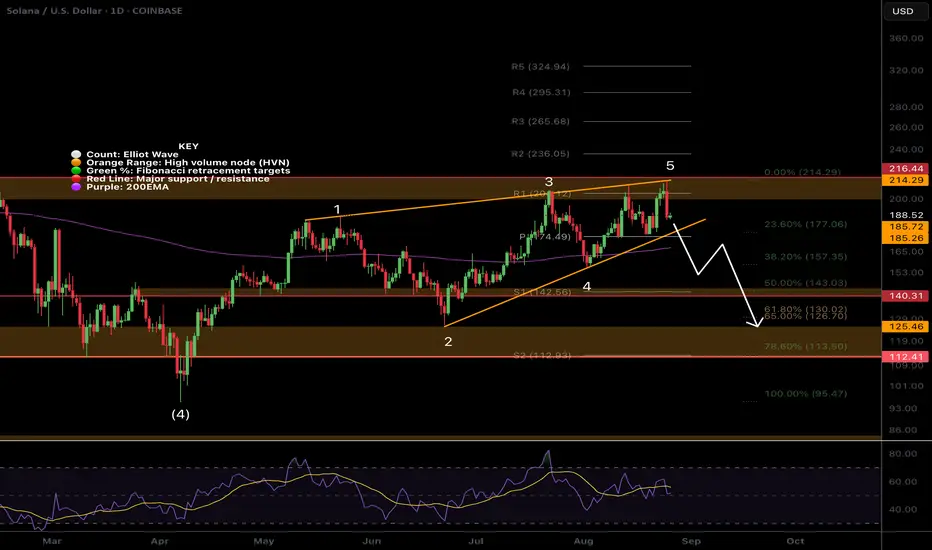
SOL Elliot Wave Count ChangedCRYPTOCAP:SOL Solana appears to have completed an Elliot wave diagonal pattern with a series of ABCs.
Falling below the trend line and 200EMA would confirm this and bring up a first target of $140 at the High Volume Node and 0.5 Fibonacci retracement.
Daily RSI has had bearish divergence for a while. The 'alt-coin golden pocket' 0.786 sits at the wave 2 bottom around $119 which would be a buy for me if price gets down that far.
Safe trading.
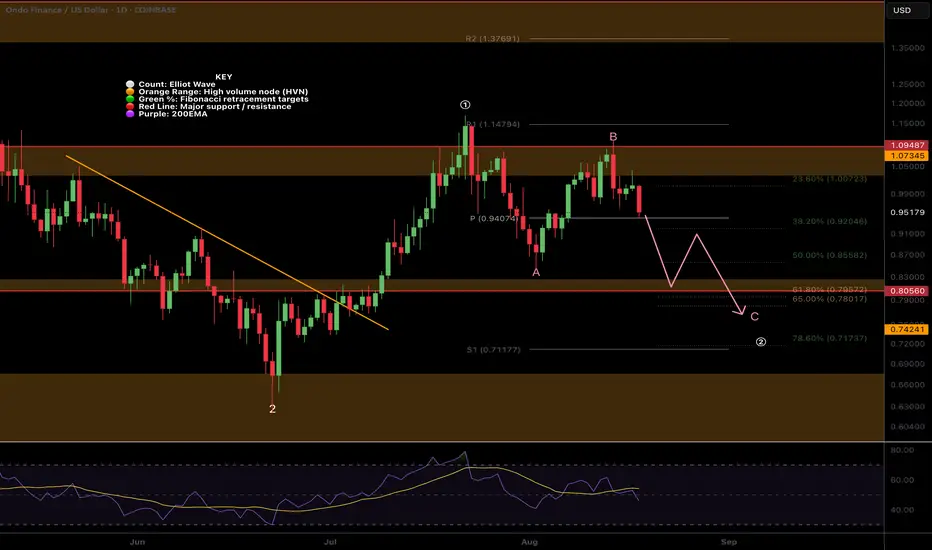
ONDO Wave C of 2 underway?LSE:ONDO appears to be printing wave C of 2 with a target of the High Volume Node and Fibonacci retracement golden pocket.
RSI has room to fall into oversold, price has lost the daily pivot and 200EMA.
Wave (3) has an initial target of $1.48
Safe trading

FET Wave 2 Underway, Triangle InvalidatedWave C of 2 appears to be underway for $FET. With the 1:1 extension target from wave A lines up with the golden pocket retracement and S2 daily pivot so is definitely an area to watch.
RSI has room to fall into oversold.
Price failed 2 tests of the descending daily 200EMA, we expect price to break through on the 4th.
Safe trading

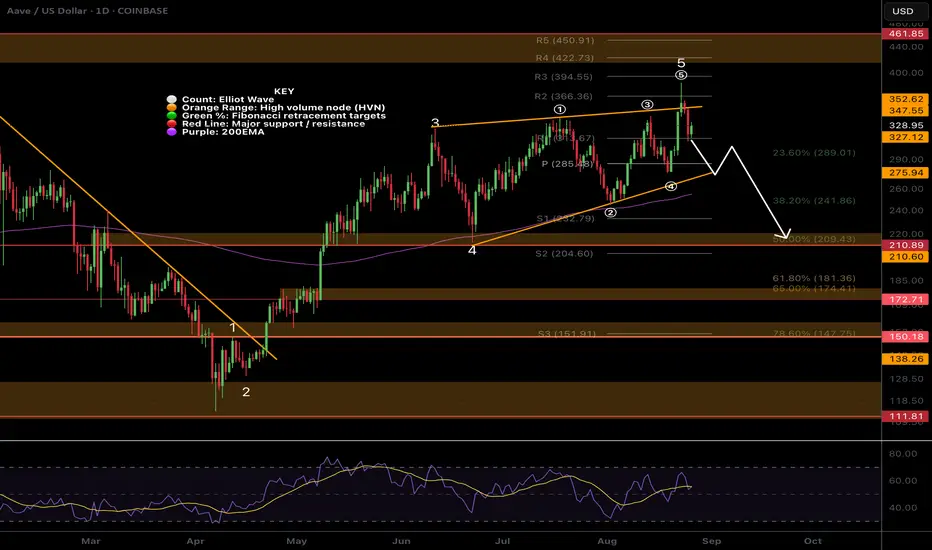
AAVE Ending Diagonal?We have some more clarity with the local AAVE pattern and it does appear to be an Elliot wave ending diagonal. After a strong wave 3 ending diagonals form as a terminal pattern with a thrust above the trend line threshold and drop back down to complete a higher degree motif wave 1.
The following retracement has a high probability of terminating at the wave 4 bottom which in this case is at the High Volume Node support and 0.5 Fibonacci retracement at $210.
RSI has printed a series of bearish divergence from overbought but this took a long time to play out!
Analysis is invalidated if price breaks above $400.
Safe trading
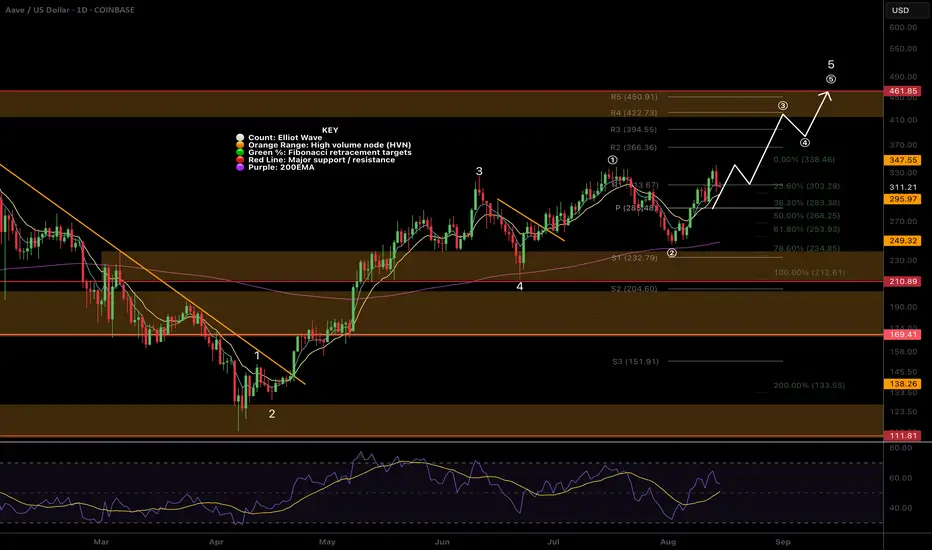
$SOL Ready for Price Discovery?CRYPTOCAP:SOL wave 3 of (5) appears to be underway but has to get through the major resistance High Volume Node at $216 and previous high first for an impulsive move.
Weekly pivot point was tested successfully as support and RSI has plenty of room to continue upwards.
Analysis is invalidated below $130.
Safe trading

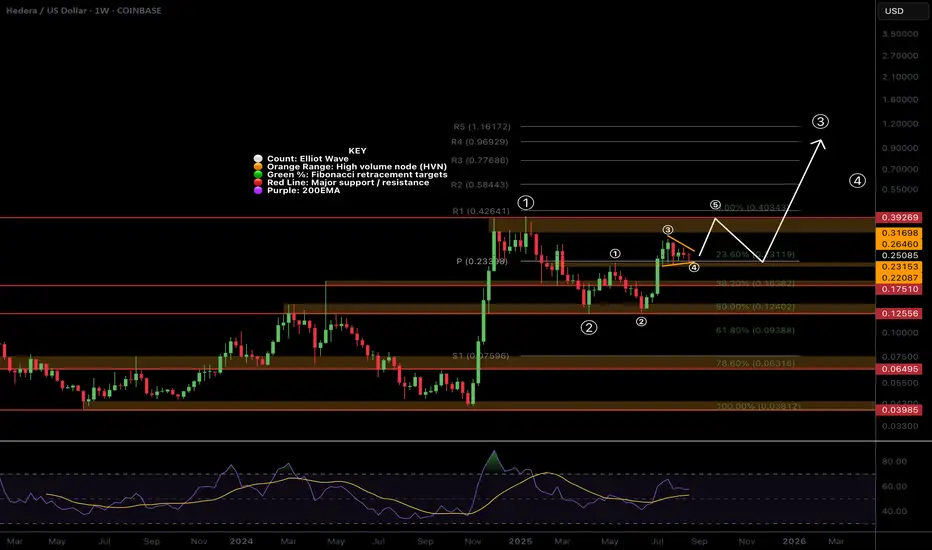
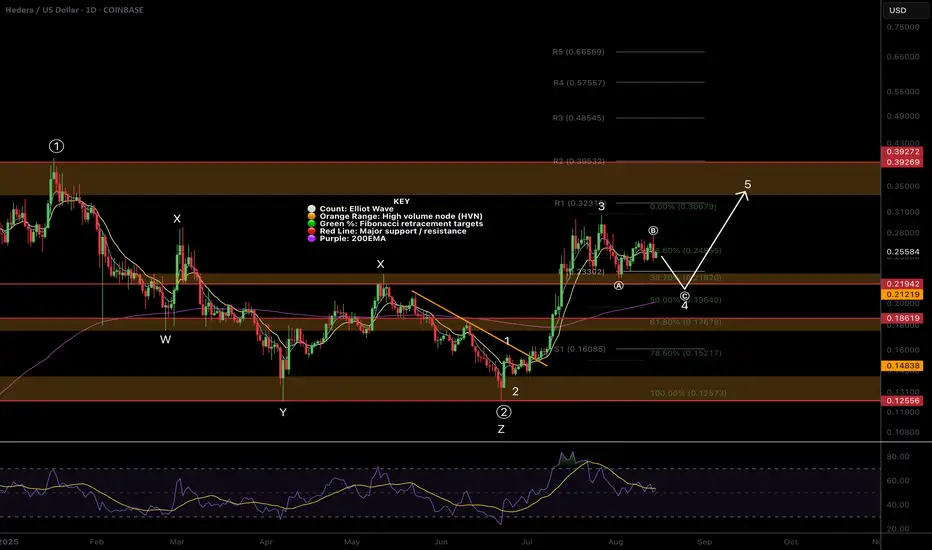
$HBAR Macro Chart - Ready for wave 5 of (1) of 3 up?CRYPTOCAP:HBAR appears to be printing a wave 4 triangle above the weekly pivot point. This implies the next move would be a terminal wave (5) of 1 of (3) likely completing with a poke above all time high to trap FOMO novice investor / traders. Classic Elliot Wave.
Wave 2 of (3) has a high probability of ending at the wave 4 triangle base which is the weekly pivot and 0.236 Fibonacci retracement adding confluence. This fib level support would indicating continued trend strength.
If it is a wave 1 of (3) is completing then we can expect the long term target to overextend the weekly R5 pivot point of $1.16, possibly reaching $3.
Weekly RSI remains at the EQ so plenty of room to grow.
Analysis is invalidated below the weekly pivot.
Safe trading
$AAVE Set for all time high?AAVE tested the weekly pivot as support and after a secondary pullback to the 0.236 Fibonacci retracement, sky rocketed alongside BTC and crypto yesterday to a new local high.
Wave III looks truly underway with this kind of price action and the target remains the R5 weekly pivot at $1155. High Volume Node resistance at $460 and $670 are the next targets.
Weekly RSI has plenty of room to grow to get to overbought.
Analysis is invalidated below $111 so plenty of room to breathe!
Safe trading

$ONDO ABC Correction in Wave 2?LSE:ONDO wave (c) of 2 appears to be underway after the failure to reach a new local high. However there is strong support just below of the daily pivot and 200EMA.
Failure to hold this level brings up the High Volume Node support and golden pocket at $0.79. RSI has room to fall and the alt-coin golden pocket, Fibonacci 0.786 sits at the S1 daily pivot.
Analysis is invalidated above wave B.
Safe trading
A Local look at the $HBAR retracementWave (c) appears to be underway with a target of the golden pocket and major support High Volume Node at $0.175.
There may resistance at the daily 200EMA along the way but it just seems to floating between supply and demand zones right now.
Daily RSI has room to fall.
Safe trading

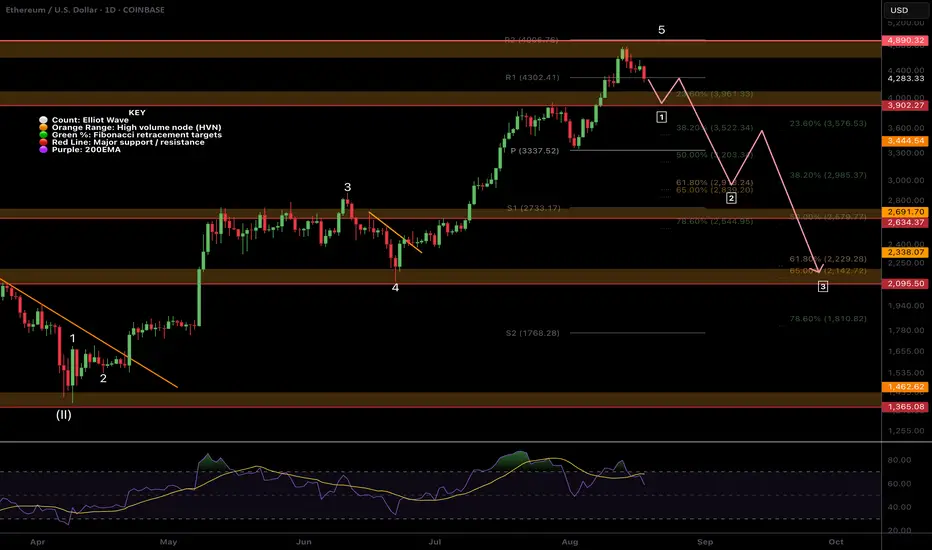
$ETH Topping Without All Time High?Has the most anticipated all time high of the year been cancelled? The crowd does not get what it wants! Everyone from CNBC to my grandmas goldfish have been bullish on ETH for the past few months so what a fitting psychological mess it would be if we significantly pulled back here!
Firstly it may just be a temporary set back to the High Volume Node support at $3900 before a move to all time high. Even then I am expecting a deeper pullback to set us up for all time high in Q4. Losing this support bring up the ascending daily 200EMA right at the Fibonacci golden pocket, which you can see is the wave 3 high!
The next target, which is my next buy level, is the larger degree Fibonacci golden pocket, major support High Volume Node and wave 4 bottom at $2100. This would be a capitulation area for many!
RSI has printed confirmed bearish divergence with plenty of room to fall.
Safe trading
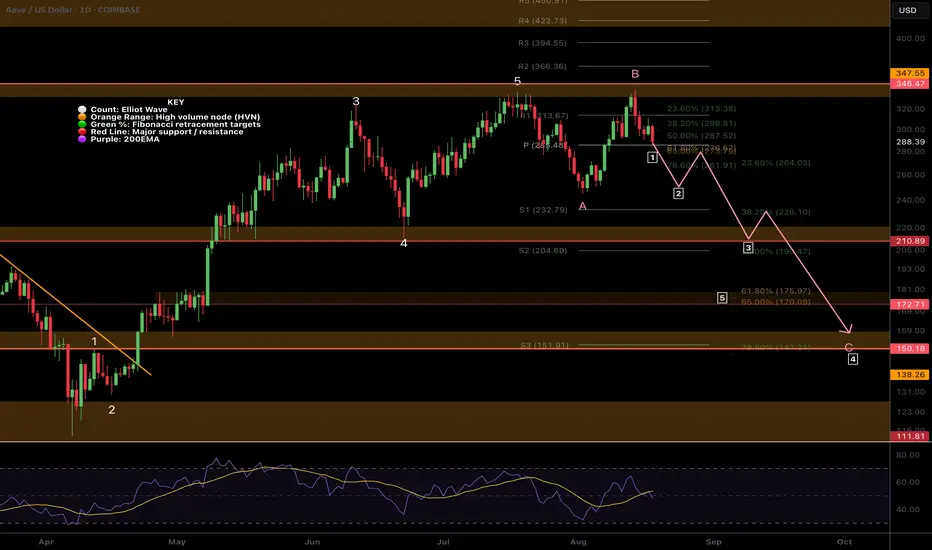
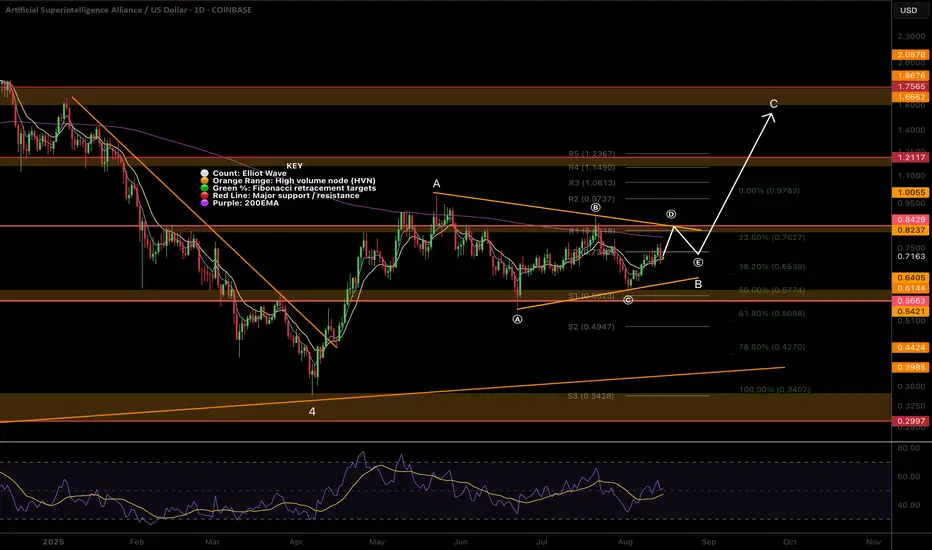
$AAVE Local Expanded Flat Correction?CRYPTOCAP:AAVE Elliot wave count could be printing an expanded flat correction in wave 2.
5 waves up complete a motif wave with daily RSI in overbought. 3 clear waves down for wave A (or X) was next followed by a poke above all time on confirmed bearish divergence.
If the count is correct then our first target would be a swing below wave A and the ascending daily 200EMA at point . Further decline in wave C (or Z) brings up the previous wave 4 target and the High Volume Node major support $210 point
A steeper decline in wave 2, aligning with my September dump idea, brings up the golden pocket at but a more likely target is the alt-coin golden packet at 0.786, s3 daily pivot and High Volume Node support . This would be a great buy opportunity for me.
Safe trading
$HBAR Printing an ABC in wave 4?Wave C of an ABC correction in wave 4 appears to be underway in CRYPTOCAP:HBAR
This would see price have a quick drop below the daily pivot testing the major support High Volume Node and rising daily 200EMA as support before continuing up in wave 5. This is also the .382-.5 Fibonacci retracement a typical area for wave 4 to end per Elliot wave rules. Lots of confluence in this area.
RSI is still making its way down from overbought. Investor psychology is still irrationally bullish giving opportunity for professional traders to make some volatility bucks.
Analysis is invalidated if price breaks $0.273 upgrading the count to wave 4 completing at the current wave (a) bottom.
Safe trading
$FET Elliot Wave Updated, Triangle forming?NYSE:FET appears to be printing a triangle in a larger degree wave B of an ABC counter-bear trend correction.
Wave (D) is expected to finish at the descending resistance, poking above the daily 200EMA, while wave (e) is often shallow so expected to end at the daily pivot point. The target is $1.6 at he triangle pattern depth and major High Volume Node resistance.
An ABC corrective wave does not mean that the macro count is invalidated and may form part of larger ending diagonal series of ABCs to achieve my high degree wave 5 targets above all time high. I will update the weekly chart to reflect this shortly.
Safe trading
$AAVE Continues to follow the path!CRYPTOCAP:AAVE was immediately reject from the swing high as expected, per the percentage band take profit rules.
Daily RSI has plenty of room to grow to reach the all time High Volume Node resistance which is the next target at $430.
Based on the depth of wave (2) after touching the daily 200EMA as support, wave 3 is still underway to complete the larger degree wave 5 with a poke above all high, the highest probability terminal target per Elliot wave rules.
Safe trading
For those interested in trading signals / diary & trade management / trading parameters etc... Signals updated for 15/08/25
✅ LSE:ONDO DEMA Percentage Band rule added
✅ CRYPTOCAP:BTC hit take profit #2 for 2.59RR
✅ CRYPTOCAP:AAVE (DEMA) HIt take profit 1 for 1.45RR
✅ CRYPTOCAP:ADA moved 10% after signal activation but still not hit take profit 1
✅ NASDAQ:AAPL (Apple) very close to take profit #1
✅ BTC added to completed trade signals along side Take profit 2 for google, 700, HBAR and a few stop (INJ, SOL, BTDR) and invalidations for META, SHIBINU, WLD)
Safe trading
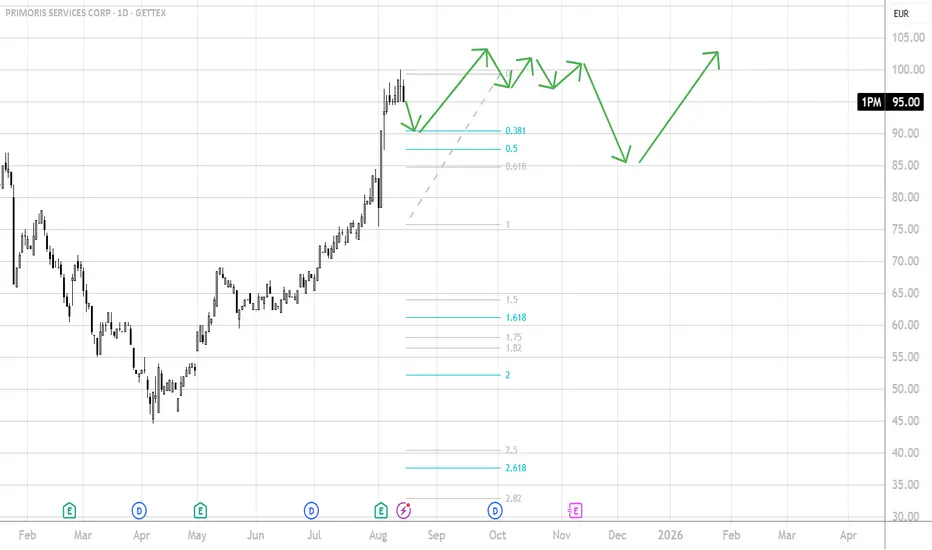
PRIMORIS SERVICES - Seasonal forecastbased on the seasonal data for that stock plotted onto the chart what I believe is likely to happen.
This ins not ment as a trade call. It is for education purpose only.
Comment and/ or chat and please hit the rocket ( like!
Good Luck, Cheers!
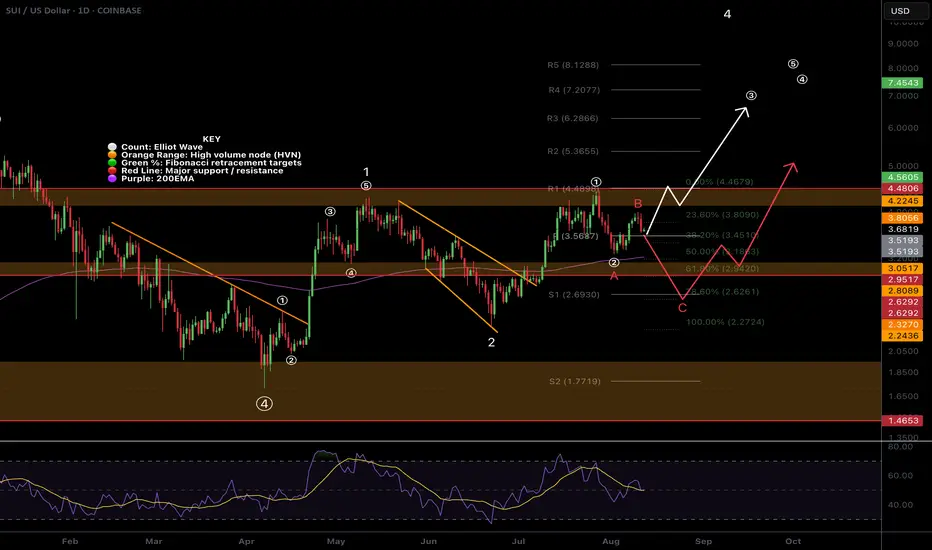
$SUI Short term bearish move coming?CRYPTOCAP:SUI is currently testing the daily pivot as support which must hold to keep the bullish count alive.
I have 2 Elliot Wave counts, short term bullish and bearish that I am patiently waiting to see unfold. Long term is still bullish.
The white count suggests that we have printed a micro wave (1) and are completing a wave (2) now at the daily pivot just above the daily 200EMA where price should move powerfully in a wave (3) of 3 upwards.
Alternatively, the red count, wave B of a larger corrective could also be complete at the recent swing high and losing the pivot and daily 20EMA would confirm this. Wave C has an initial target of the triple support 0.618 Fibonacci retracement, daily 200EMA and major support High Volume Node at $3 to complete wave 2 and a secondary target of the alt-coin golden pocket 0.786 Fibonacci retracement and S1 daily pivot at $2.7
The bearish analysis is my preferred count due to the amount of confluence, including the fact we are entering mid August and this move would also push daily RSI back into oversold.
This would set up new long signals so look out for those in the Substack Trading Signals
Safe trading
$SOL Short term Bearish Outlook ?CRYPTOCAP:SOL Solana is currently testing the daily pivot as support which must hold to keep the bullish count alive.
I have 2 Elliot Wave counts, short term bullish and bearish that I am patiently waiting to see unfold. Long term is still bullish.
The white count suggests that we have printed a wave (1) and are completing a wave (2) now at the daily pivot just above the daily 200EMA where price should move powerfully in a wave 3 upwards.
Alternatively, the red count, wave B of a larger corrective could also be complete at the recent swing high and losing the pivot and daily 20EMA would confirm this. Wave C has a target of the triple support alt-coin golden pocket 0.786 Fibonacci retracement, S1 daily pivot and major support High Volume Node at $142 to complete wave 2.
The bearish analysis is my preferred count due to the amount of confluence, including the fact we are entering mid August and this move would also push daily RSI back into oversold.
This would set up new long signals! The asset is in limbo atm, not very impulsive as you would expect for wave 3.
Safe trading

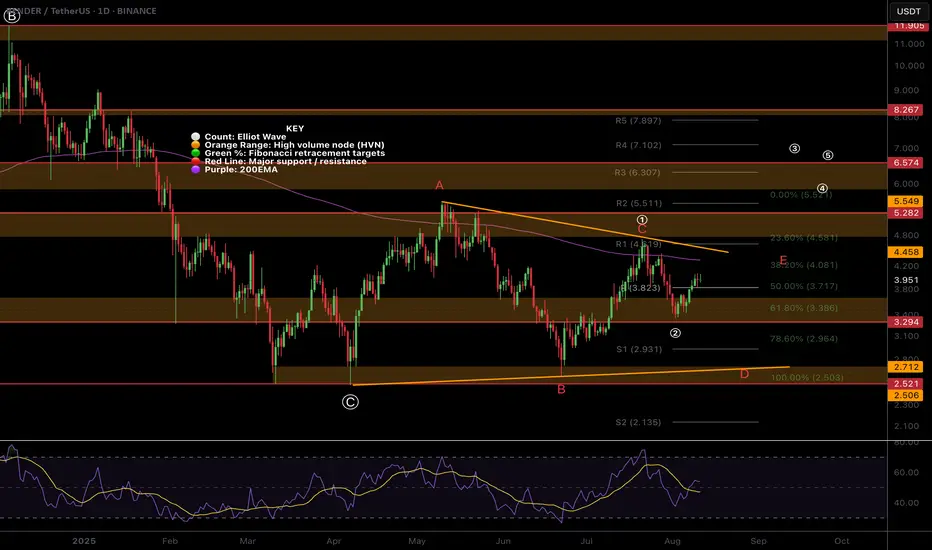
$RENDER bearish triangle or motif wave?I have 2 local Elliot Wave counts for CRYPTOCAP:RENDER the bearish triangle yet to complete wave D which would result in a final thrust down before a new macro uptrend and a (1) (2) with wave (3) started.
The overlapping and slow price action does not suggest RENDER is in a wave as it is not moving impulsively.
Many alts have failed to move from the bottom while others have shined like ETH and XRP etc..
Either this is the new normal behaviour for 'alt season' or we are not actually in alt-season yet with a big move lower around the corner!
Safe trading
$ETH All Time High Soon?CRYPTOCAP:ETH wave 3 is still underway and its the only news you've been hearing about for 2 weeks! The hype is real making the potential top of this move much closer as institutions will be selling into the FOMO soon. There is no better way to trap newbies than a poke above all time high before a savage retracement!
Retracement targets are the daily pivot and rising 200EMA at $3337 the .382 Fibonacci retracement from the wave 2 bottom, just above the weekly pivot point. Daily RSI has huge bearish divergence.
Secondary retracement targets are the weekly 200EMA and S1 weekly pivot sitting at $2250 which could present an incredible buying opportunity before the real alt season!
Analysis is invalidated below $2122
New long signals are building in the DEMA PBR and Price Action strategies so keep an eye out on the Trade Signals Substack as we have made very good profits lately in these markets!
Safe trading

XRP - The Unpopular Analysis!XRP printed a macro triangle from 2021-2024. Triangles are an Elliot wave pattern resulting in a terminal thrust up in a motif wave before price returns to the bottom of the triangle at $0.28! Now this seems extremely unlikely given whats going on fundamentally but I don't make the rules so don't shoot the messenger!
The motif wave appears to have completed wave 4 bull flag at the $1.6 swing low and wave 5 is underway (which can overextend). Elliot wave count would suggest we are near a major top after one more push up to new highs. More realistic price targets for a deep retracement would be $1.6 again which the ascending weekly 200EMA would catch up to for confluence.
Interested to hear from the other Elliot wave specialists on this count!
Analysis is invalidated below $1.6
New long signals are building in the DEMA PBR and Price Action strategies so keep an eye out on the Trade Signals Substack as we have made very good profits lately in these markets!
Safe trading
