#SEI/USDT The best future belongs to this coin.#SEI
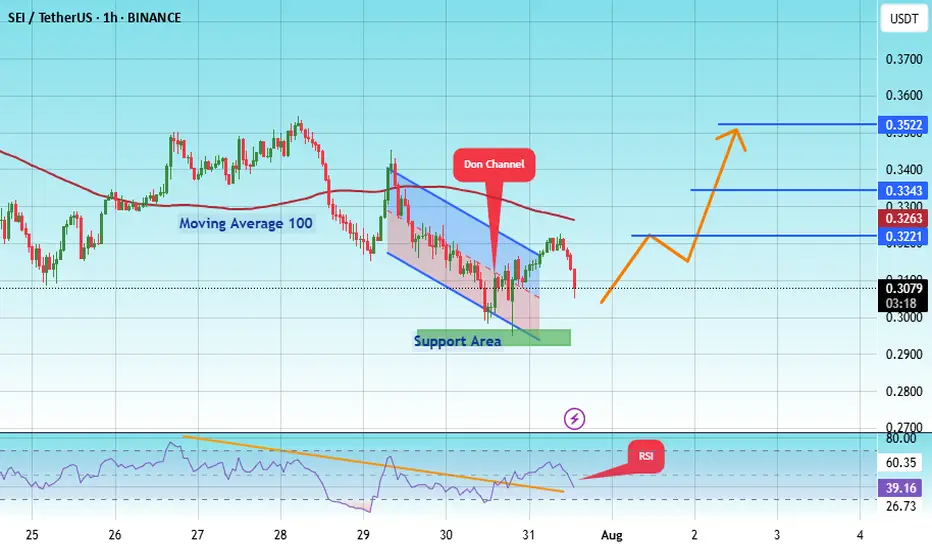
The price is moving within an ascending channel on the 1-hour frame, adhering well to it, and is on track to break it strongly upwards and retest it.
We have support from the lower boundary of the ascending channel, at 0.2967.
We have a downtrend on the RSI indicator that is about to break and retest, supporting the upside.
There is a major support area in green at 0.2950, which represents a strong basis for the upside.
Don't forget a simple thing: ease and capital.
When you reach the first target, save some money and then change your stop-loss order to an entry order.
For inquiries, please leave a comment.
We have a trend to hold above the 100 Moving Average.
Entry price: 0.3080.
First target: 0.3221.
Second target: 0.3343.
Third target: 0.3522.
Don't forget a simple thing: ease and capital.
When you reach your first target, save some money and then change your stop-loss order to an entry order.
For inquiries, please leave a comment.
Thank you.
SEIBTC
SEI : The best future belongs to this coin.Hello friends🙌
Given the rapid growth that this coin has had and I think it will continue, now that the price is correcting, there is a good opportunity to buy in stages with risk and capital management and move with it to the specified goals.
🔥Follow us for more signals🔥
*Trade safely with us*
SEI BUY LIMITHello friends🙌
📉According to the downward trend we had, you can see that a reversal pattern was formed at the specified support and buyers entered and raised the price, which caused the formation of an ascending channel.
👀Now that we are at the ceiling of the ascending channel, because there is a possibility of price correction, we will place two more buying steps down and buy with risk and capital management and move with it to the specified targets.
🔥Follow us for more signals🔥
*Trade safely with us*
SEIUSDT Rebounds from Key Support - Pump Loading?BINANCE:SEIUSDT Rebounds from Key Support - Pump Loading?
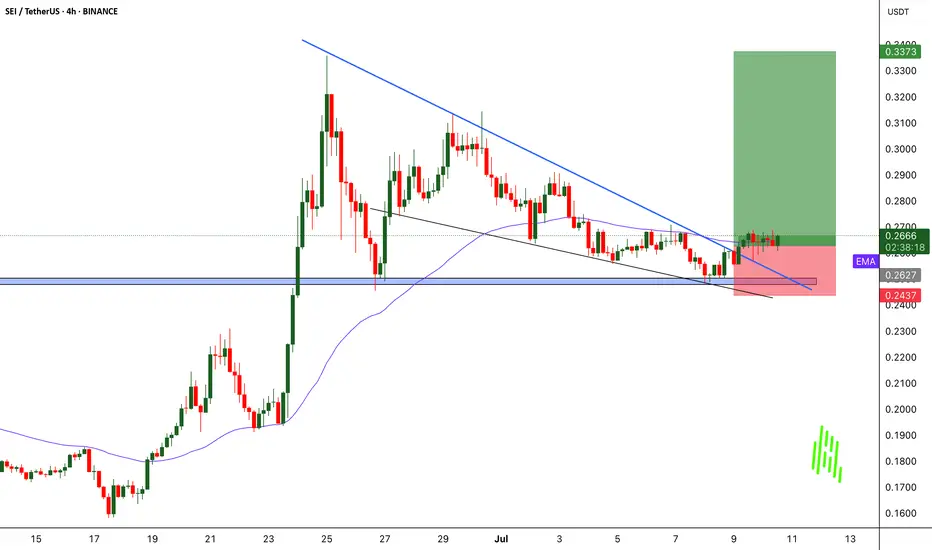
BINANCE:SEIUSDT just touched a major support level on the 4H chart and is now showing signs of a bullish reversal after breaking above the descending trendline. This setup looks similar to previous price actions where NYSE:SEI delivered sudden explosive moves post-breakout. If history repeats, we could be looking at another strong rally ahead.
Entry looks promising, but as always, manage your risk wisely and set a proper stop loss to protect your capital.
BINANCE:SEIUSDT Currently trading at 0.265
Buy level : Above $0.263
Stop loss : Below $0.243
Target : $0.337
Max leverage 5x
Always keep stop loss
Follow Our Tradingview Account for More Technical Analysis Updates, | Like, Share and Comment Your thoughts
#SEI/USDT#SEI
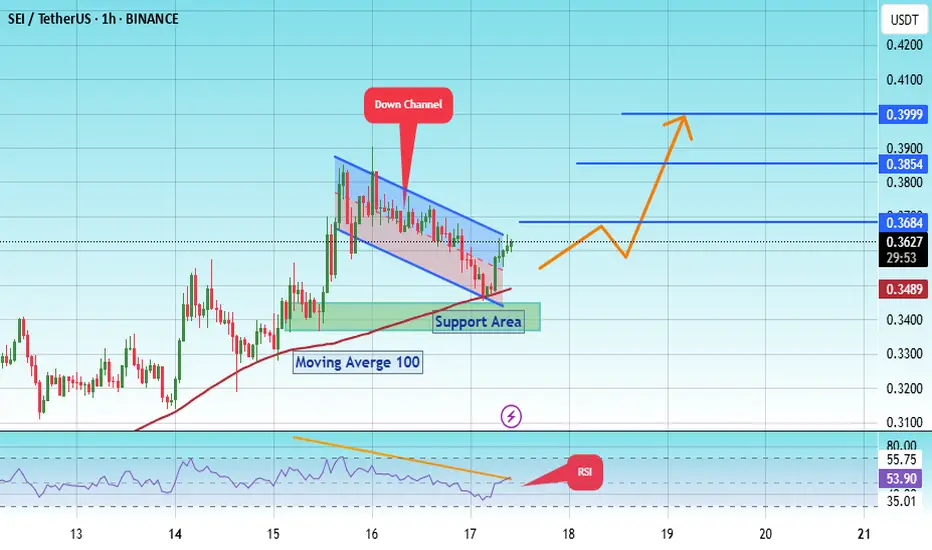
The price is moving within a descending channel on the 1-hour frame, adhering well to it, and is on its way to breaking strongly upwards and retesting it.
We have support from the lower boundary of the descending channel at 0.3450.
We have a downtrend on the RSI indicator that is about to break and retest, supporting the upside.
There is a major support area in green at 0.3380, which represents a strong basis for the upside.
Don't forget a simple thing: ease and capital.
When you reach the first target, save some money and then change your stop-loss order to an entry order.
For inquiries, please leave a comment.
We have a trend to hold above the 100 Moving Average.
Entry price: 0.3580
First target: 0.3684
Second target: 0.3850
Third target: 0.4016
Don't forget a simple thing: ease and capital.
When you reach your first target, save some money and then change your stop-loss order to an entry order.
For inquiries, please leave a comment.
Thank you.
#SEI/USDT Ready to Fly? Breakout #SEI
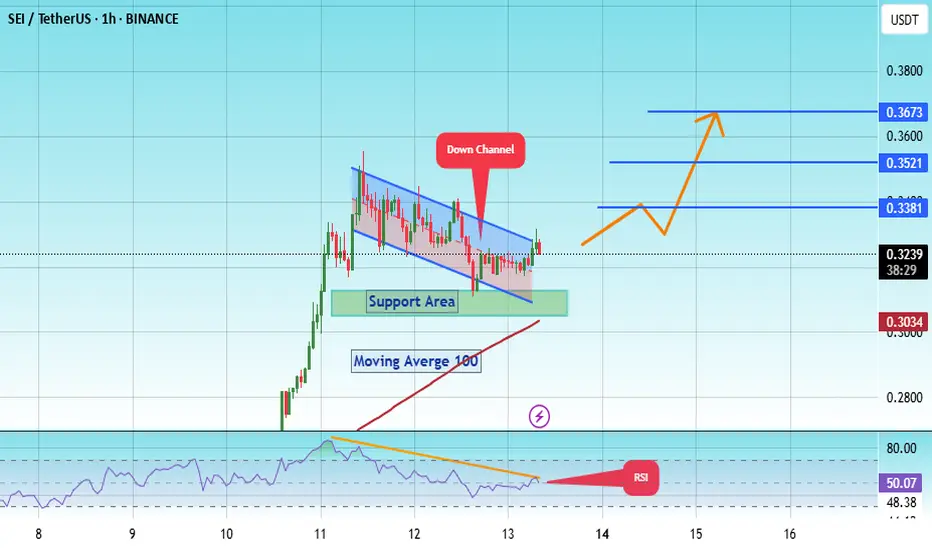
The price is moving within a descending channel on the 1-hour frame, adhering well to it, and is on its way to breaking it strongly upwards and retesting it.
We have a bounce from the lower boundary of the descending channel. This support is at 0.3140.
We have a downtrend on the RSI indicator that is about to be broken and retested, supporting the upside.
There is a major support area (in green) at 0.3050, which represents a strong basis for the upside.
Don't forget a simple thing: ease and capital.
When you reach the first target, save some money and then change your stop-loss order to an entry order.
For inquiries, please leave a comment.
We have a trend to hold above the 100 Moving Average.
Entry price: 0.3246
First target: 0.3381
Second target: 0.3521
Third target: 0.3673
Don't forget a simple thing: ease and capital.
When you reach the first target, save some money and then change your stop-loss order to an entry order.
For inquiries, please leave a comment.
Thank you.
SEIUSDT on the Brink of a Major Explosion… or Total Breakdown?Yello Paradisers! Are you prepared to act with precision—or will you get trapped like the rest before the real move begins? #SEI has entered a highly reactive price zone where one wrong candle could invalidate the entire bullish structure. The market is whispering its next move, but only those who understand structure and timing will be ready to capitalize.
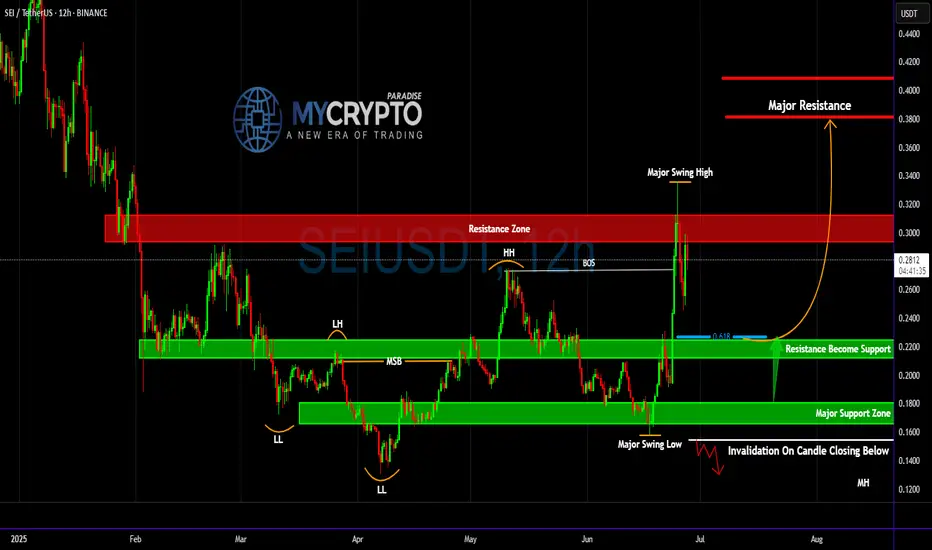
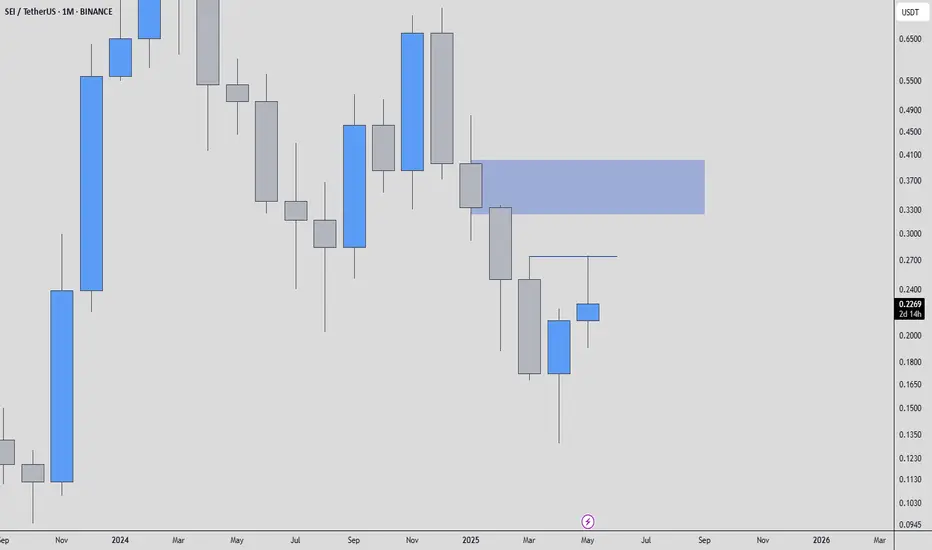
💎#SEIUSDT has completed a significant transition from a bearish trend structure to a more bullish one. Earlier, the price formed consecutive Lower Lows (LL) and Lower Highs (LH), confirming bearish momentum. However, that trend shifted once the market printed a Market Structure Break (MSB) around the 0.2121–0.2253 range. This area—previously acting as resistance—has now flipped into a confirmed support zone, marking a critical bullish development.
💎The structure strengthened further when SEI broke above the prior Higher High (HH) and created a Break of Structure (BOS). That move catapulted price into the red resistance zone between 0.2929 and 0.3152, just beneath the last major swing high at 0.3471. This zone is now acting as a ceiling, containing bullish pressure—but the underlying structure remains intact unless we see an invalidation close below key levels.
💎High probability, SEI i retracing back into the 0.618 Fibonacci level at 0.2269, which aligns precisely with the flipped support zone. This is a textbook bullish retest, and as long as the price holds above 0.2121, the probability for continuation remains high. The coming candles will be decisive: they will either confirm strength and fuel continuation—or fail and lead to a complete structure breakdown.
💎If buyers manage to hold the key support zone between 0.2269 and 0.2121, the probability of a bullish continuation increases significantly. The first major target on the upside is 0.3471, which marks the previous swing high and is likely to act as the initial area of resistance. A clean break above that level could open the path toward 0.3812, followed by 0.4086, both of which align with higher timeframe supply zones and represent strong historical resistance. These levels are expected to attract profit-taking and short-term volatility, making them critical decision points for continuation or rejection in the next phase of SEI’s move.
💎However, traders must be alert: any candle close below 0.1554 will serve as a hard invalidation level for this bullish thesis. If that happens, the structure flips bearish, and we would anticipate a deeper correction toward 0.1361 or even lower. That’s the line we are not willing to ignore—structure and discipline come first.
This is not the time to trade emotionally, Paradisers . Retail traders will act impulsively—either FOMOing at the highs or panic-selling at the lows. The smart move here is to observe how price reacts and only execute if there’s clear confirmation and structure support. No guessing. No gambling.
MyCryptoParadise
iFeel the success🌴
#SEI/USDT#SEI
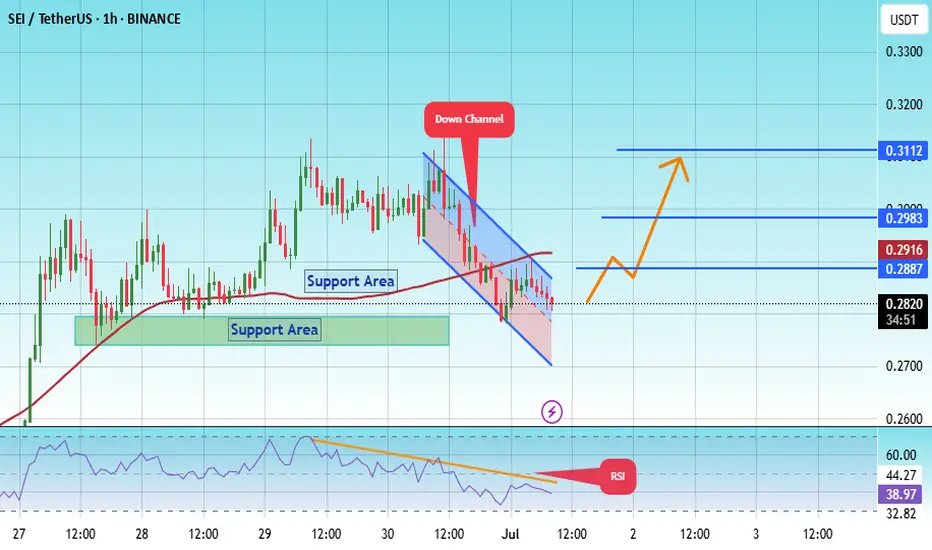
The price is moving within a descending channel on the 1-hour frame, adhering well to it, and is heading for a strong breakout and retest.
We have a bounce from the lower boundary of the descending channel. This support is at 0.2745.
We have a downtrend on the RSI indicator that is about to be broken and retested, supporting the upside.
There is a major support area (in green) at 0.2710, which represents a strong basis for the upside.
Don't forget a simple thing: ease and capital.
When you reach the first target, save some money and then change your stop-loss order to an entry order.
For inquiries, please leave a comment.
We have a trend to hold above the 100 Moving Average.
Entry price: 0.2813
First target: 0.2887
Second target: 0.2983
Third target: 0.3112
Don't forget a simple thing: ease and capital.
When you reach the first target, save some money and then change your stop-loss order to an entry order.
For inquiries, please leave a comment.
Thank you.
SEIUSDT Forming Falling WedgeSEIUSDT is showing a highly attractive setup with the formation of a classic falling wedge pattern, a structure known for indicating a strong trend reversal. The price action has respected the wedge boundaries, consolidating with lower highs and lower lows before a decisive breakout appears imminent. With the volume profile confirming increased buying interest, this pattern suggests the potential for an 80% to 90% upside move, capturing the attention of traders searching for breakout opportunities in altcoins.
SEI, the native token for the Sei Network — a sector-focused Layer 1 blockchain built for trading — has been drawing steady investor interest thanks to its unique positioning and growing ecosystem. As more projects adopt Sei’s fast and efficient trading infrastructure, market sentiment around SEIUSDT remains positive. This strong fundamental narrative combined with the bullish wedge breakout strengthens the case for significant gains in the near term.
From a technical perspective, traders should watch for confirmation candles and sustained buying volume above the resistance trendline. A successful breakout with retest could trigger a powerful rally, potentially unlocking the anticipated gains. Keeping an eye on key support zones within the wedge will help manage risk while maximizing the reward potential on this promising setup.
✅ Show your support by hitting the like button and
✅ Leaving a comment below! (What is You opinion about this Coin)
Your feedback and engagement keep me inspired to share more insightful market analysis with you!

#SEI/USDT#SEI
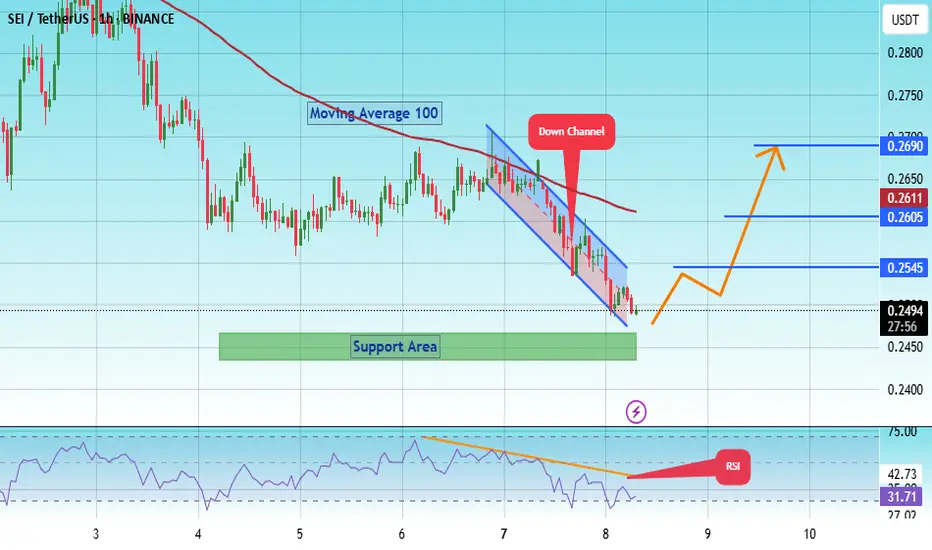
The price is moving within a descending channel on the 1-hour frame, adhering well to it, and is on its way to breaking it strongly upwards and retesting it.
We have a bounce from the lower boundary of the descending channel. This support is at 0.2470.
We have a downtrend on the RSI indicator that is about to be broken and retested, supporting the upside.
There is a major support area in green at 0.2440, which represents a strong basis for the upside.
Don't forget a simple thing: ease and capital.
When you reach the first target, save some money and then change your stop-loss order to an entry order.
For inquiries, please leave a comment.
We have a trend to hold above the 100 Moving Average.
Entry price: 0.2494
First target: 0.2545
Second target: 0.2600
Third target: 0.2690
Don't forget a simple thing: ease and capital.
When you reach the first target, save some money and then change your stop-loss order to an entry order.
For inquiries, please leave a comment.
Thank you.
Live trade hello friends✋️
Considering the price drop, you can now see that we are in important support and now we can take advantage of this situation and enter into a transaction with risk and capital management.
🔥Follow us for more signals🔥
*Trade safely with us*
SEI The next big Move#SEI
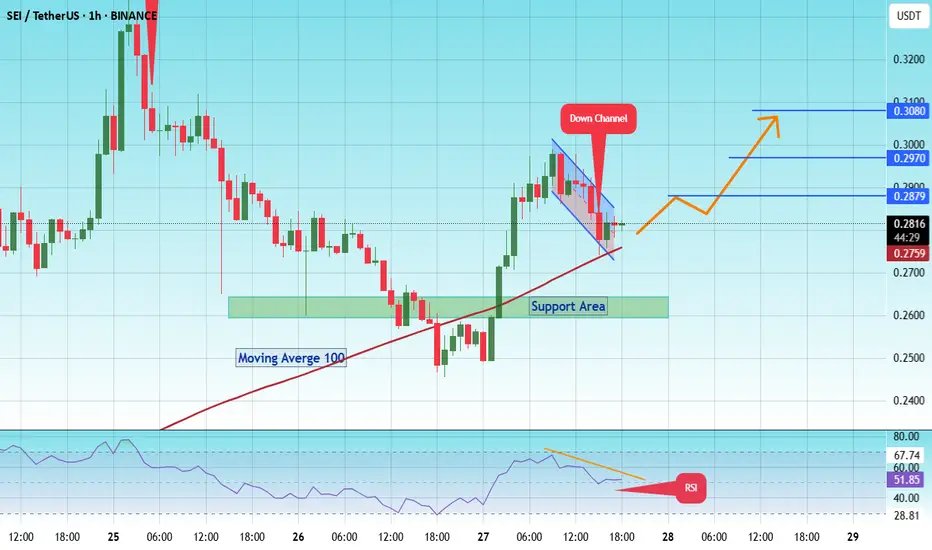
The price is moving within a descending channel on the 1-hour frame and is expected to break and continue upward.
We have a trend to stabilize above the 100 moving average once again.
We have a downtrend on the RSI indicator that supports the upward break.
We have a support area at the lower boundary of the channel at 0.2750, acting as strong support from which the price can rebound.
We have a major support area in green that pushed the price upward at 0.2600.
Entry price: 0.2813
First target: 0.2879
Second target: 0.2970
Third target: 0.3080
To manage risk, don't forget stop loss and capital management.
When you reach the first target, save some profits and then change your stop order to an entry order.
For inquiries, please comment.
Thank you.
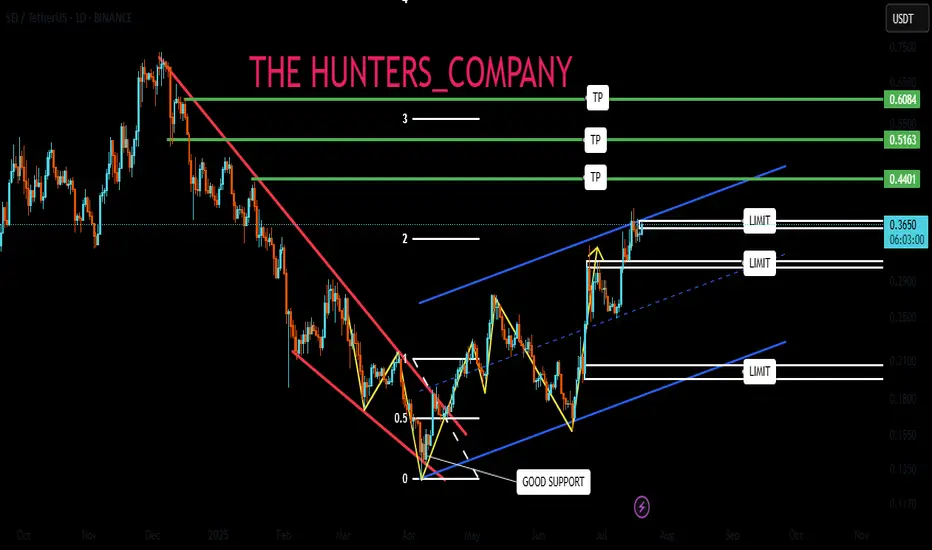
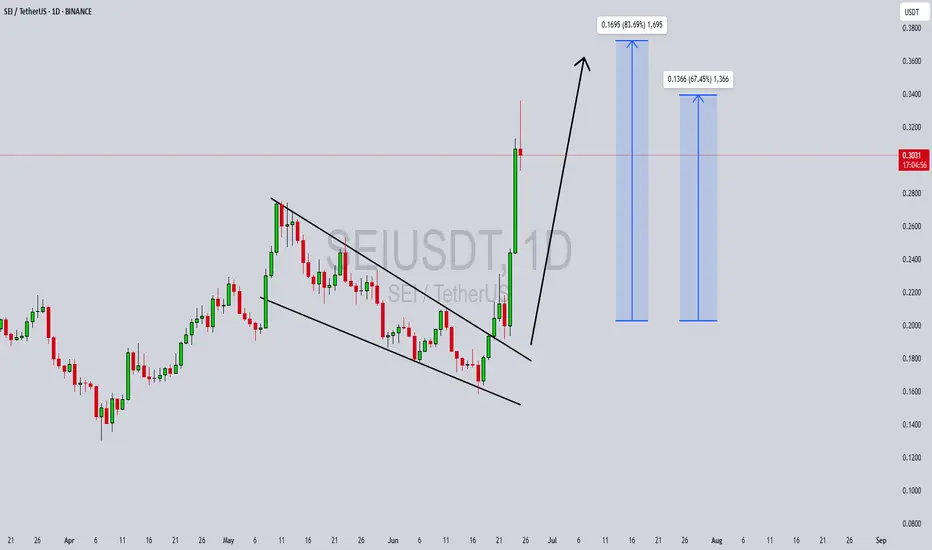
SEIUSDT Forming Falling WedgeSEIUSDT has recently confirmed a falling wedge breakout, a strong bullish reversal pattern that often marks the end of a downtrend and the start of an impulsive move upward. The breakout has occurred with solid momentum, and volume is supportive—indicating that buyers are stepping in with conviction. This technical formation suggests a potential price surge ranging between 60% to 70%, aligning with historical projections from similar wedge breakouts.
As shown in the daily chart, SEIUSDT has broken above the wedge resistance and followed up with strong bullish candles. This surge confirms growing demand and positive sentiment in the market. Notably, the immediate targets are marked at $0.34 and $0.37, with upside potential of over 83% from the breakout point, offering attractive risk-reward for traders and swing investors.
Fundamentally, SEI is gaining traction within the decentralized ecosystem. Its focus on high-performance blockchain scalability and its growing developer community is drawing significant attention. Social media chatter and on-chain data also reflect increasing accumulation from retail and mid-tier wallets. Such organic traction often translates into sustainable price movements, especially when paired with strong technical setups like this.
Overall, SEIUSDT is shaping up as a high-potential altcoin play. With technical confirmation, investor interest, and bullish sentiment across the board, this breakout could be just the beginning of a larger trend. Traders should keep an eye on pullbacks for potential entries and watch for continuation above local resistance levels.
✅ Show your support by hitting the like button and
✅ Leaving a comment below! (What is You opinion about this Coin)
Your feedback and engagement keep me inspired to share more insightful market analysis with you!
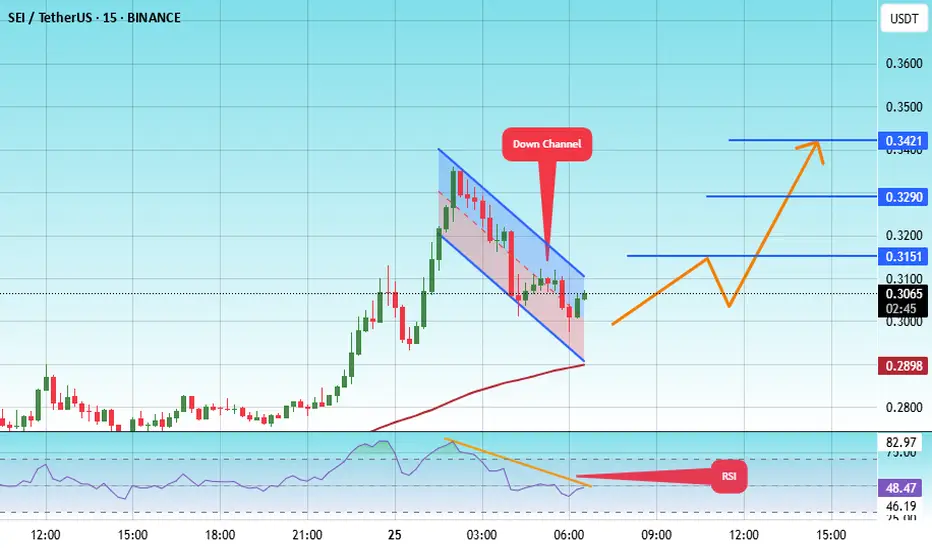
#SEI/USDT#SEI
The price is moving within a descending channel on the 1-hour frame, adhering well to it, and is on its way to breaking it strongly upwards and retesting it.
We are seeing a rebound from the lower boundary of the descending channel, which is support at 0.2942.
We have a downtrend on the RSI indicator that is about to break and retest, which supports the upward trend.
We are looking for stability above the 100 moving average.
Entry price: 0.3062
First target: 0.3151
Second target: 0.3290
Third target: 0.3421
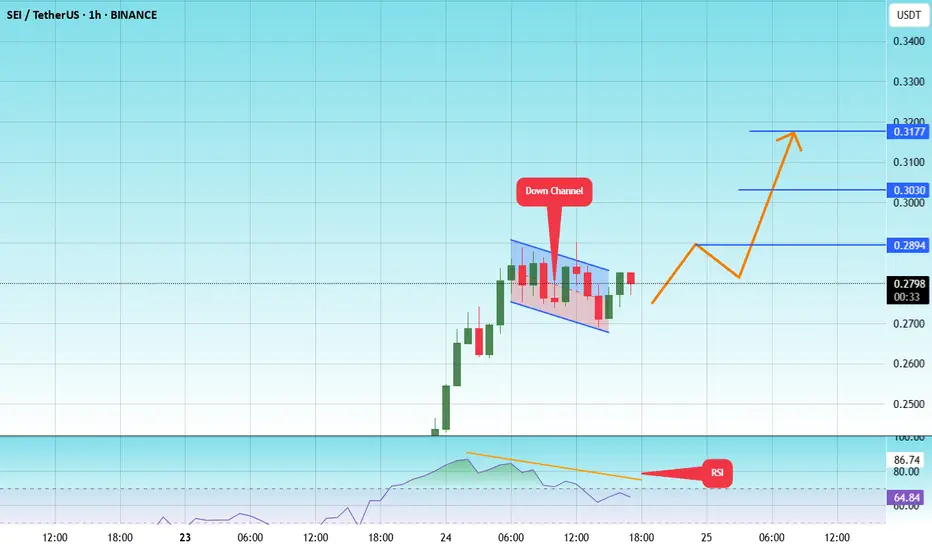
#SEI/USDT#SEI
The price is moving within a descending channel on the 1-hour frame and is expected to break and continue upward.
We have a trend to stabilize above the 100 moving average once again.
We have a downtrend on the RSI indicator, which supports the upward move by breaking it upward.
We have a support area at the lower limit of the channel at 0.2696, acting as strong support from which the price can rebound.
Entry price: 0.2790
First target: 0.2894
Second target: 0.3030
Third target: 0.3177
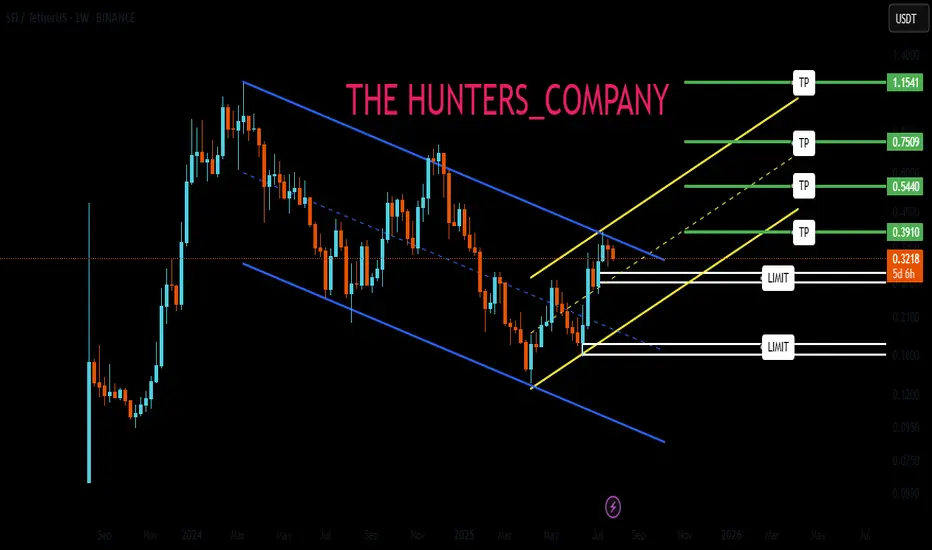
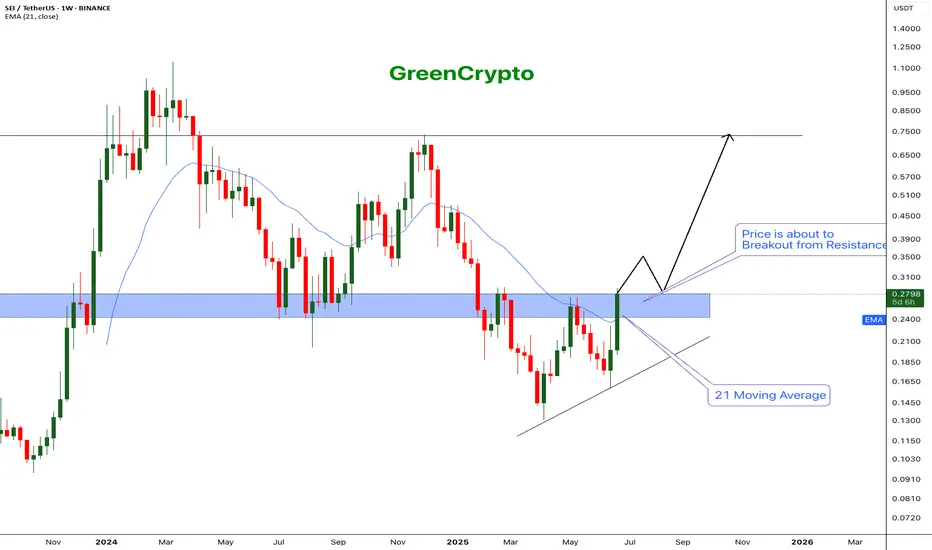
SEI - The next big runner$BINANCE:SEI/USDT (1W CHART) Technical Analysis Update
SEI is currently trading at $0.2785 and showing overall bullish sentiment
Price successfully breached the 21 EMA and now price is trading near one of the major resistance zone.
If the weekly candles closes above the resistance then we can expect further bullish momentum.
I'm expecting the price to easily break the resistance and hit the next major resistanc e around 0.75
Entry: After close above resistance (0.285)
StopLoss: 0.18
TakeProfit 1: 0.3506
TakeProfit 2: 0.4962
TakeProfit 3: 0.7367
Don't forget to keep stoploss!
Follow our TradingView account for more technical analysis updates. | Like, share, and comment your thoughts.
Cheers
GreenCrypto
#SEI/USDT#SEI
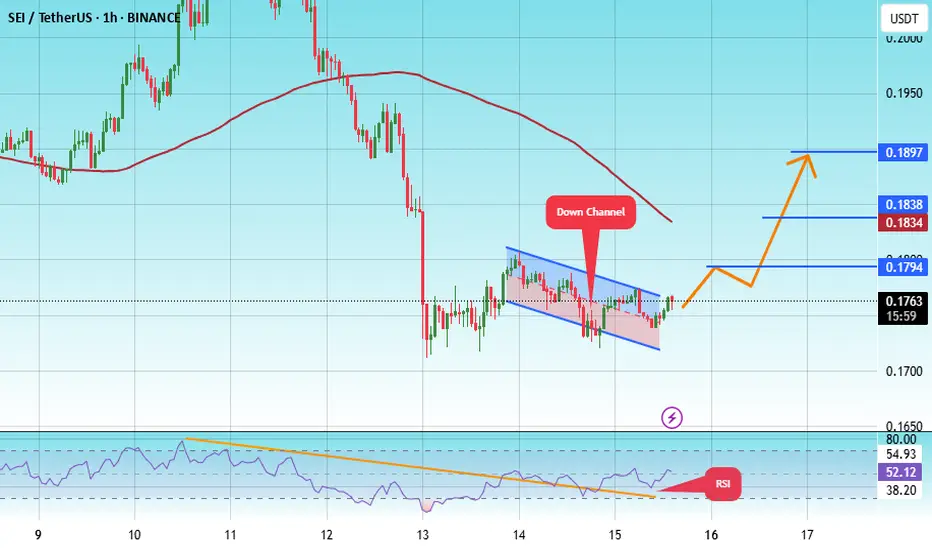
The price is moving within a descending channel on the 1-hour frame, adhering well to it, and is heading for a strong breakout and retest.
We are experiencing a rebound from the lower boundary of the descending channel. This support is at 0.1725.
We are experiencing a downtrend on the RSI indicator, which is about to break and retest, supporting the upward trend.
We are heading for stability above the 100 Moving Average.
Entry price: 0.1766
First target: 0.1794
Second target: 0.1834
Third target: 0.1890
#SEI/USDT#SEI
The price is moving within a descending channel on the 1-hour frame, adhering well to it, and is heading for a strong breakout and retest.
We are experiencing a rebound from the lower boundary of the descending channel, which is support at 0.1840.
We are experiencing a downtrend on the RSI indicator, which is about to break and retest, supporting the upward trend.
We are in a trend of consolidation above the 100 Moving Average.
Entry price: 0.1927
First target: 0.1999
Second target: 0.2067
Third target: 0.2162

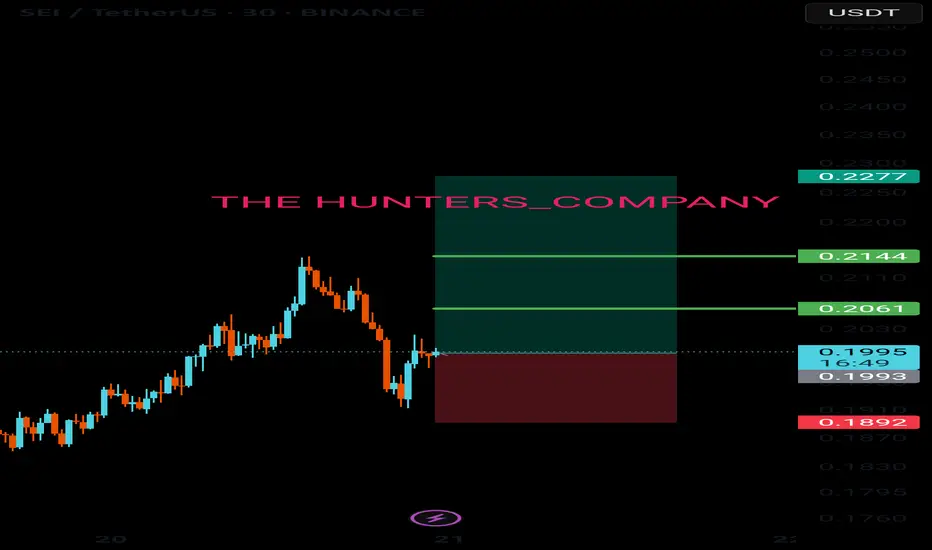
SEIUSDT - MEH!Hello everyone. I'm closely monitoring SEIUSDT, and I've observed significant activity in this asset: buyers have entered the market. This is a situation that demands close attention, as it carries the potential to shift the market's trajectory.
Our current focus is the blue box I've marked on the chart. This area currently presents itself as a resistance level. However, if buyers continue to strengthen and decisively break this blue box upwards, that's when a real opportunity could emerge. In such a scenario, following the breakout, I'll be looking for a retest on a low timeframe (LTF). If the price confirms this broken level as support, that will be a strong long position signal for me. This is one of those moments where the market is telling you, "I'm here."
When evaluating this scenario, I won't, of course, rely solely on price action. I'll be closely examining the volume footprint; understanding the true strength and intent of buyers is crucial. At the same time, I won't overlook CDV (Cumulative Delta Volume) divergences, as these can reveal hidden shifts in momentum. Sudden increases in volume, as always, act as a magnet for me; because, as you know, I only trade coins that are showing a sudden spike in volume. This is one of the secrets the market whispers to you.
However, as always, the market is two-sided, and we must remain flexible. If buyers fail to break this blue box and we see decisive downward breakouts on the daily timeframe, this could also present a potential scenario for a short attempt. Remember, the market can act independently of our expectations, and as a trader with one of the highest win rates, I always move according to the direction the market shows us.
We must also be vigilant against potential liquidity hunts at these levels. Price briefly pushing above the blue box and then rapidly falling back, or dipping below and then recovering, could be manipulations designed to shake out weaker hands. Failed breakouts or the regaining of lost levels will also provide us with valuable information.
Don't be surprised to see significant movements in SEIUSDT in the coming days. You might regret missing this setup, as most traders overlook these nuances at this level. Stay tuned, and let's decipher what the market is whispering together. You can trust my perspective.
📌I keep my charts clean and simple because I believe clarity leads to better decisions.
📌My approach is built on years of experience and a solid track record. I don’t claim to know it all but I’m confident in my ability to spot high-probability setups.
📌If you would like to learn how to use the heatmap, cumulative volume delta and volume footprint techniques that I use below to determine very accurate demand regions, you can send me a private message. I help anyone who wants it completely free of charge.
🔑I have a long list of my proven technique below:
🎯 ZENUSDT.P: Patience & Profitability | %230 Reaction from the Sniper Entry
🐶 DOGEUSDT.P: Next Move
🎨 RENDERUSDT.P: Opportunity of the Month
💎 ETHUSDT.P: Where to Retrace
🟢 BNBUSDT.P: Potential Surge
📊 BTC Dominance: Reaction Zone
🌊 WAVESUSDT.P: Demand Zone Potential
🟣 UNIUSDT.P: Long-Term Trade
🔵 XRPUSDT.P: Entry Zones
🔗 LINKUSDT.P: Follow The River
📈 BTCUSDT.P: Two Key Demand Zones
🟩 POLUSDT: Bullish Momentum
🌟 PENDLEUSDT.P: Where Opportunity Meets Precision
🔥 BTCUSDT.P: Liquidation of Highly Leveraged Longs
🌊 SOLUSDT.P: SOL's Dip - Your Opportunity
🐸 1000PEPEUSDT.P: Prime Bounce Zone Unlocked
🚀 ETHUSDT.P: Set to Explode - Don't Miss This Game Changer
🤖 IQUSDT: Smart Plan
⚡️ PONDUSDT: A Trade Not Taken Is Better Than a Losing One
💼 STMXUSDT: 2 Buying Areas
🐢 TURBOUSDT: Buy Zones and Buyer Presence
🌍 ICPUSDT.P: Massive Upside Potential | Check the Trade Update For Seeing Results
🟠 IDEXUSDT: Spot Buy Area | %26 Profit if You Trade with MSB
📌 USUALUSDT: Buyers Are Active + %70 Profit in Total
🌟 FORTHUSDT: Sniper Entry +%26 Reaction
🐳 QKCUSDT: Sniper Entry +%57 Reaction
📊 BTC.D: Retest of Key Area Highly Likely
📊 XNOUSDT %80 Reaction with a Simple Blue Box!
📊 BELUSDT Amazing %120 Reaction!
📊 Simple Red Box, Extraordinary Results
📊 TIAUSDT | Still No Buyers—Maintaining a Bearish Outlook
📊 OGNUSDT | One of Today’s Highest Volume Gainers – +32.44%
I stopped adding to the list because it's kinda tiring to add 5-10 charts in every move but you can check my profile and see that it goes on..
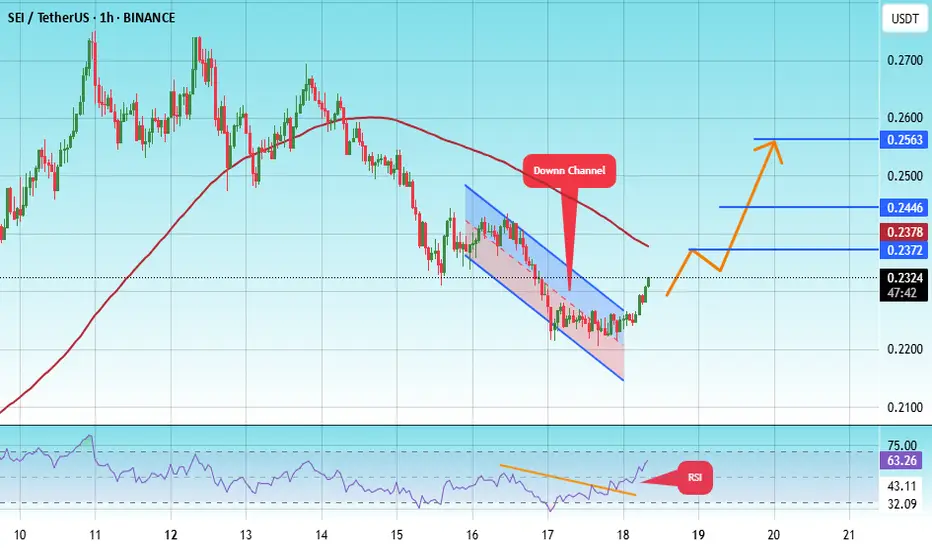
#SEI/USDT#SEI
The price is moving within a descending channel on the 1-hour frame, adhering well to it, and is heading for a strong breakout and retest.
We are seeing a bounce from the lower boundary of the descending channel, which is support at 0.2095.
We have a downtrend on the RSI indicator that is about to break and retest, supporting the upward trend.
We are looking for stability above the 100 Moving Average.
Entry price: 0.2249
First target: 0.2423
Second target: 0.2423
Third target: 0.2538
#SEI/USDT#SEI
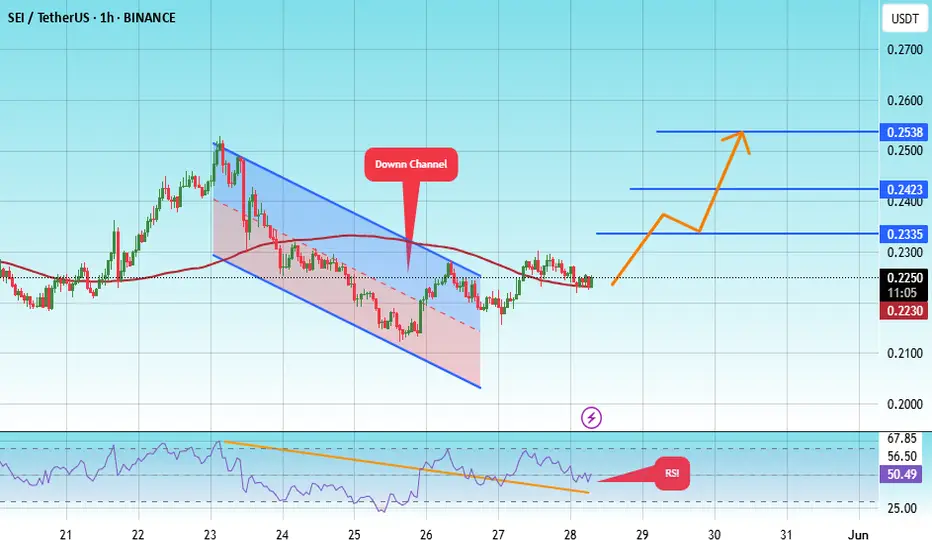
The price is moving within a descending channel on the 1-hour frame, adhering well to it, and is on its way to breaking it strongly upwards and retesting it.
We are seeing a bounce from the lower boundary of the descending channel, which is support at 0.2170.
We have a downtrend on the RSI indicator that is about to break and retest, supporting the upward trend.
We are looking for stability above the 100 moving average.
Entry price: 0.2310
First target: 0.2372
Second target: 0.2446
Third target: 0.2563
#SEI/USDT#SEI
The price is moving within a descending channel on the 1-hour frame, adhering well to it, and is heading towards a strong breakout and retest.
We are seeing a bounce from the lower boundary of the descending channel, which is support at 0.2550.
We have a downtrend on the RSI indicator that is about to be broken and retested, which supports the upward trend.
We are looking for stability above the 100 Moving Average.
Entry price: 0.2579
First target: 0.2626
Second target: 0.2681
Third target: 0.2750

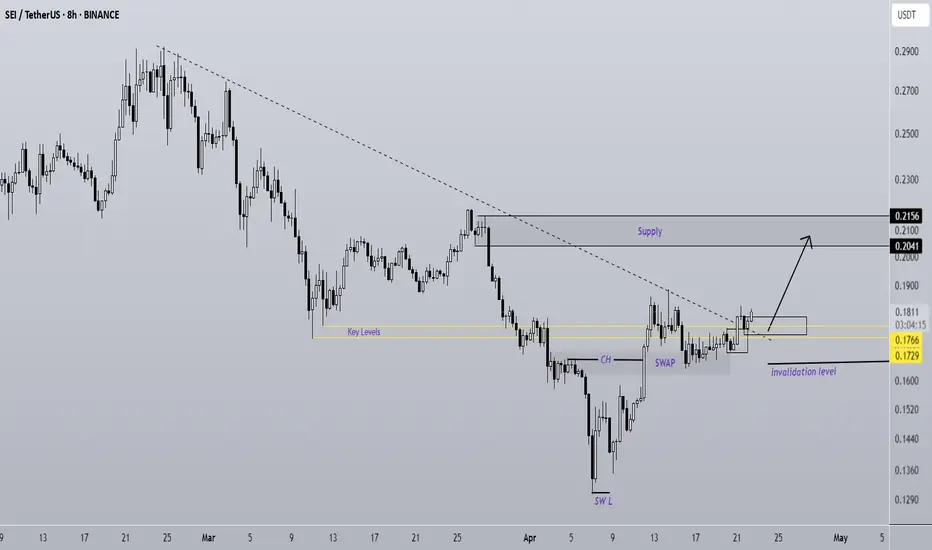
SEI Is A Rocket (8H)SEI has started a strong move from the bottom.
After breaking through a resistance zone with little to no reaction, it has now formed a SWAP zone.
Buy orders have been effectively transferred from the SWAP area into the candles, and the price shows strong momentum to push toward higher levels.
As long as the demand zone holds, SEI has the potential to reach the marked target area | or even go beyond it.
However, a daily candle closing below the invalidation level would invalidate this analysis.
Do not enter the position without capital management and stop setting
Comment if you have any questions
thank you