SEI Bulls Target 38% Gains — Are You In?📈 SEI/USDT – 4-Hour Chart Technical Analysis
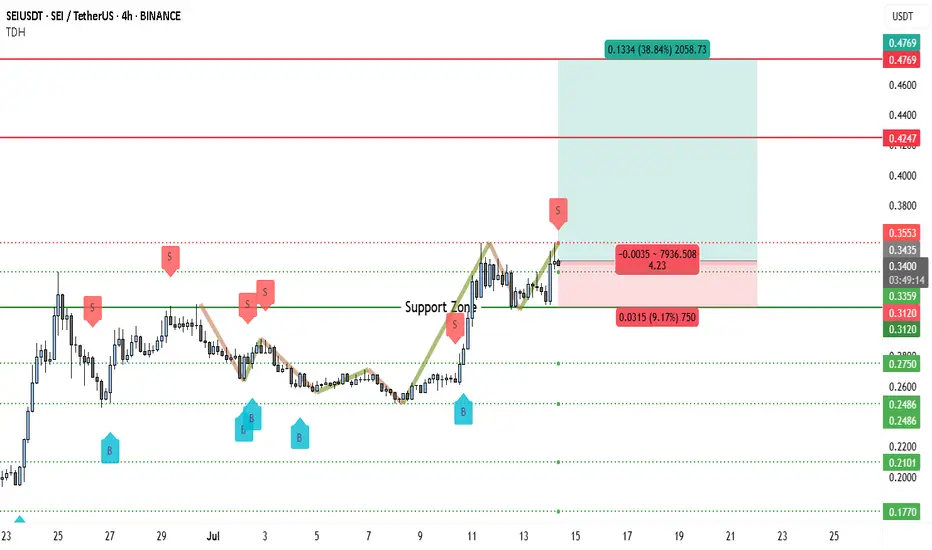
SEI has developed a constructive bullish pattern on the 4-hour chart. After a prolonged sideways phase, price broke out of the consolidation range and climbed above the prior swing high around $0.3359, now sitting just under the critical resistance near $0.3435.
This region has been tested multiple times historically, with clear rejection wicks and prior sell pressure, marking it as an important threshold. The recent breakout momentum suggests buyers are gaining confidence, especially after the sharp impulse from the $0.3120 support zone.
If the market holds this level on a closing basis and confirms with some follow-through volume, the setup remains primed for further upside.
Even if a retracement occurs back toward $0.3120, the overall structure stays bullish while price trades above $0.2750, which has been the broader accumulation range for several weeks.
________________________________________
🟢 Trade Setup Summary
Entry Zone: $0.3359–$0.3435 (on breakout confirmation)
Stop Loss: Just below $0.3120 support
Target 1 (TP1): $0.3553 – Initial reaction zone
Target 2 (TP2): $0.4247 – Mid-term resistance
Target 3 (TP3): $0.4769 – Extended target
Risk: Approx. 9.17% downside if invalidated
Reward Potential: Up to 38.84% upside if the extended target is reached
Risk-Reward Ratio: ~4.23
________________________________________
From a broader perspective, this is a well-balanced setup with a tight invalidation point and clear upside roadmap. As long as the price continues to respect the $0.3120 floor, any short-term pullbacks can also be considered for spot reaccumulation or DCA entries.
Should the market push through $0.3435 with strong momentum, SEI will likely test the $0.3553 area quickly, followed by attempts to reclaim the higher ranges near $0.42–$0.47 over the coming sessions.
Let me know if you’d like to refine this further or prepare a version for publication or sharing with your community. 🚀
Seilongsetup
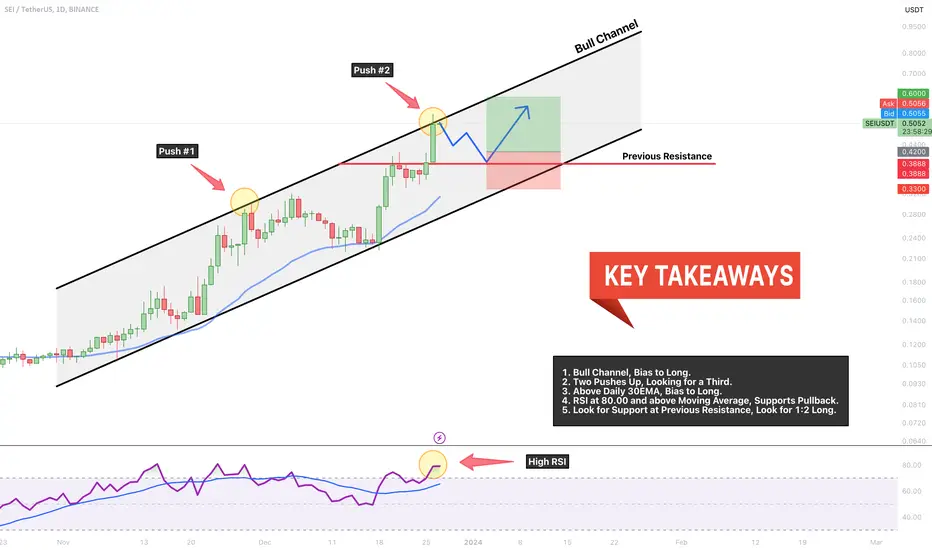
SEI → 400% Long in Under 2 Months! More to Come!? Let's Answer.SEI has been one of the top movers in the crypto market in the last 30 days and by looking at this chart, you can see why. A 400% move to the upside in the last 47 days! Is there any more steam left on the train?
How do we trade this? 🤔
Strong push to the resistance line, looks to be the end of the second leg up, RSI is very high at 80.00 and above the Moving Average, we need to wait for a pullback. The crypto market is at a crucial point where a reversal is possible. We need to wait for a pullback on this chart to the channel support around $0.40 and get confirmation of a continuation with a buy signal.
At that time, it's reasonable to long for a third leg in the channel up to the $0.60 price area. It's also reasonable to take half profits at 1:1 for a third leg in a trend, then move the stop loss up to your entry price to secure profits. Your position size should also be smaller since we're later in the trend, the probability is now less that the trend will continue and your risk needs to be sized proportionally.
💡 Trade Idea 💡
Long Entry: $0.42
🟥 Stop Loss: $0.33
✅ Take Profit: $0.60
⚖️ Risk/Reward Ratio: 1:2
🔑 Key Takeaways 🔑
1. Bull Channel, Bias to Long.
2. Two Pushes Up, Looking for a Third.
3. Above Daily 30EMA, Bias to Long.
4. RSI at 80.00 and above Moving Average, Supports Pullback.
5. Look for Support at Previous Resistance, Look for 1:2 Long.
💰 Trading Tip 💰
The probability that the trend will continue weakens toward the end of it. Trends typically have three defined legs and while they can have more, it's reasonable to assume the probability of a continuation is lower at this stage. This means your position size should be lower to account for that decreased probability.
⚠️ Risk Warning! ⚠️
Past performance is not necessarily indicative of future results. You are solely responsible for your trades. Trade at your own risk!
Like 👍 and comment if you found this analysis useful!