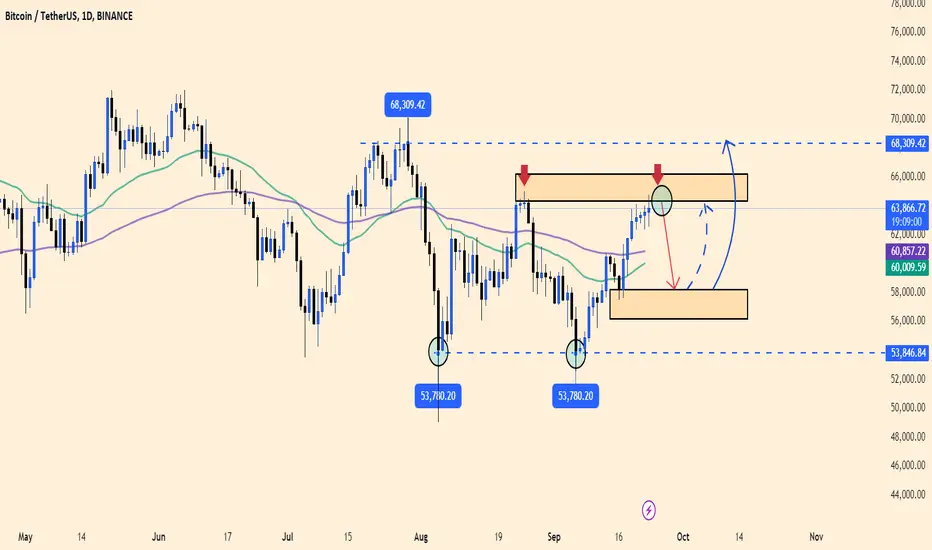
BTCUSDT Trend Strategy and Review.BTCUSDT is currently in recovery mode, gaining upward momentum from the support level of $53,780. As it approaches a key resistance zone, there's a possibility it might form a double top pattern. However, given the current market conditions and technical indicators, I’m anticipating a price rebound with a target of $68,300.
My short-term strategy is to sell, while my long-term play is to buy.
What’s your take? Drop a comment and let me know your thoughts!
Sell-buy
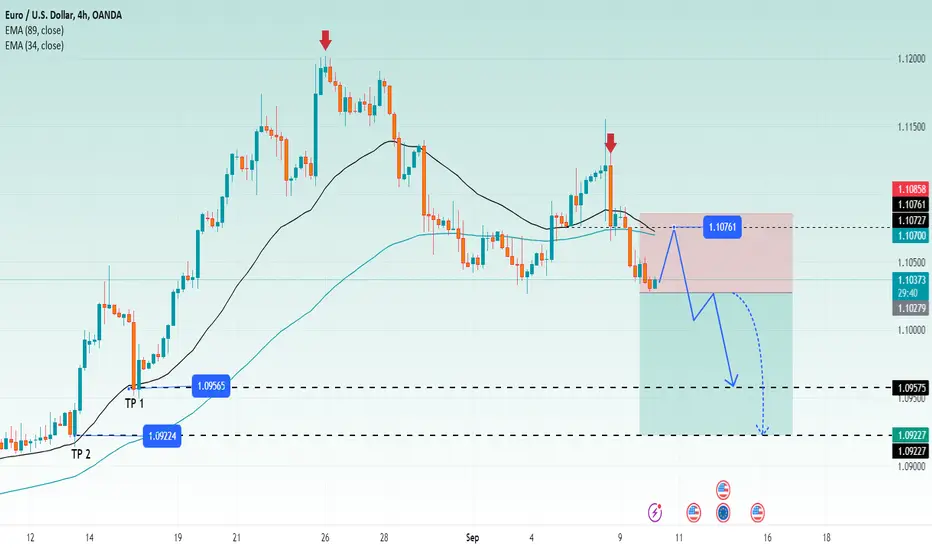
EUR/USD declines due to expectations of an ECB rate cut.The Euro dropped 0.44% on Monday, continuing its downward trend after breaking the 1.1100 support level. Expectations of an ECB rate cut on September 12 have weighed on EUR/USD.
As shown on the chart, the EMA 34 is confluent with resistance at 1.10761, so traders may consider selling when the price reaches this resistance area. Additionally, the break of support further confirms the strength of the bearish side.
Therefore, I suggest taking profits at TP 1 around 1.09565 and TP 2 at 1.09224.
Traders should monitor further economic events and price action at critical support levels to determine the next trend.
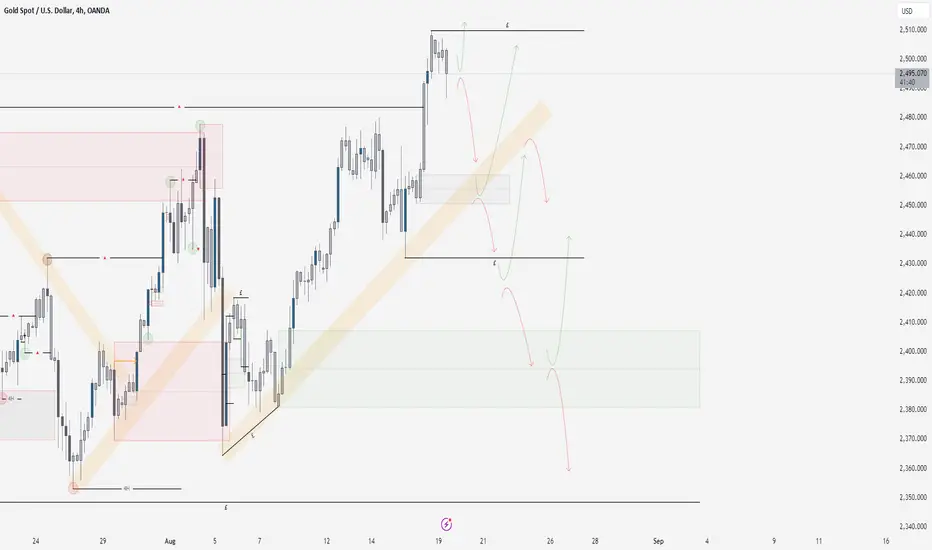
XAUUSD 19/8/24Our gold chart this week shows that price action is moving to the upside, as we expected. We reached our high time frame target from last week, which was a new all-time high for gold. We’re now looking for price action to create significant liquidity to the upside to push for another all-time high. If a pullback occurs and price moves lower, we will begin focusing on the current trajectory, which could lead us into the highlighted areas of demand below. One area is within the lower 50% of the current short-term range, and the other is within the lower 50% of our overall swing range. If price hits these areas and pushes higher, we will, of course, look for overall longs to continue with the higher time frame trend. We expect the trend to continue with relative strength, but if a sell-off starts, we can look at the areas of supply left behind. If the current trajectory breaks, there is potential for a short-term sell-off, but we remain overall bullish on this pair. Please note that we only have one high time frame target for now, as gold is at a new all-time high.
If price begins to sell off, don’t become attached to your bias. Remember, the higher time frame is bullish. Trade safely, stick to your risk management, and follow your rules.
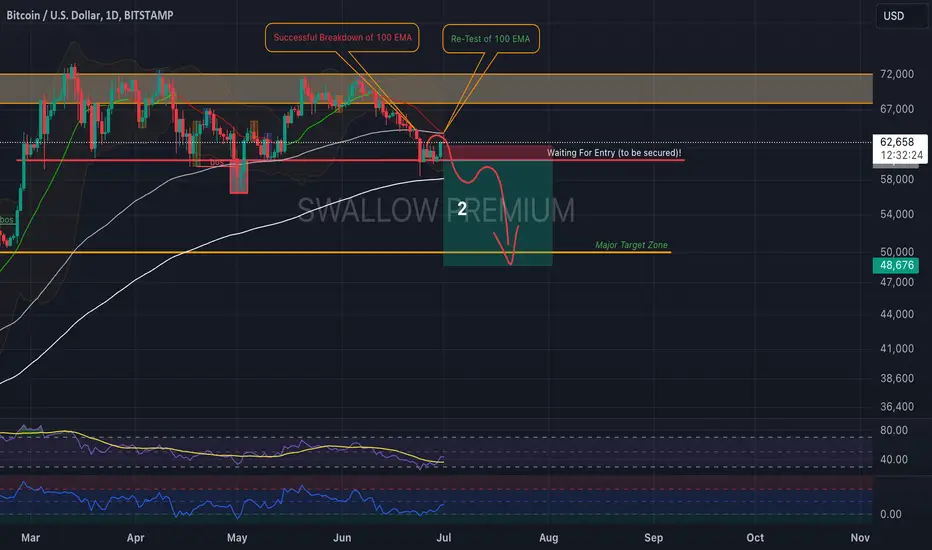
Bitcoin (BTC): Will Crash Soon!The new week is here and bitcoin has successfully re-tested the 100EMA line, which was broken on June 23rd.
As we see a new daily candle (which is also an opening day for the week + month), we are seeing a nice rejection from 100EMA so far, which is working rather well.
We are waiting to see a re-test of local lows at the $60K zone and a movement to lower zones touching that 200EMA and breaking it as well!
Swallow Team
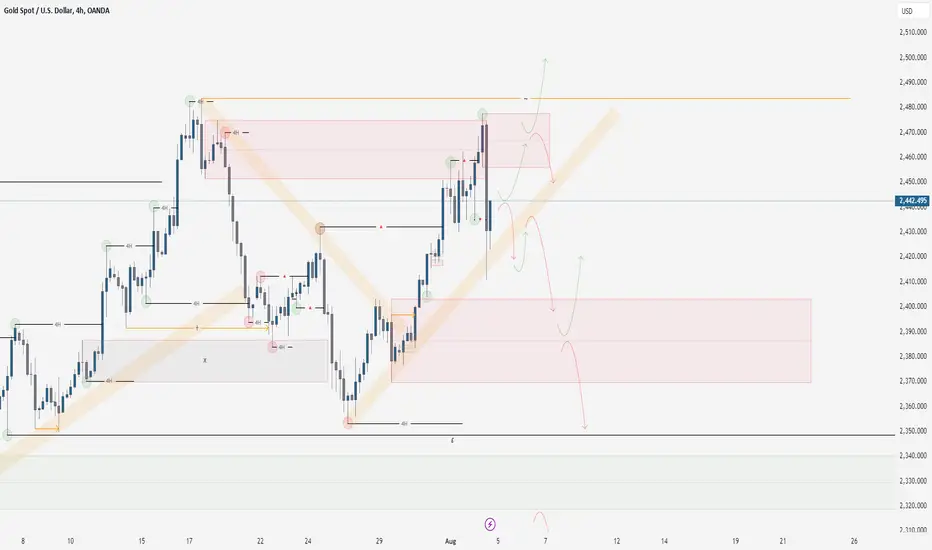
XAUUSD 4/8/24This week in gold, we have the potential for another sell-off through trendline liquidity, as we’ve seen before. However, all price action is trending upwards, making this our main scenario. As shown on our chart, we have a liquid high that is close to the current price, with liquidity built up below the lows.
We know that on a high timeframe, we are strongly bullish. The price tested last week’s high and then fell significantly, indicating a potential pullback before the high is taken. Key points to note include the heavy sell-off from the supply area, leaving an untapped supply zone, and creating the first sell-side imbalance during the upward trend. This suggests a chance for price to hold and potentially drop below the trendline mark. If this occurs, we will look towards the demand area shown on the chart in red. We will monitor this area to see if it pushes the price back into the higher timeframe trade alignment or fails, leading to a sell-off and a change in our bias on the given timeframe.
If the bullish trend continues, we will monitor the supply area above the current price, expecting it to fail. If it does, we may see a new all-time high for gold. Overall, the price is bullish, so a fallback would be preferable if we aim to take buys from this price section.
Watch the trendline liquidity being created below the untapped supply area and the liquid high just above it. Also, if the trendline breaks, watch the demand area to see if it goes higher within our range.
Trade safely, stick to your risk management, and follow your plan.
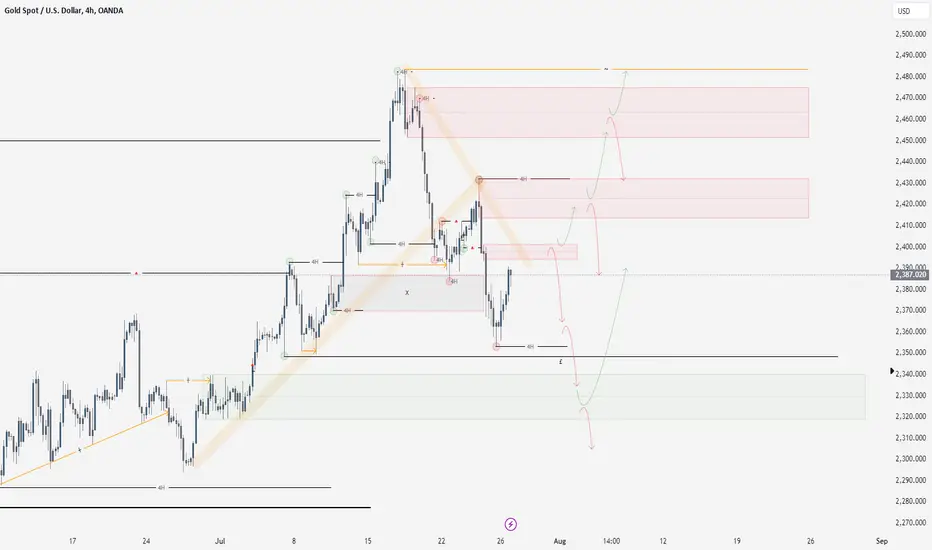
XAUUSD 28/7/24This week, we are looking at some great potential moves in gold. At first glance, it may seem like we have no plans to buy, but we have a much stronger bias for long positions than short ones. The key point is that until we have a clear structural narrative, we simply follow what we see, which currently indicates short moves.
We have a clear sign of momentum on the daily timeframe, leading us to think the pullback could continue and go lower into some more key areas. In terms of price moving lower from its current position, we have identified some clean-cut zones of supply to watch. These zones are marked out above the current price. The first zone is the candle responsible for the run of the last major low and the order block that caused a minor reaction, ultimately inducing buys into failing positions.
You can see the trend line we have highlighted, indicating the current trajectory for price action. If this trajectory continues, the higher areas of supply might not be tapped into. However, we are looking for a longer move here if the price allows it. Watch the zones above if the price starts to rise.
My main move to watch is running the liquidity low above our demand zone and then shifting up, giving us a clear bullish move into the daily high liquidity target. If we turn bullish, this target will be taken. Until we hit either the supply or demand zones, we have nothing to do except wait.
Trade safe and follow your rules.
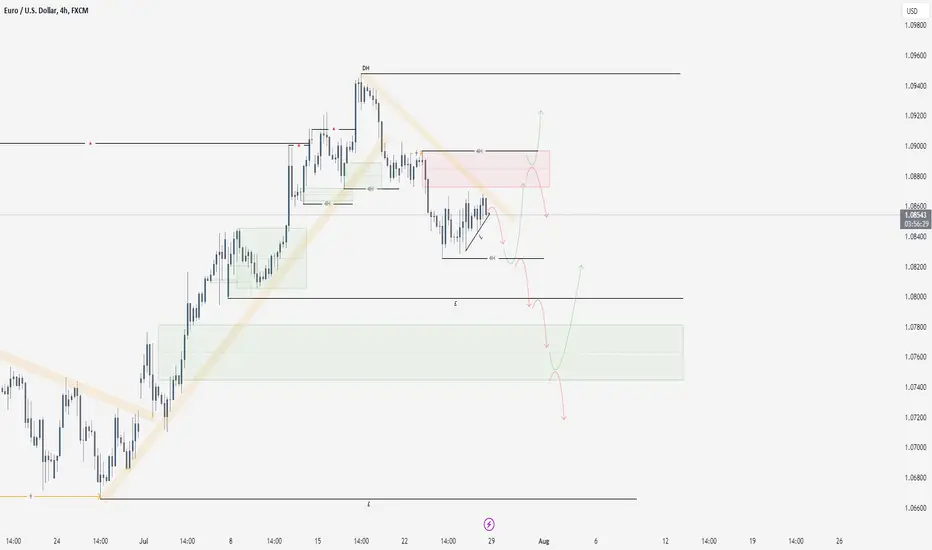
EURUSD 28/7/24This week in the EU, we are looking to meet a couple of key points. Overall, we are focusing on the price shifting back into the bearish higher timeframe trend. Currently, the price has been moving lower. We opened up a gap on the daily timeframe, indicating a likely drop. Since then, we have moved lower and created short-term liquidity lows, suggesting the price will sweep out these levels and continue its downward movement.
The key points we want to see met this week are as follows:
1. Price to sweep out one of our short-term highs and create a BOS (Break of Structure) downwards, giving us a clean sweep and break move.
2. We have an area of supply that we may tap into. If we reach this high, it would be ideal for short moves and selling positions.
3. If we tap into this supply and break higher, I will look for the daily high to be reached.
We are more inclined to see a sell move to follow the higher timeframe trend. The target for this short move is the demand zone marked in green and the liquidity low marked just above that zone. Ideally, this zone will fail, and the price will move lower. However, we may react at this zone and go higher. We will follow what the price shows us!
Follow your rules and stick to your plan!
Trade safe.
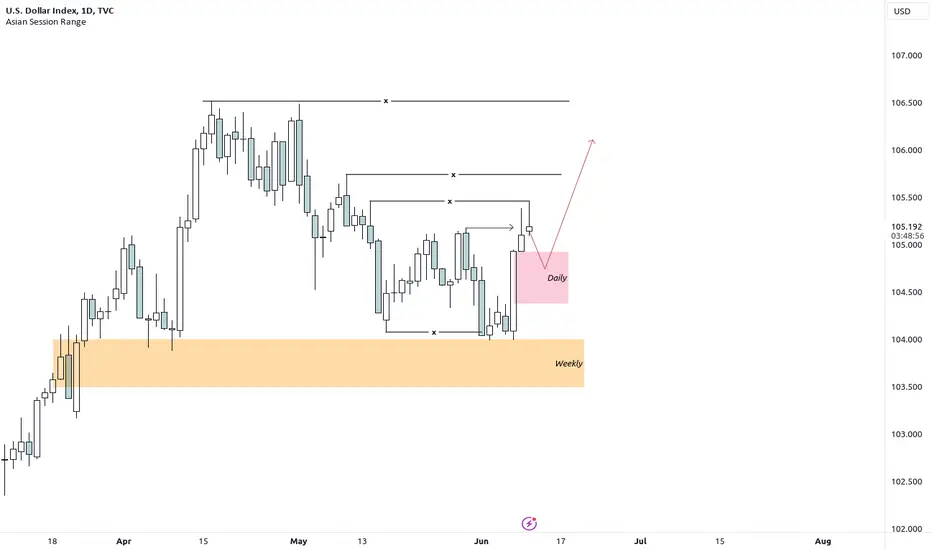
Bullish DXYMonthly:
1. Direction:
Bullish
2. Reasons:
1. price took buy side LQ
2. A good Displacement
3. price coming for sell side LQ
Weekly:
1. Direction:
Bullish
2. Reasons:
1. price respected the weekly FVG
2. a good displacement
Daily:
1. Direction:
Bullish
2. Reasons:
1. good FVGs created.
2. Good displacement candle
3. BOS to the up side
4H:
Doesn't look clean.
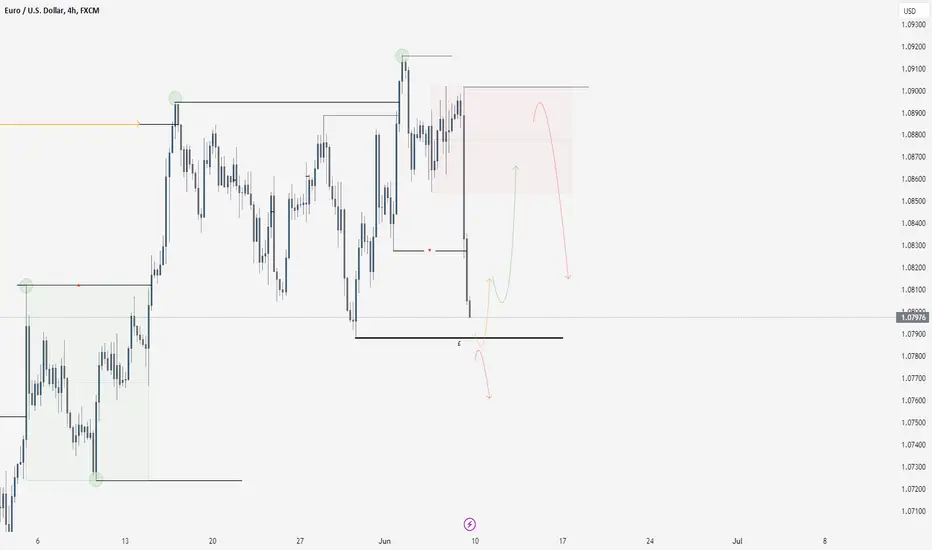
EURUSD 9/6/24Starting things off with euro to the USD this pair has finally shifted bearish into the higher time for a narrative we have mentioned so many times over the last fortnight. This means for us this week we are predominantly focusing on bearish movements, as it stands we have an nfp range this is the overall range responsible for shifting us bearish, Within the 4 hour time frame we still have no low of this range.
Because of this we are still waiting for this range to form properly before we begin to interpret the appropriate point to enter. But as always we have an idea of what we would like to see which is the following. A price pulling back after either liquidating the nearest low or forming a low above this point, Then pulling back to the area of unmitigated supply that we have highlighted above this. for us this is the ideal area to sell from it sits above 50 percent of this range and it also is the area responsible for breaking our major structural point down.
As we head into this week we are going to be waiting for this range to form properly before we begin to formulate sell or buy setups.
What we have shown and spoke about here is our overall main idea so we will wait for this to start playing out and give the principal some fluidity.
Wishing you all the best trading week and remember to reprice trade with appropriate risk and always use a stop loss.
BABA Alibaba Group Holding Limited Options Ahead of EarningsIf you haven`t bought BABA before the previous earnings:
Then analyzing the options chain and the chart patterns of BABA Alibaba Group Holding Limited prior to the earnings report this week,
I would consider purchasing the 110usd strike price Calls with
an expiration date of 2025-1-17,
for a premium of approximately $2.74.
If these options prove to be profitable prior to the earnings release, I would sell at least half of them.

QQQ Double Top on Bearish DivergenceIf you haven`t bought the dip on QQQ:
Then it's important to understand that it's currently exhibiting a double top formation, known as one of the most bearish chart patterns, along with a substantial bearish divergence. I foresee a retracement soon, possibly to $416, but I still expect it to finish the year on a positive note!

Technical Analysis: EURUSD potential Double Bottom EURUSD is looking quite bearish right now. Many of our Indicators are showing signs the price may continue to drop for a few days.
Our Sell Momentum has yet to end and our Momentum and Fear & Greed Index oscillators are only showing Bearish sell pressure on this current bar. This means that the price could pull back out of this dump and continue upwards; only time will tell. However, it’s not looking good in the short term.
EURUSD’s overall trend is downwards and it looks like it may test its current bottom quite soon. This could be a great thing for bullish price movement if it only touches the bottom pivot and doesn’t crash through; as it would signify a double bottom.
We will conclude with, EURUSD is looking quite bearish in the short term with strong bullish potential if the double bottom occurs.
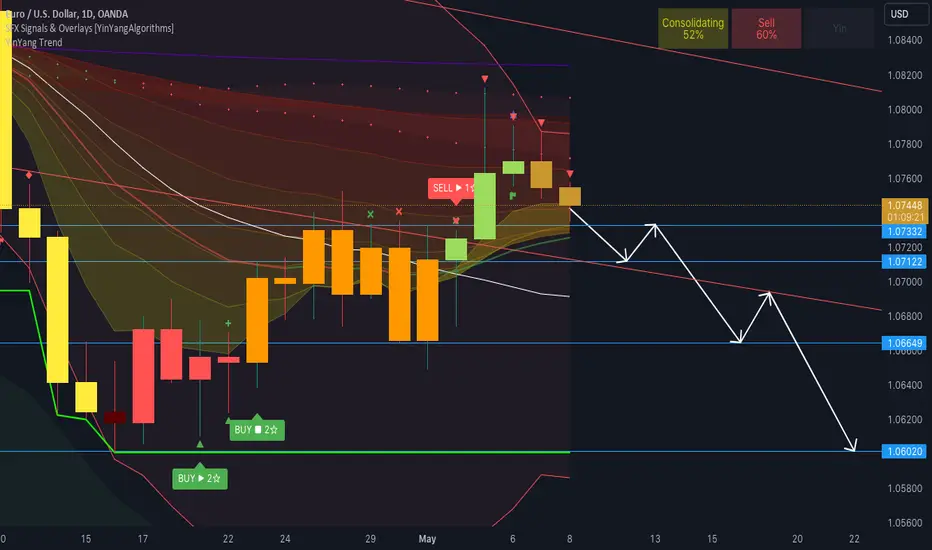
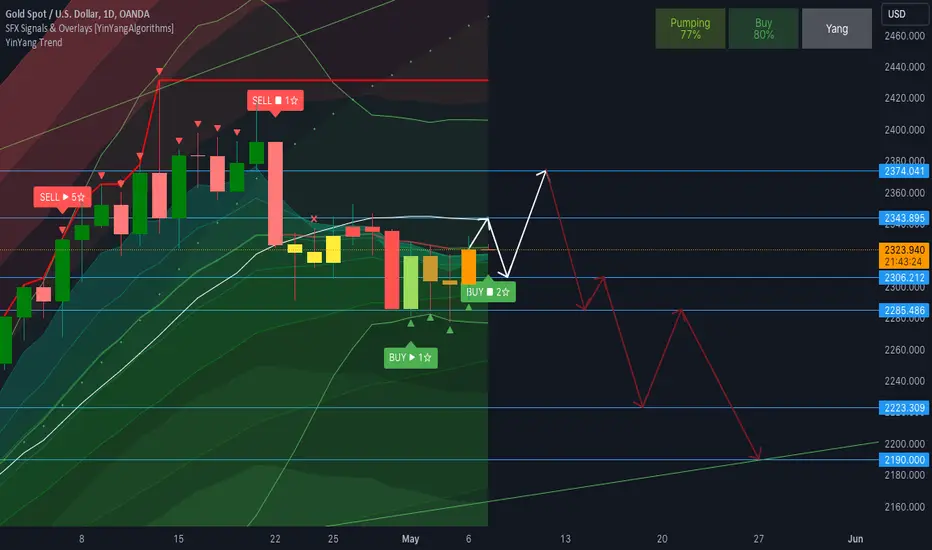
GOLD - Bearish Correction Incoming!Gold / XAUUSD has potential for a small bullish pump over the next few days; followed by a bearish correction.
We have some Buy Signal Momentum currently going; it hasn't ended yet but this current bar is displaying it; this implies now is still considered to be a good time to buy but may not be tomorrow! The buy rating started at 1☆ and is closing at a 2☆; this may imply a push back to the $2474 region.
Gold has consolidated for quite awhile meaning that it's RSI has had some time to cool down and is now relatively neutral at 55; however our YinYang RSI is still saying quite overvalued and that a dump is underway.
Conclusion: A small pump may occur over the next few days; however we don't think this is long term. We believe Gold may get rejected ~2474 and continue in a downtrend towards the 2190 region.
XAUUSD 5/5/24Gold be in our second pair for this week we have a bearish range on the higher timeframe, collectively we know that gold is bullish as a whole but we have formed some bearish structure so we're going to follow that narrative and you can see by our markup we have three areas to watch, Based on this I am looking at the range that we established last week on the lower time frame this giving us our point of reference for what move is most likely. you can see the two points I have highlighted with our black lines showing you the high and the low, i'm looking for this range to be broken out either to the upside to give us a shift up into the daily order block marked with the red line above or I'm looking for price to breakdown lower for then a push to the upside to have them later on. The main thing to consider here is how price behaves when it gets either to the high or the low of the smaller time frame range we still have possibilities to break out of the range to the upside and then continue down when we meet the higher time frame structural high but if we do not we will look for buys and essentially we will just follow price action as we do every week!
Remember trade what you see trade your plan and always use appropriate risk!
wishing you all the best trading week!
TMUS T-Mobile US Options Ahead of EarningsIf you haven`t bought TMUS before the previous earnings:
Then analyzing the options chain and the chart patterns of TMUS T-Mobile US prior to the earnings report this week,
I would consider purchasing the 155usd strike price Puts with
an expiration date of 2024-11-15,
for a premium of approximately $4.30.
If these options prove to be profitable prior to the earnings release, I would sell at least half of them.

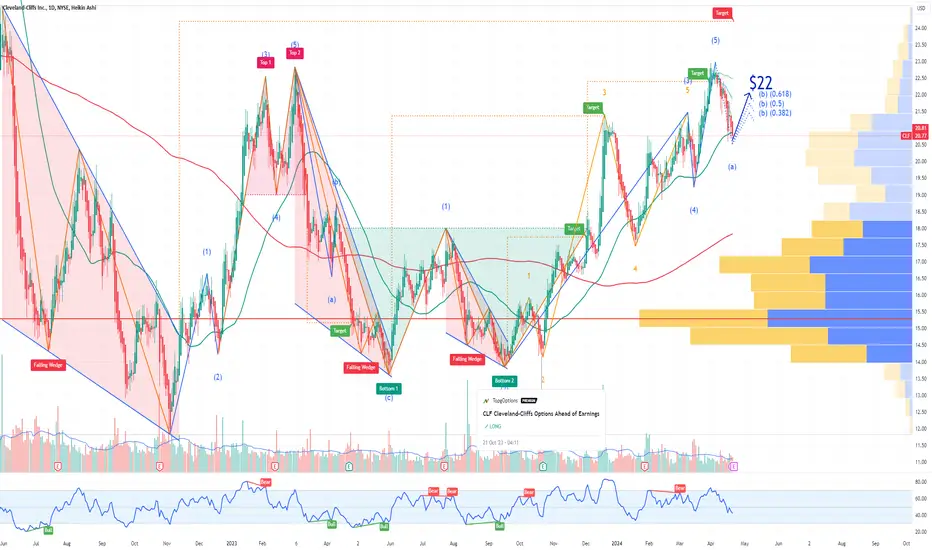
CLF Cleveland-Cliffs Options Ahead of EarningsIf you haven`t bought the dip on CLF:
Then analyzing the options chain and the chart patterns of CLF Cleveland-Cliffs prior to the earnings report this week,
I would consider purchasing the 22usd strike price Calls with
an expiration date of 2025-1-17,
for a premium of approximately $2.93
If these options prove to be profitable prior to the earnings release, I would sell at least half of them.
NVDA Nvidia Double Top If you haven`t bought NVDA before the previous earnings:
Then it's important to note that technically, we're currently in a double top formation, which is one of the most bearish chart patterns. While I anticipate NVDA to rise by the year's end, it appears bearish for the next month.

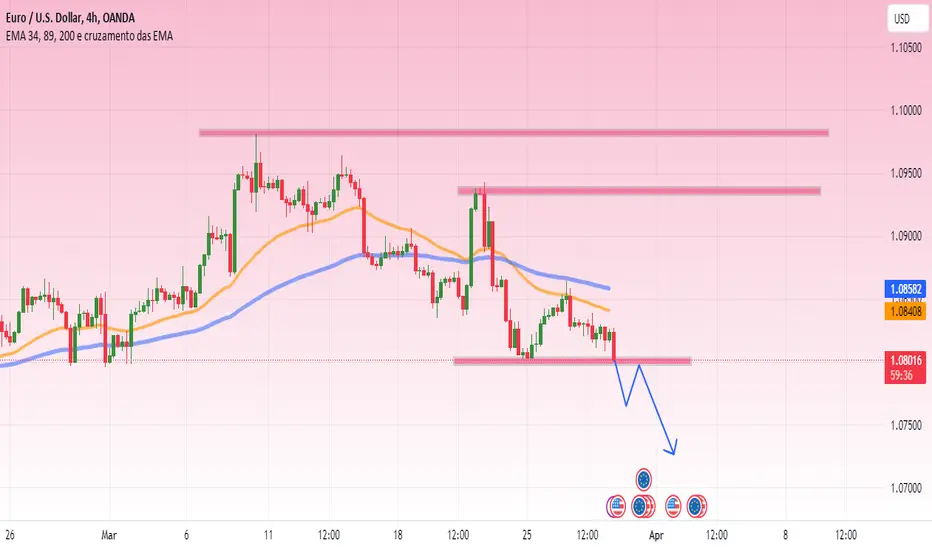
Euro will decrease after breaking the 1.08031 thresholdThe Euro is predicted to encounter resistance levels early at its highest point of 1.0981, followed by 1.0936.
However, looking at the chart, it is observed that the EMA 34 has crossed below the EMA 89, indicating a downward trend in the Euro and the likelihood of breaking through the support zone at 1.08031 and heading straight downward.
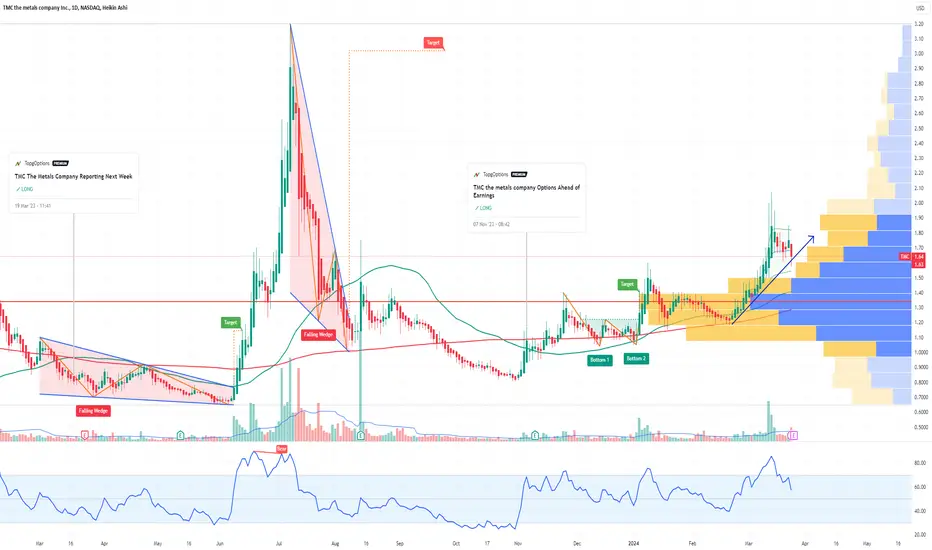
TMC the metals company Options Ahead of EarningsIf you haven`t bought TMC before the previous earnings:
Then analyzing the options chain and the chart patterns of TMC the metals company prior to the earnings report this week,
I would consider purchasing the 1.50usd strike price in the money Calls with
an expiration date of 2024-4-19,
for a premium of approximately $0.27.
If these options prove to be profitable prior to the earnings release, I would sell at least half of them.
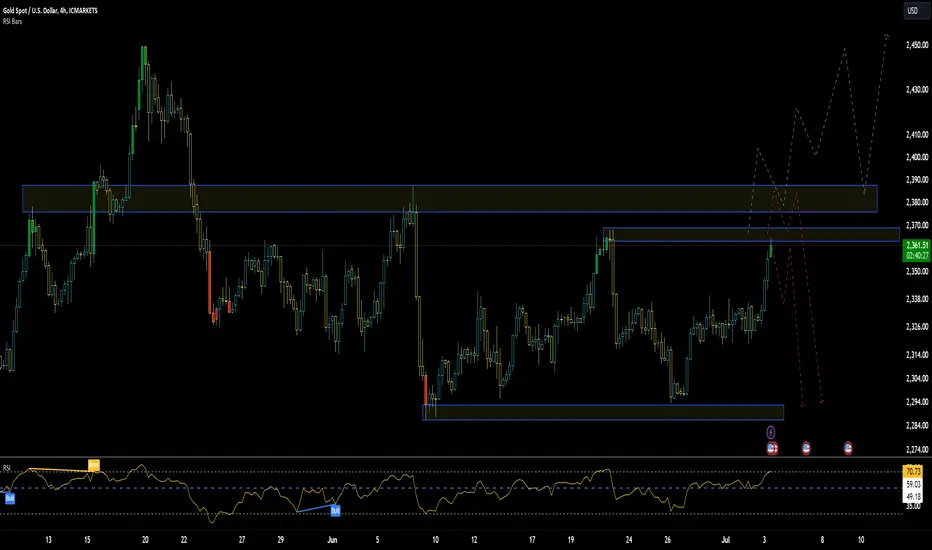
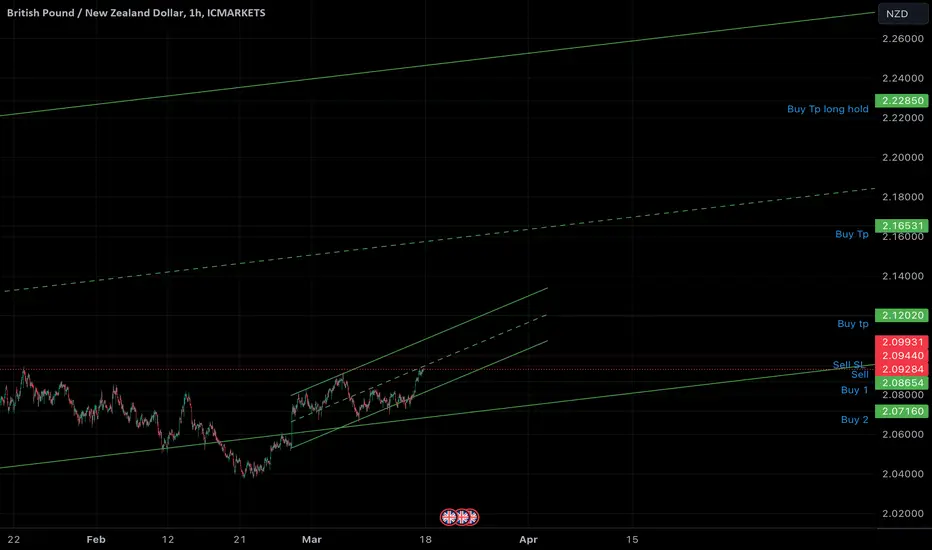
Short Term Sell (Provided that price doesn’t carry on up from current level)
Short term SELL should pull price pullback to BUY levels
Before reaching Buy TP’s
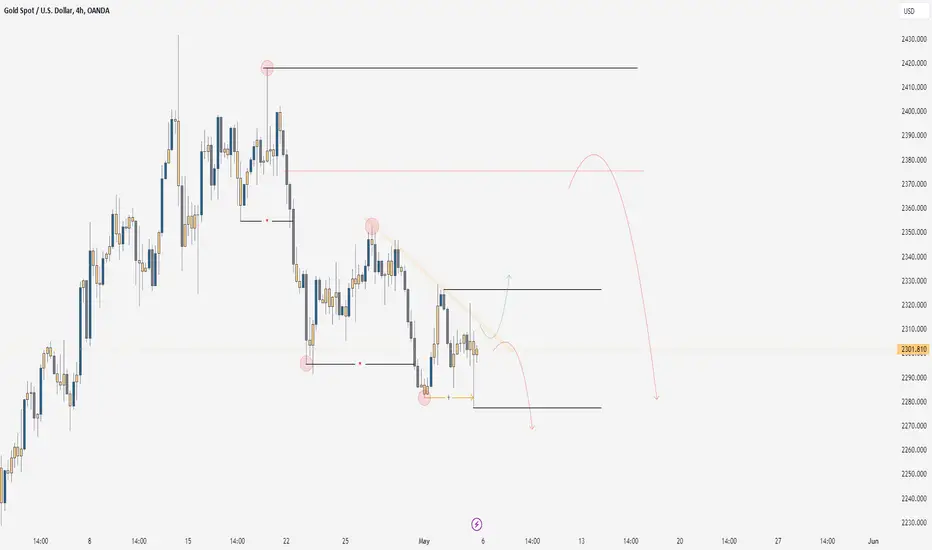
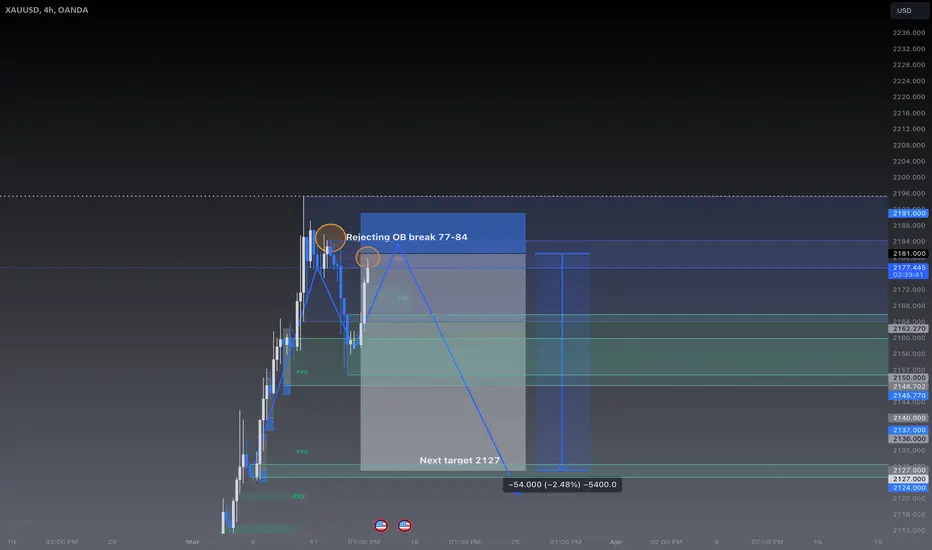
Possible SELL off zone XAUUSDGolds moved crazy in recent weeks. Currently watching for some sort of pullback.
Although ATH has been created, with the slowing strength of the dollar we may see some correction on gold through the rest of March.
I would like to target some sells back down to this corrective level, I predict that current area and the OB present may be a good time to sell.
A nice 1:5RR with 1% risk will be ideal, something I will confirm with in soon date.
Cheers
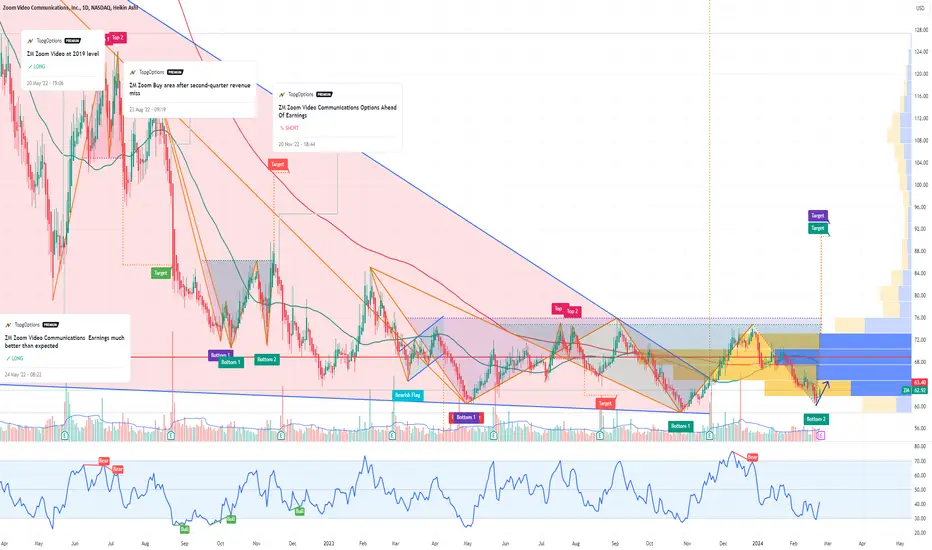
ZM Zoom Video Communications Options Ahead of Earnings If you haven`t sold ZM before the previous earnings:
Then analyzing the options chain and the chart patterns of ZM Zoom Video Communications prior to the earnings report this week,
I would consider purchasing the 61usd strike price in the money Calls with
an expiration date of 2024-3-1,
for a premium of approximately $3.95.
If these options prove to be profitable prior to the earnings release, I would sell at least half of them.