EURUSD – Healthy pullback within a strong uptrendEURUSD is undergoing a temporary correction after a strong bullish move, but the pair remains above key technical support levels such as the EMA34 and the ascending trendline. The 1.15070 zone now acts as a potential buy area—where demand may return if confirmation signals appear.
Market sentiment is leaning toward the expectation that the Fed may cut interest rates soon due to weaker-than-expected U.S. retail sales data, which has weighed on the USD and indirectly supported the euro. Meanwhile, the ECB continues to maintain a stable policy stance, further reinforcing the current bullish trend.
If the price holds above the green support zone, the next target could be around 1.15940. If this support breaks, traders should watch price behavior at the trendline before making the next trading decision.
Sell-buy
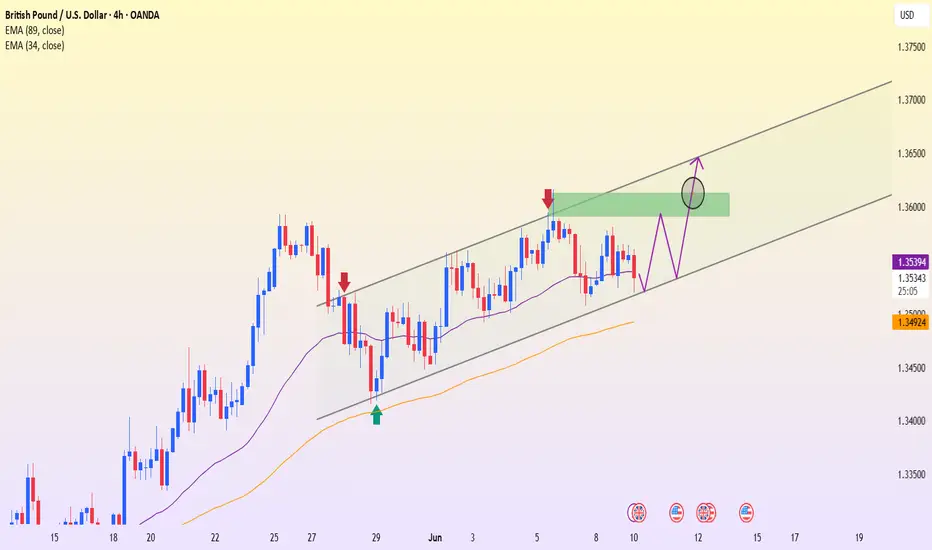
GBPUSD – Holding the Uptrend, Eyeing Resistance BreakoutThe GBPUSD pair continues to respect a well-defined ascending channel on the H4 chart. Each time price retraces to the lower boundary, buying pressure has consistently stepped in. Currently, price is hovering near the channel’s lower edge and the EMA89 – forming a technical support area around 1.35370. If this zone holds, there is a strong potential for a rebound toward the resistance zone near 1.36100–1.36300, which has rejected price twice before.
From a news perspective, markets are awaiting the U.S. CPI report tomorrow. If inflation data comes in weaker, expectations for the Fed to cut interest rates will increase, putting pressure on the USD and allowing GBP to extend gains. Additionally, the Bank of England is expected to maintain a more hawkish stance due to persistent domestic inflation – which further supports the pound’s upward momentum.
Watching the EMA and lower channel boundary is key. If a clear bullish signal forms at this zone, a trend-following long strategy could carry a high probability of success.
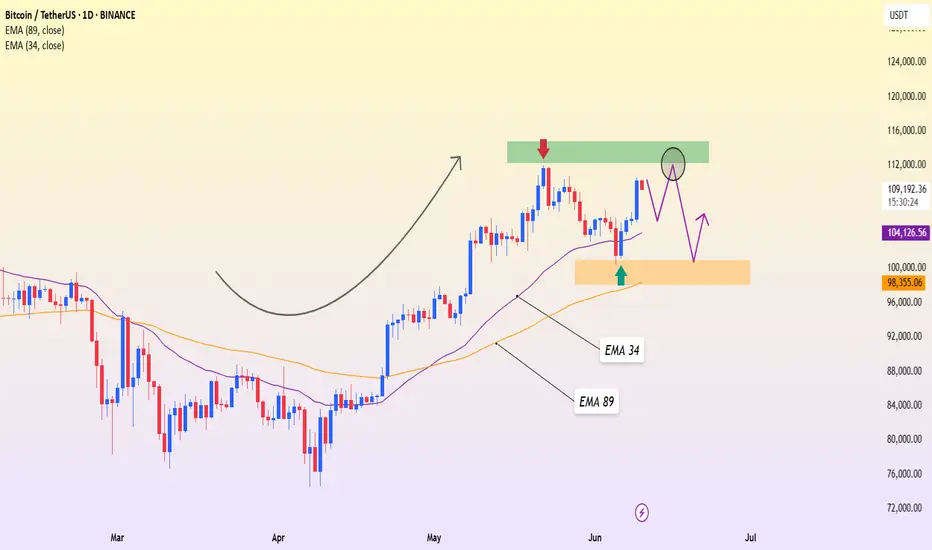
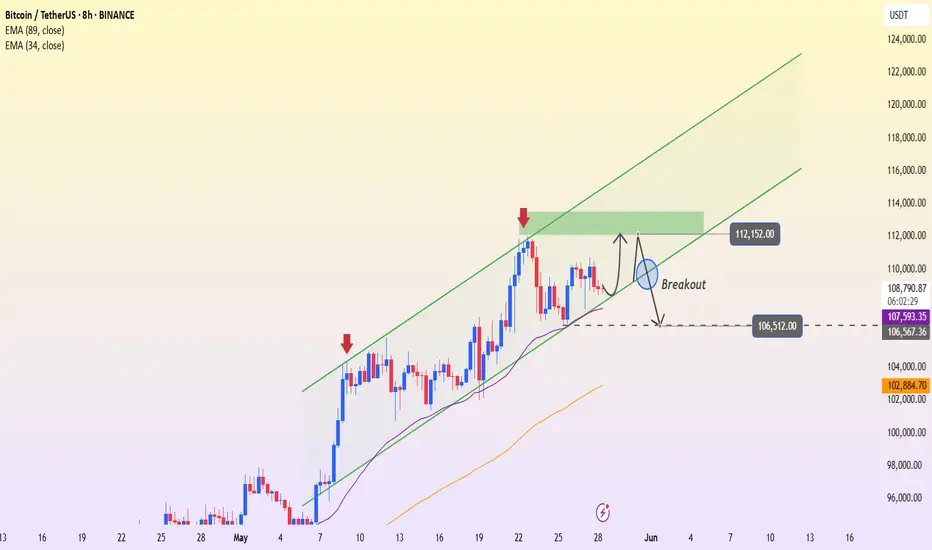
BTCUSDT – Uptrend Intact, Resistance Still in PlayBitcoin is currently moving within a healthy uptrend, showing a strong rebound from the 101,332 USDT support zone—aligned with the EMA 89 on the daily chart. Following an impressive recovery, the price is now approaching the 111,892 resistance area, which previously halted the bullish momentum and triggered a deep correction.
However, recent price action shows signs of stalling, suggesting a possible consolidation phase. If BTC fails to break above 111,892, a mild pullback toward the 104,000–101,000 zone may occur to build fresh momentum for the next bullish leg.
From a news perspective, the crypto market is buoyed by improving sentiment after weak U.S. job data, increasing the odds of an earlier-than-expected Fed rate cut. Additionally, continued capital inflows into Bitcoin ETFs are supporting medium-term upside potential for BTC.
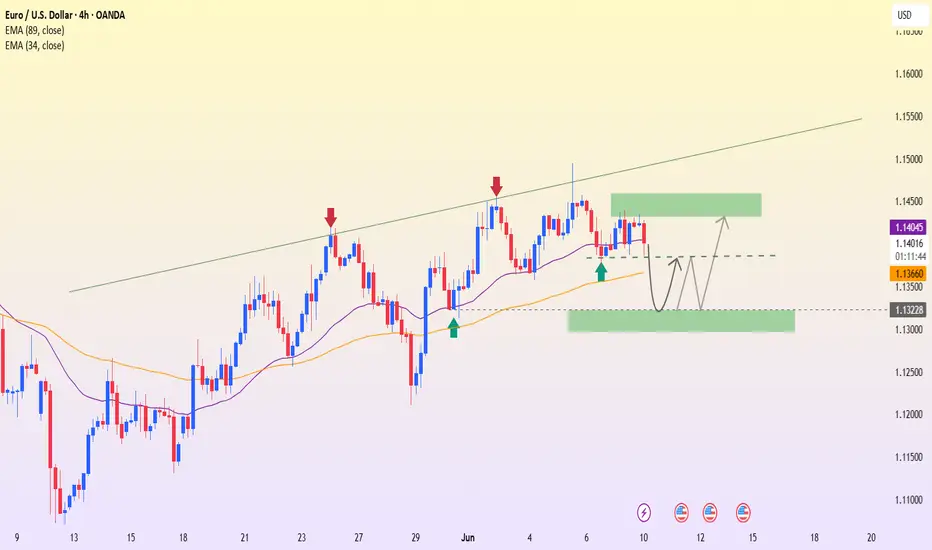
EURUSD – Still a chance to rebound if support holdsEURUSD has recently pulled back slightly after approaching resistance near the rising trendline. Currently, price is heading back to retest the support zone around 1.13200 – a key confluence area with the EMA89 and previous swing lows. This is a crucial level. If it holds, there’s a strong possibility for a rebound toward the 1.14280 resistance area.
On the H4 timeframe, the price structure remains within an ascending channel with no clear signs of trend reversal. The formation of higher lows suggests that buying pressure is still present. Notably, if this week’s CPI, PPI, and NFP data come in weaker than expected, market sentiment may shift further toward the idea of an early Fed rate cut – potentially providing a lift for EURUSD.
Additionally, rising geopolitical tensions could increase risk aversion, weakening the USD and further supporting the euro.
EURUSD – Upper Boundary Holds Firm, Watch for a PullbackEURUSD remains well-contained within its ascending channel, but price has repeatedly been rejected near the upper boundary around the 1.14790 zone. This highlights that profit-taking pressure near the previous high remains significant.
The current bounce from the lower boundary is unconvincing, as the recent highs are not surpassing the previous ones. While EMA34 and EMA89 are still offering support, if price moves toward 1.14790 but fails to break through, a “minor double top” pattern may emerge—raising the risk of a short-term correction.
A notable scenario would be a rejection at 1.14790, followed by a pullback toward the lower channel boundary around 1.13870. A break below this level could temporarily invalidate the short-term uptrend.
At this stage, buyers should remain patient and only look to re-enter near clear support zones. Avoid chasing entries near major resistance areas.

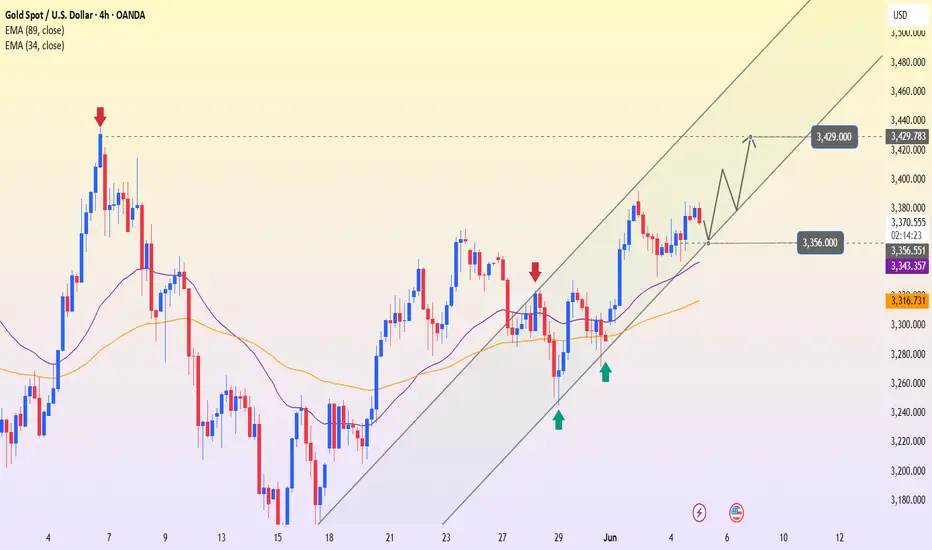
XAUUSD – Mild Pullback Before Breakout?Gold is currently experiencing a short-term pullback after U.S. jobless claims forecasts came in lower than previous levels. This suggests that the labor market remains resilient, reducing the likelihood of the Fed cutting interest rates soon. As a result, the U.S. dollar finds support, putting mild downward pressure on gold.
However, on the H4 chart, XAUUSD remains within a clearly defined ascending channel. The current dip may simply be a retest of the support zone around 3,356 — the intersection of the channel’s lower boundary and the 34 EMA. If this area holds firm, gold could rebound with the next target at 3,429.
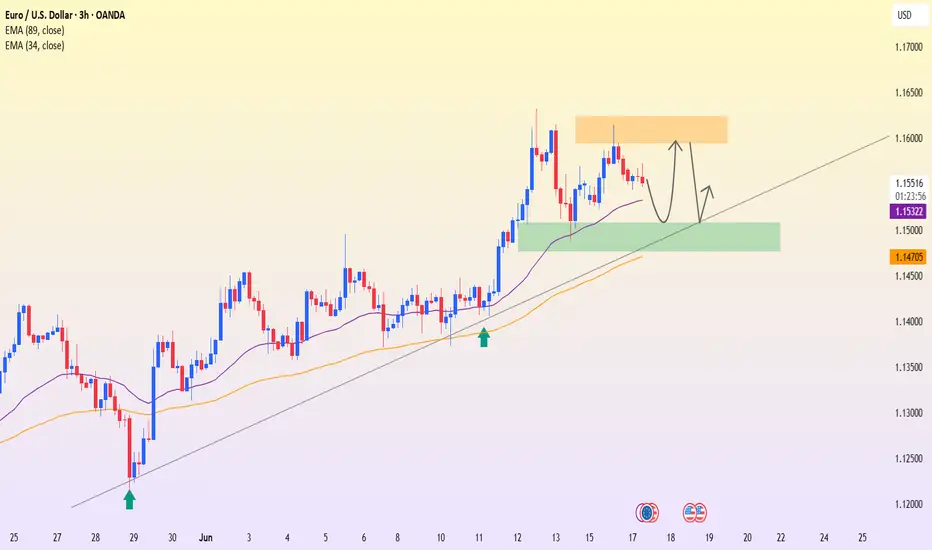
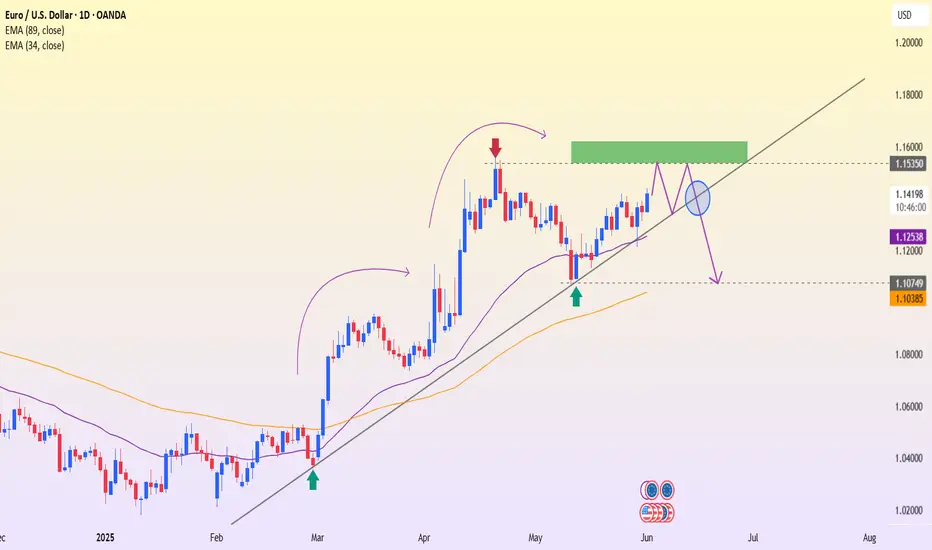
EURUSD – The bearish threat is becoming increasingly clearRecently released PMI data shows that the U.S. manufacturing sector is rebounding. This dampens expectations of monetary easing from the Fed. With a stronger U.S. dollar and rising bond yields, USD-denominated assets like EURUSD are facing downward pressure.
On the daily chart, EURUSD is approaching the resistance zone at 1.16438 – an area that has rejected prices before. The recent rebound appears to be losing strength, and the ascending trendline is at risk of breaking.
If the price fails to hold above this trendline as illustrated, a breakout to the downside could drive the market toward the 1.10757 zone – which aligns with a previous strong support level.
In summary: be cautious of a potential trend break. If a pattern of lower highs continues, sellers may soon take control.
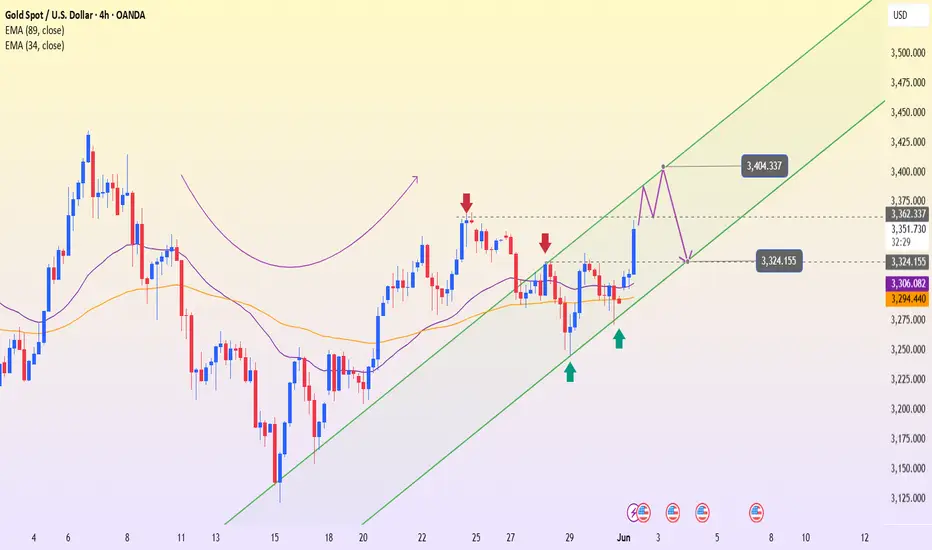
XAUUSD – Pressure becoming evident at higher price levelsAfter an impressive recovery streak, gold may soon have a chance to approach the 3,404 resistance zone – the top of the current ascending channel. This is not only the upper boundary of the technical structure but also an area where price has been rejected multiple times before, making it a likely profit-taking point or a trigger for renewed selling pressure.
In addition, the newly released U.S. PMI data exceeded expectations, signaling that manufacturing activity is recovering well. This has prompted the market to reassess expectations for Fed policy easing – pushing up both bond yields and the USD, while gold – which yields no interest – is facing pressure.
If buyers fail to produce a clear candle close above the 3,404 zone, a pullback scenario toward the 3,324 support area becomes highly plausible. This will be a “strength-testing” zone for both sides in the upcoming sessions.
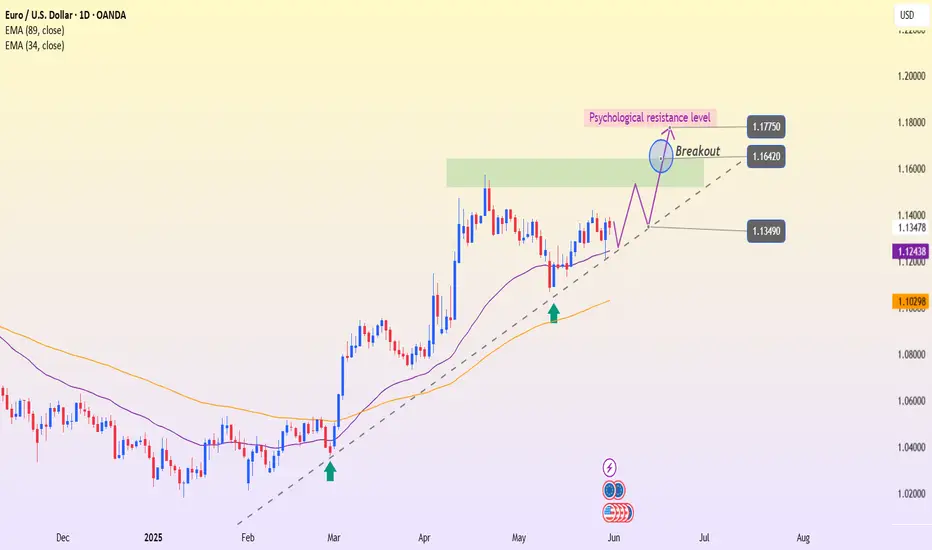
EURUSD – Ready to Break the Psychological CeilingOn the D1 chart, EURUSD is maintaining a stable uptrend structure with higher lows and a well-respected trendline. Buying pressure continues to emerge around the EMA 34 support zone, indicating that the bulls remain in control.
Currently, price is approaching the psychological resistance level at 1.16420 – an area that has rejected price multiple times in the past. However, a potential breakout pattern is forming: if the price can close decisively above this zone, the next target could extend to 1.17750.
While waiting for a breakout confirmation, traders can watch for minor pullbacks toward the trendline or EMA to find entries aligned with the trend. The overall momentum still favors the buyers, as long as the 1.13490 level holds.
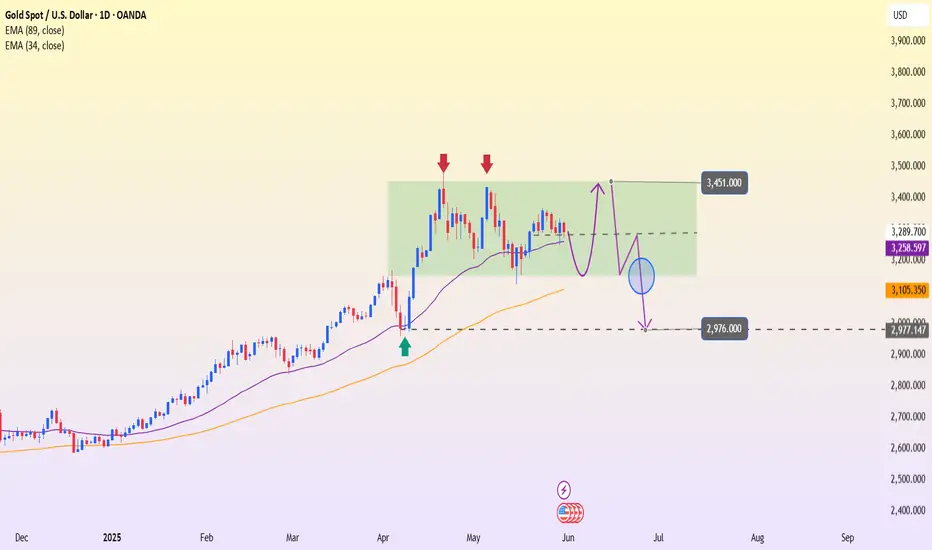
XAUUSD – Sideway breakout loomsOn the daily timeframe (D1), gold is still stuck in a wide sideway range between 3,105 and 3,451, which has persisted since early April. However, recent price action suggests the structure is gradually tilting toward a bearish bias.
The rebounds from the current range bottom are weakening, with each successive peak failing to surpass the previous one. Moreover, the EMA 34 is being tested repeatedly — indicating that buyers are losing momentum.
If the price breaks below the support area around 3,258–3,260 (which aligns with the EMA 34), the next target could be the 3,105 zone. And if this level also fails to hold, a deeper drop toward 2,976 may be triggered.
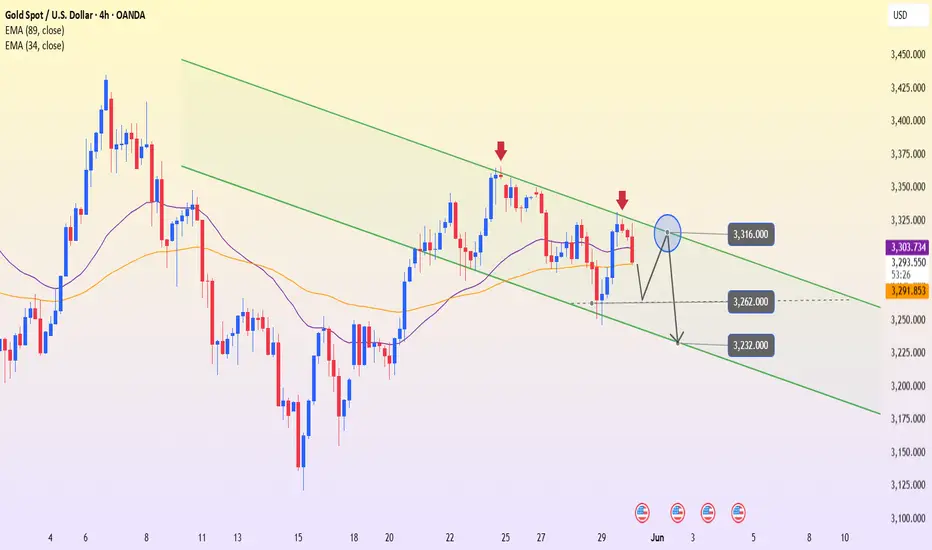
XAUUSD – Facing headwinds from inflation expectationsHey everyone, we’ve got quite an interesting setup on gold today!
As shown on the chart, XAUUSD is still moving within a clearly defined descending channel. After bouncing from the lower support area around 3,262, price is now retesting the upper boundary of the channel. What’s more important is that this area overlaps with both the 34 and 89 EMAs – creating a strong confluence of resistance.
If price continues to be rejected here, there’s a high chance that gold will reverse and head back toward the bottom of the channel. A likely target could be around 3,232.
As for the news: Core PCE – the Fed’s preferred inflation gauge – is expected to rise. This has led the market to anticipate that the Fed might keep interest rates higher for longer. And when bond yields rise and the USD strengthens, gold – a non-yielding asset – tends to lose its appeal.
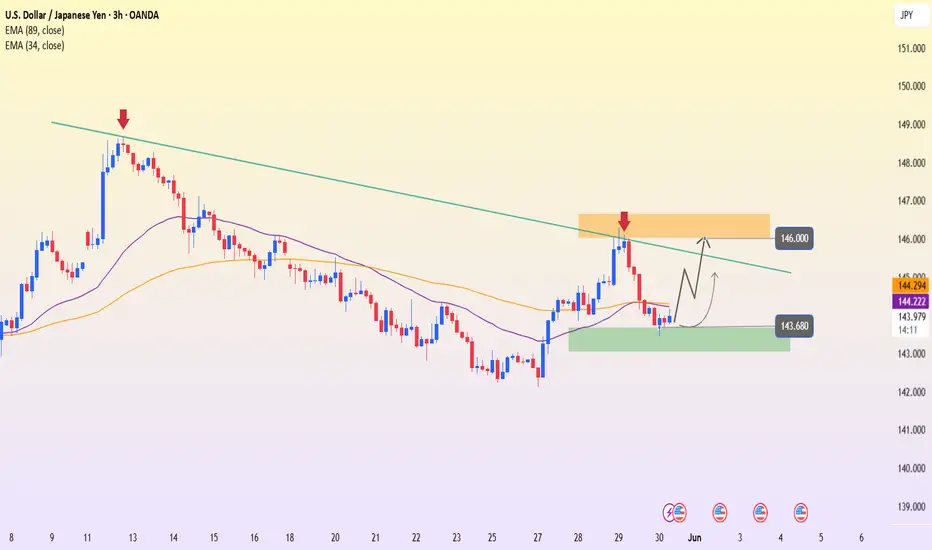
USDJPY – Supportive news, price may break resistance soonUSDJPY is supported by positive U.S. economic data, as the PCE index remains elevated—reinforcing expectations that the Fed will keep interest rates higher for longer. This has boosted bond yields and the USD, driving USDJPY upward.
On the H3 technical chart, USDJPY has rebounded from the support zone around 143.680. Both the EMA 34 and EMA 89 lie below the price, reinforcing the recovery momentum. The pair is now expected to approach the 146.000 resistance area—where it intersects with the long-term descending trendline that has rejected price at least twice before.
If buying pressure holds and 146.000 is decisively broken, a short-term bullish trend will likely be confirmed. However, another rejection could lead to a retest of the previous support zone. Overall, the current trend slightly favors the buyers.
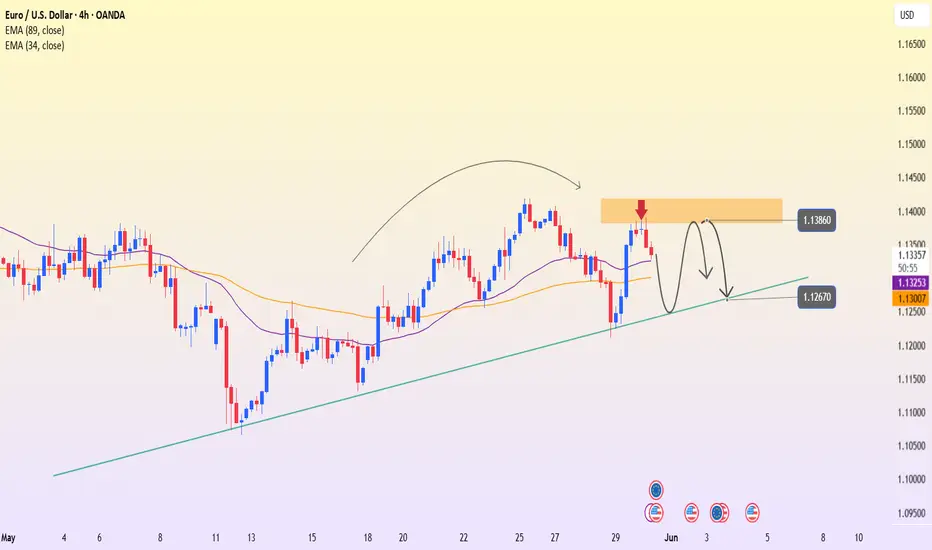
EURUSD – Bullish trend at risk amid PCE and technical pressureEURUSD has just reached the 1.13860 resistance zone – a confluence with the previous peak and former supply area. A weak rebound and a rounding top pattern are gradually forming, indicating weakening buying momentum. The 34 and 89 EMAs on the H4 chart add further pressure from a technical perspective.
If the price continues to be rejected at 1.13860, it may drop toward 1.12670 – which aligns with the ascending trendline support. A break below this level would confirm a clearer bearish trend.
The upcoming Core PCE data is forecasted to rise – indicating inflation remains elevated. This raises the likelihood that the Fed will maintain high interest rates for longer, supporting the USD and weighing on EURUSD.
BTCUSDT – Risk of trend break, bearish signs emergingBTCUSDT is trading right at the lower boundary of its ascending channel, around the 108,800 mark. After several bounces from this trendline, price action now appears to be stalling—indicating that buying pressure is weakening. If the price breaks below the 107,500–106,500 support zone (marked by the 34 EMA and recent swing low), the short-term uptrend could be invalidated.
A confirmed break below 106,500 could trigger a further correction toward the 89 EMA around 102,800.
On the news front: Latest data shows Bitcoin’s dominance is slightly decreasing as capital rotates back into altcoins. Additionally, market uncertainty surrounding the Fed's monetary policy outlook is making investors more cautious about riskier assets like crypto.
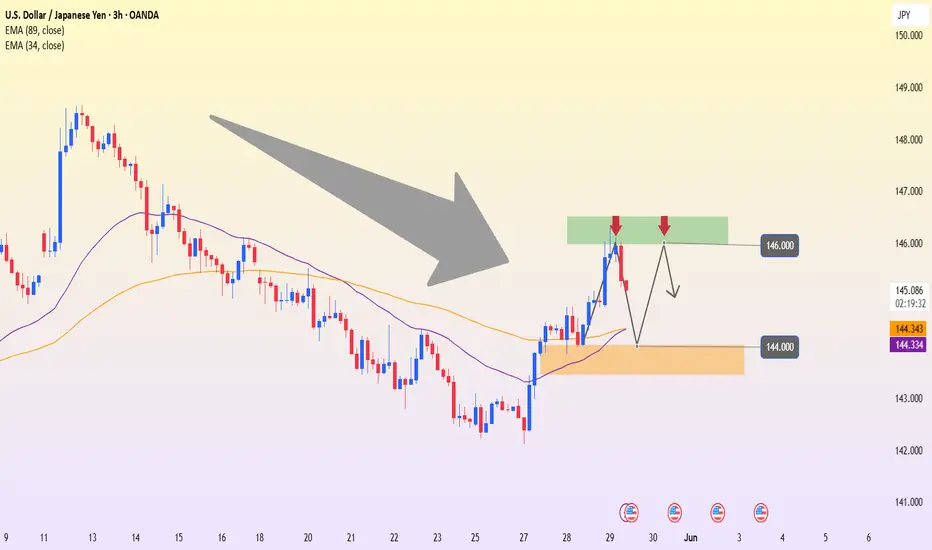
USDJPY – Rejected at 146.00, downside risk growsUSDJPY reacted strongly at the 146.00 resistance area – a level where price was previously rejected. After a sharp rally, the pair has turned lower and is now heading toward the 144.00 support zone, which aligns with the EMA 34–89 on the H3 chart.
The chart shows a small double top pattern forming around the recent highs. If USDJPY continues to struggle below 146.00 and breaks through the 144.00 support, a short-term downtrend may be confirmed, with the next target around 142.50.
On the news side: The Japanese Yen is gaining some ground again after the BOJ signaled readiness to adjust its easing policy if inflation consistently exceeds its target. Meanwhile, the USD is under pressure as expectations grow that the Fed may keep interest rates steady in the upcoming meeting, due to cooler consumer data.
Suggested strategy: Consider selling if bearish signals appear around the 145.80–146.00 area, with a short-term target at 144.00.
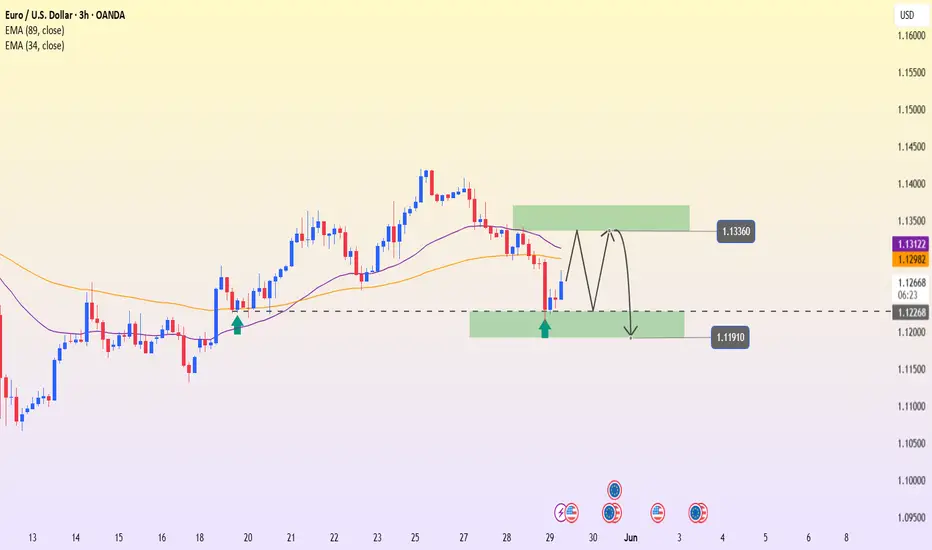
EURUSD – Technical rebound, but bearish pressure still loomsAfter a sharp drop to the support zone around 1.12255, EURUSD has made a mild recovery and is now retesting the 1.13360 resistance area – which aligns with both the 34 and 89 EMAs. This confluence zone could trigger renewed selling pressure if price fails to break above.
The 3-hour chart shows a zigzag-like recovery forming, but each new high is still lower than the previous one – indicating that the downtrend remains intact. If EURUSD continues to struggle at this resistance, it is likely to reverse and retest the 1.11910 support area.
On the news front, markets are awaiting CPI data from both the Eurozone and the U.S. this week. If U.S. inflation comes in higher than expected, the dollar may continue to strengthen – increasing short-term downside pressure on EURUSD.
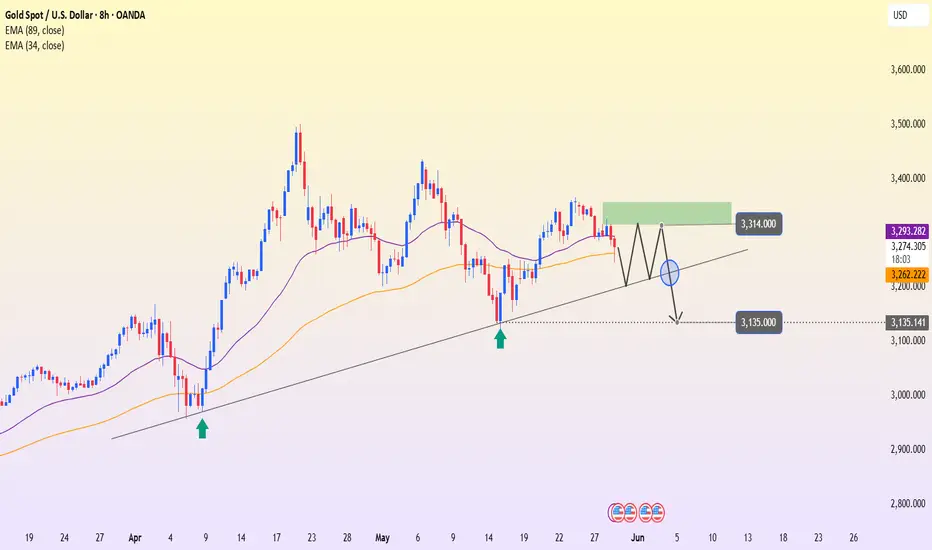
XAUUSD – Weakening signals, growing risk of breakdownGold is trading around $3,273 after a clear drop from the $3,314 resistance zone. On the H8 chart, price has approached the long-term ascending trendline and is hovering near the EMA 89 – a very critical confluence area.
At the moment, price is forming a sideways pattern just above the trendline, but the recovery momentum remains weak. If gold breaks below this zone, the uptrend will officially be invalidated, and the next target could be the $3,135 technical support.
On the news front: The market is closely watching the upcoming U.S. Core PCE data this weekend. This is the Fed’s preferred inflation metric, and if the reading comes in stronger than expected, expectations of prolonged high interest rates could return – which would put significant pressure on gold.
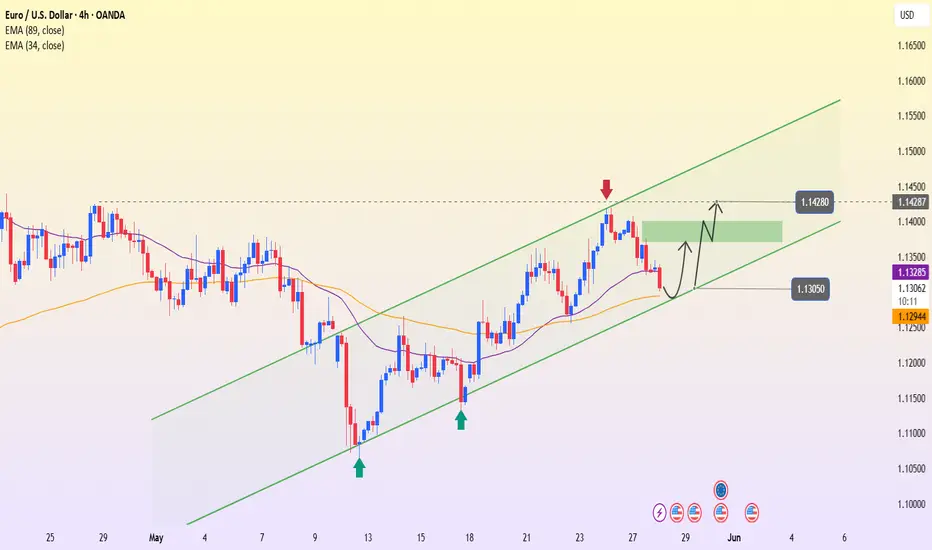
EURUSD – Holding the uptrend, eyes on support reactionEURUSD continues to move steadily within a clearly defined rising channel. After touching the channel bottom around 1.1305 (which aligns with the 89 EMA), price is showing a slight rebound and has a chance to form the next upward leg.
Technical view: The bullish structure remains intact. As long as price holds this bottom area, there's a high probability of another push toward the resistance zone around 1.1428 – a level that was previously rejected.
News factor: Market sentiment is now focused on upcoming U.S. Core PCE inflation data, which could influence expectations of a Fed rate cut and, in turn, impact the strength of the USD.
Suggested strategy: Favor buying if price holds above 1.1305 – targeting 1.1428. If this level fails, the short-term uptrend may be challenged.
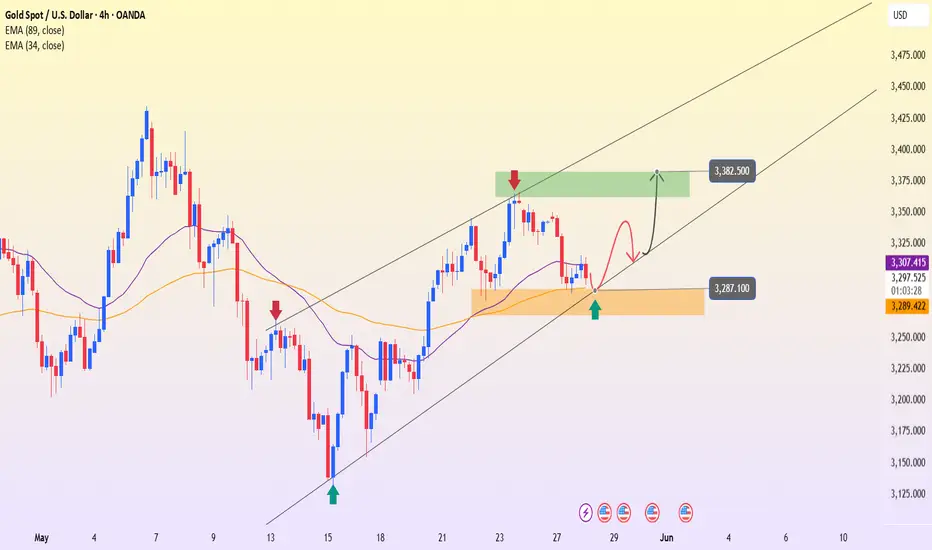
XAUUSD – Holding the channel, eyeing a bounceGold is still trading within a rising channel, recently touching the confluence support zone of the trendline, the 89 EMA, and the demand area around 3,287. This level has seen strong reactions in the past – and if price holds here again, a bounce toward the 3,382 zone is highly likely.
Supporting factor: Market sentiment remains cautious after Moody’s emphasized the risks surrounding U.S. public debt, putting pressure on the USD and boosting gold’s appeal. In addition, investors are closely watching the upcoming U.S. Core PCE data later this week – a key factor that could influence Fed rate cut expectations.
Suggested scenario: Favor buying if the price holds above 3,287, targeting 3,382 – the upper boundary of the channel. If this fails, selling pressure may return.
DELL Technologies Options Ahead of EarningsIf you haven`t bought the recent dip:
Now analyzing the options chain and the chart patterns of DELL Technologies prior to the earnings report this week,
I would consider purchasing the 110usd strike price Puts with
an expiration date of 2025-9-19,
for a premium of approximately $8.90.
If these options prove to be profitable prior to the earnings release, I would sell at least half of them.
I`m bullish long term on DELL though.
Disclosure: I am part of Trade Nation's Influencer program and receive a monthly fee for using their TradingView charts in my analysis.

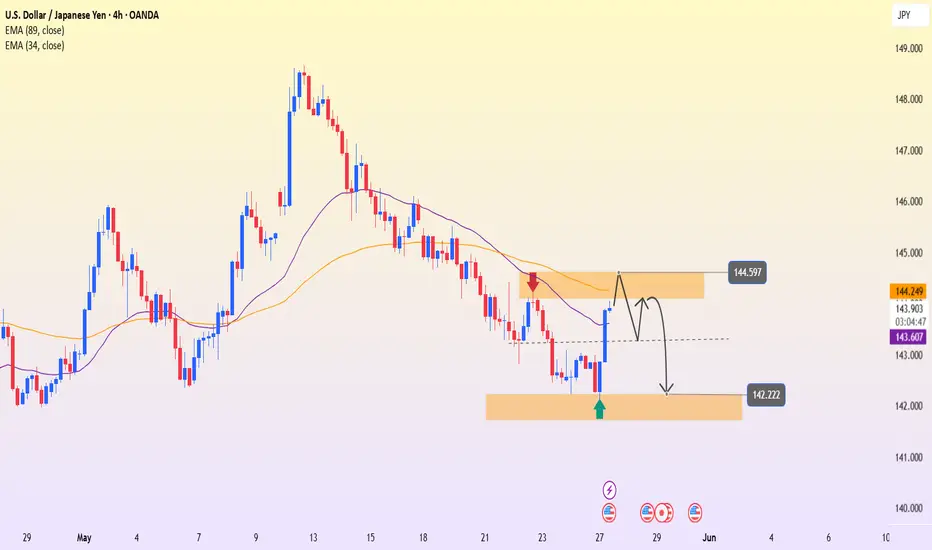
Downtrend Awaiting ConfirmationUSDJPY has just made a technical rebound from the support zone at 142.22 up to the resistance area around 144.60 — a confluence with both the EMA 34 and EMA 89. However, based on the chart, this zone has previously acted as a reversal point, and price is now retesting that same level of rejection.
The current price action suggests a high likelihood of a small double-top pattern forming around 144.60. If selling pressure re-emerges here, the market could reverse and head back down toward 142.22, aligning with the developing downtrend.
Moody’s recent warning on U.S. credit rating has placed pressure on the USD, while the JPY continues to hold its safe-haven appeal amid market uncertainty.
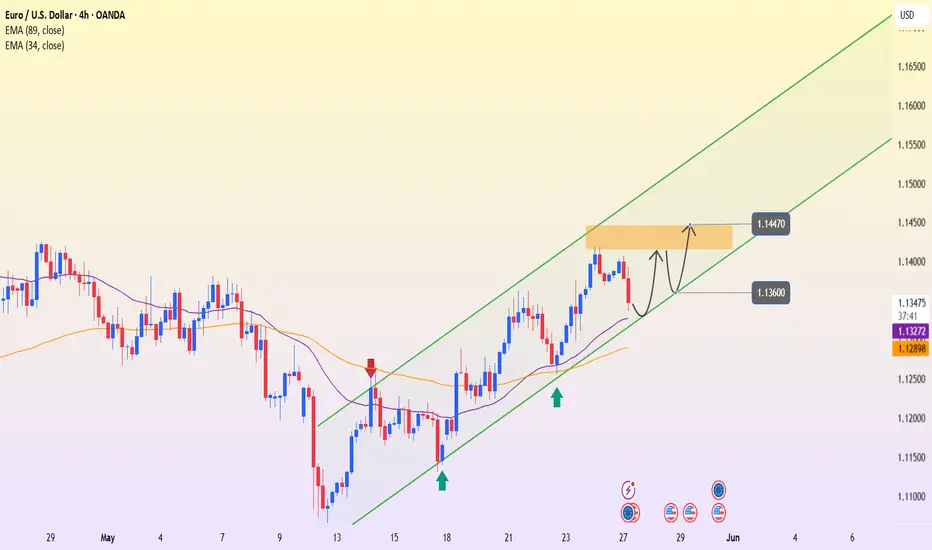
EURUSD – Bouncing on trendline amid EU optimismEURUSD continues to hold a strong upward momentum within a short-term ascending channel. After retesting the channel bottom around the 1.1360 zone, price is showing signs of rebounding, and a "small double bottom" pattern appears to be forming. If confirmed, EURUSD may rally toward the resistance area at 1.1447.
Factors supporting the bullish trend:
Trump temporarily postponed the 50% tariff on EU goods until July 9 → Trade tensions ease, supporting the euro.
Germany's Q1 GDP grew by 0.4% – above expectations → Boosts confidence in Eurozone recovery.
The ECB aims to elevate the euro’s global role (digital euro, cross-border payment improvements).
Potential scenario:
If the 1.1360 zone holds (channel bottom + EMA support), there is a high chance that price will retest and break above the 1.1447 resistance.
Trump Eases Tariff Pressure, Gold Awaits Fed SignalsOn May 26, U.S. President Donald Trump decided to extend the deadline for the 50% tariff on goods from the European Union until July 9. This move temporarily eased trade tensions and slightly reduced the demand for gold as a safe haven.
Gold is currently trading near a long-term descending trendline that has previously rejected three bullish attempts. After a strong recent rebound, the price is now pausing and risks retracing toward the support zone around 3,241.4 – a confluence area with both the EMA 34 and EMA 89.
If this support holds, gold may bounce back and attempt a breakout above the trendline, targeting the 3,439.5 level. However, if selling pressure continues to dominate, a deeper correction remains a real possibility.
This week, investors will closely watch the FOMC meeting minutes and the U.S. Consumer Confidence Index for May. These data releases are expected to shed light on the Federal Reserve’s outlook on inflation and interest rate policy, which could significantly impact the strength of the USD and gold prices.
