Sell-buy
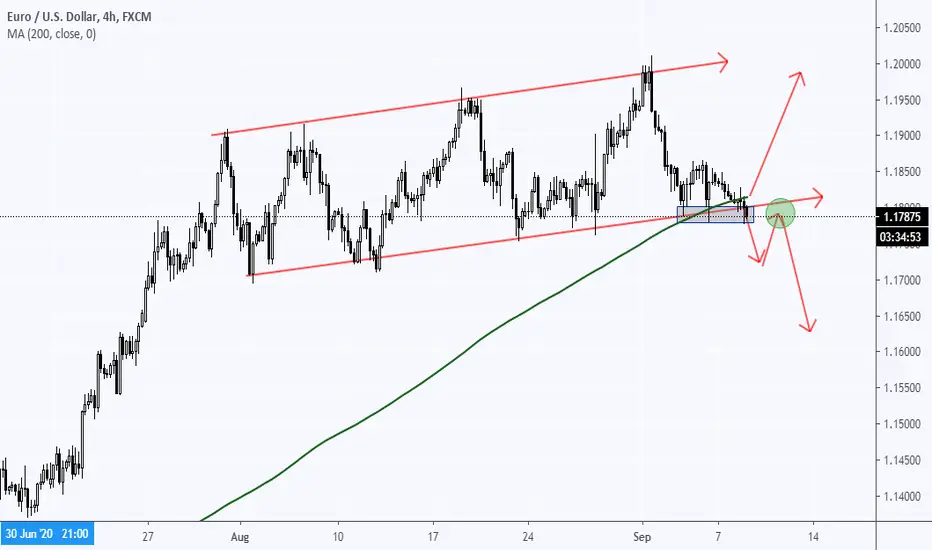
EurUsd H4 Channel (Potential Sell Breakout)Good Day Traders!
By now you have probably realized that EurUsd has been trading within channel for the past few weeks. At present price is retesting the bottom of the channel along with previous support. Many Buyers will be looking at this as an opportunity especially since it is near the 200 simple moving average. However, i am not convinced that the price of this pair will go up. Most likely this is a trap for buyers for the market to push down. A break below the channel and 200 MA would signify a huge move to the downside. I will be looking for price to break below and leave the 1.1790 level and retest this support as resistance, taking a sell position. if that does not happen and price continues rejecting and starts a push to the upside i will be entering on a lower time frame on a retest of a recent price level.
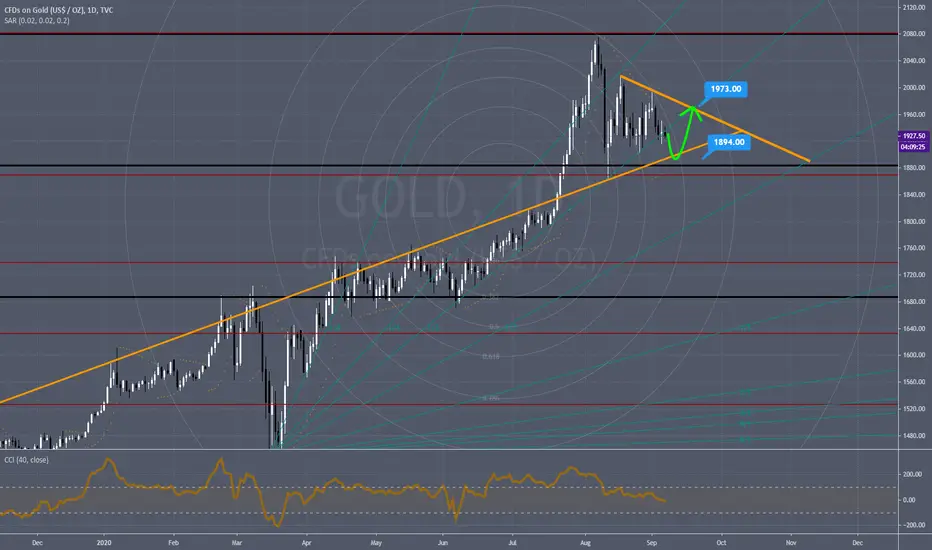
i KNOW what will happen to GOLD next 10 daysas you can see i'm waiting for a little correction to 1894 and then we have another move to 1973
i have marked this move with a GREEN ARROW and you can follow it
lets see
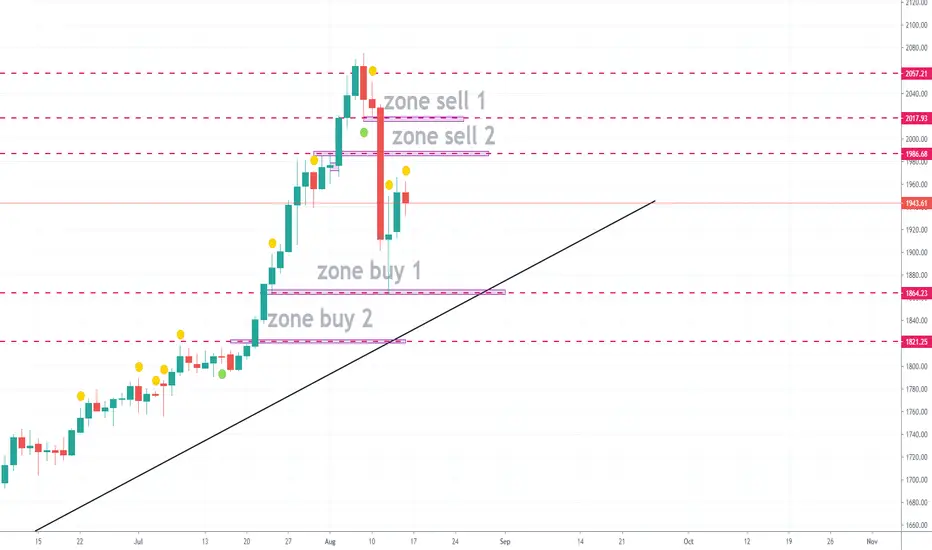
GOLD TRADE IDEAShere i share my personal opinion about gold..best place to buy and sell gold..if you agree with me please like and share this analysis thanks
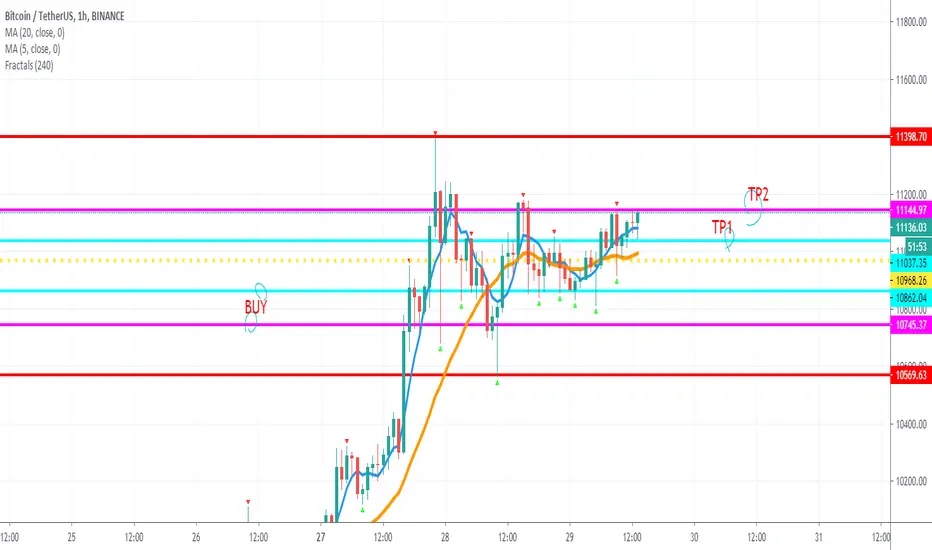
CHFJPY Short SetupFrom a COT perspective, we can see that the JPY continues to have a strong long contract momentum. This week the big players dropped a large chunk of short contracts.
From a technical perspective, we are entering a critical supply area. This and the COT data are enough for us to enter a trade with a good Risk to Rewards ratio.
Our target will be the 109.000 level and TP1 and TP2 can be seen along the way as well.
TP1 - it aligns the the 0.382 Fibonacci level and the daily critical demand zone
TP2 - it aligns the the 0.5 Fibonacci level and the daily critical demand zone
And the 109.000 area is not only a psychological point, but it matches also perfectly with the 0.786 Fibonacci level and the monthly critical demand zone.
Happy Trading!

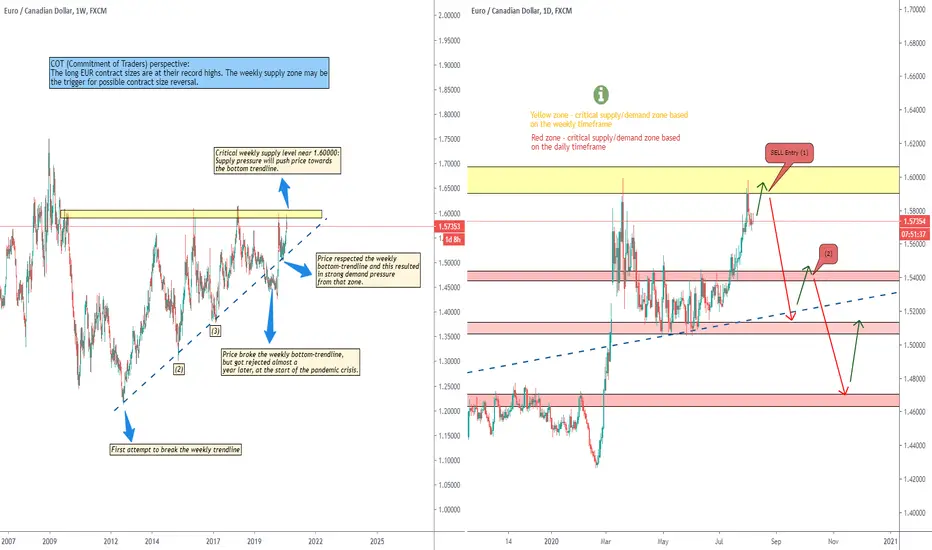
EURCAD Long Setup & AnalysisThe EUR COT Report came in positive once again and pushed the record long contract sizes even more. A few days ago, we’ve reached a major supply zone which may be a trigger for a increase in the short contract sizes.
As we predicted for the EURCAD, price reached right below the 1.60000 area, where it was met by strong supply pressure. This may push price towards the weekly bottom trendline near 1.52000. It aligns perfectly with the daily critical zone and with the 0.5 Fibonacci level.
As we’ve seen many times in the past, price likes to move a bit below the weekly trendline before it once again moves above it, and this is why I suspect that price may even reach the 1.47000 mark.
Right now, for the first down wave we have 2 possible scenarios for EUR/CAD:
1.Price moving straight towards the weekly trendline near 1.52000.
2.Price building another top near 1.60000 before going towards 1.52000.
Happy Trading!
China 50 Index OANDA:CN50USD
Moving in downtrend. We will like to buy from lower trend line, if it breaks trend line we will like to Sell.

1500 PIPS move on this pairFirst, we go short, then we go long. If it moves as planned, we will gain 1500 PIPS in the coming weeks.
For accurate entries, exit, Sl and TP, send me a message.
Like & Follow to support more analysis
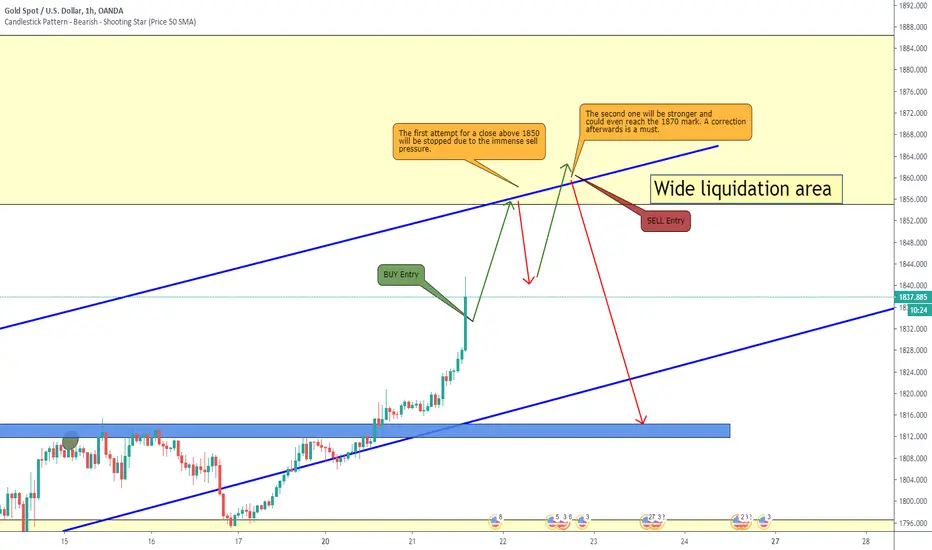
XAUUSD Detailed Analysis - Long/Short SetupYellow zones- critical zones based on the monthly/ weekly timeframe
Red zones- critical zones based on the daily timeframe
Blue zones – critical zones based on the 4h timeframe
Orange zones – critical zones based on the 1h timeframe
According to last week’s COT Gold report we can see that it still holds the dominance in the “long” contract sizes. This is another indicator that price will reach the 1850.000 mark.
As I said a few weeks ago in my analysis, price will not only cross the 1800.000 mark, but it will go towards the 1850.000 area as well. Now we can see that happening. Yesterday price got massive support from the double confirmation point near the bottom-trendline and the 4H critical zone at 1810.000.
After the price reaches the upper trendline/monthly critical we can expect strong sell pressure to kick in. That’s why we have 2 possible scenarios:
1. Price testing the monthly critical area near 1850.000-1860.000 twice. After the second attempt, a strong correction towards the 4H critical area near the 1810.000 mark should take place.
2. Price doing a strong correction towards the 4H critical right after the first monthly critical touch near the 1850.000.
Happy Trading!
EURJPY going down 150pips ??Hope you had a great week! Here's my view for EURJPY !
Great pattern here, after that massive rally we saw a 61.8%fi retracement and now back close to 122.50 values where we find a good resistance! My opinion is that we will see a nice drop here. But markets dont care about our opinions right.. So i'm going with 30pips SL and a very conservative entry as i'm entering soon. Might add some positions if confirmed! If not, and price breaks up, will wait for re-test to go long with target on the last high, 124.00! :D:D
if like my analysis, please leave a like and comment! :D

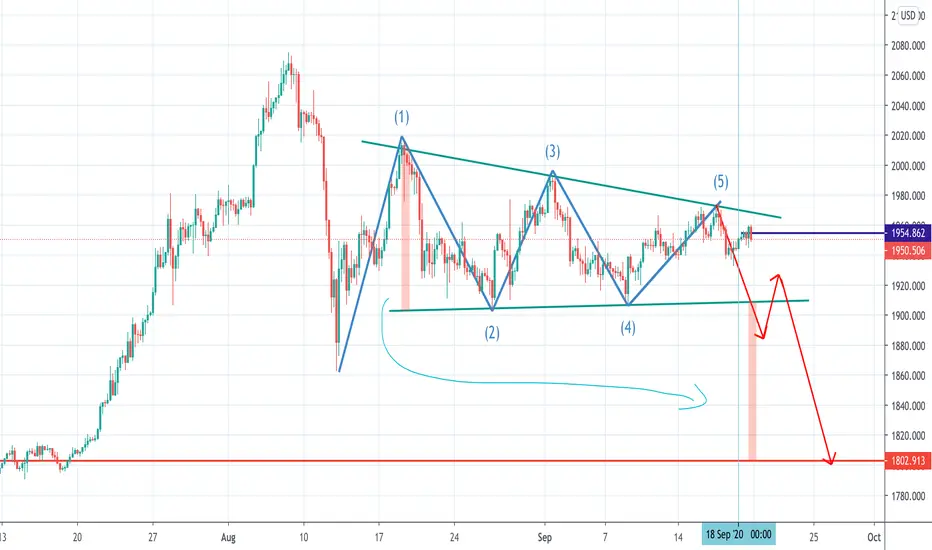
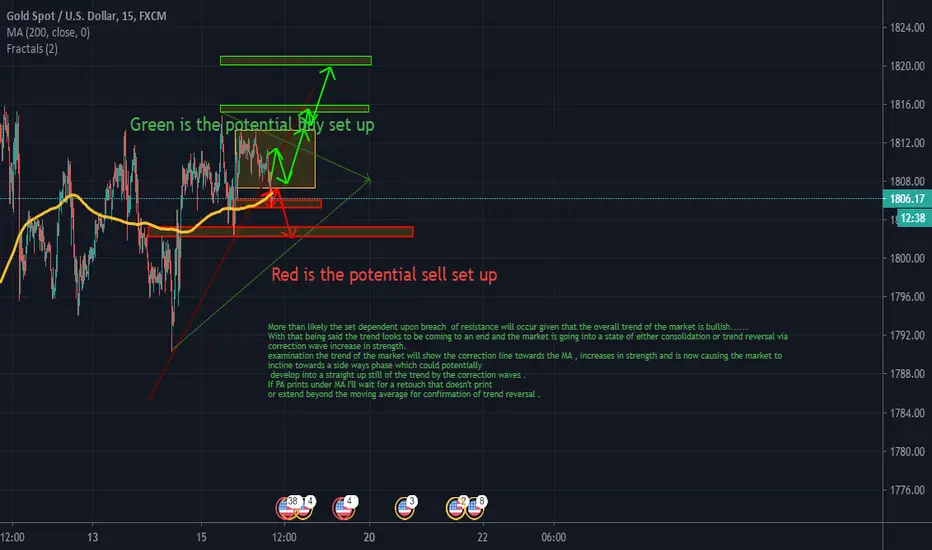
XAUUSD GOLD SUPREME AnalysisMore than likely the set dependent upon breach of resistance will occur given that the overall trend of the market is bullish......
With that being said the trend looks to be coming to an end and the market is going into a state of either consolidation or trend reversal via
correction wave increase in strength. examination the trend of the market will show the correction line towards the MA , increases in strength and is now causing the market to incline towards a side ways phase which could potentially develop into a straight up still of the trend by the correction waves .
If PA prints under MA I'll wait for a retouch that doesn't print or extend beyond the moving average for confirmation of trend reversal .
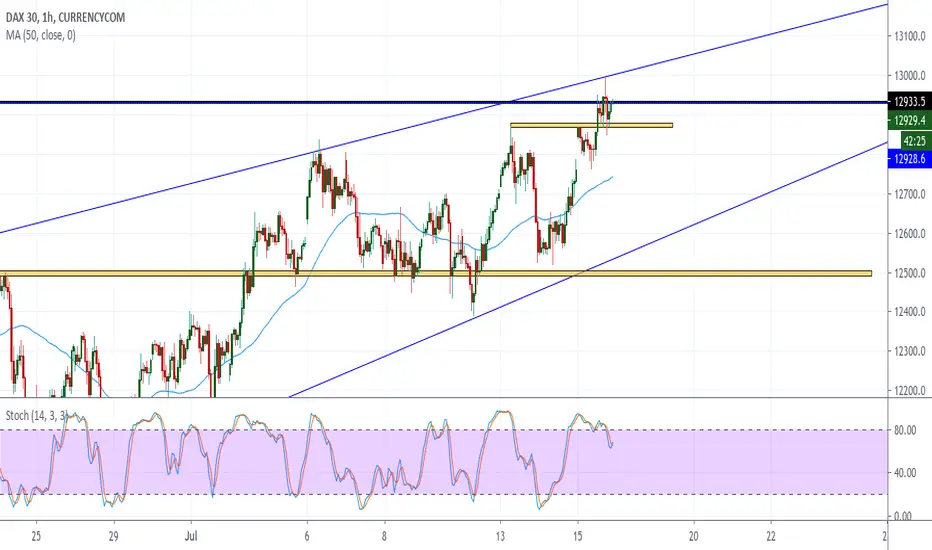
DE30 Index Trade Idea DE30 Trade Idea.
Currently price is bullish. Price has broken above the resistance level which now may slowly turn into a support level. Waiting for a possible retest of this level and a further confirmation before placing a buy trade.
However, price has also met the daily high level and we could see a possible trend reversal should price fail to continue its bullish run. Should such happen I will wait for a retest of the level as resistance as well as a confirmation and place a sell.
I also speculate a possible doji candlestick forming hence the trend reversal.
Minimum R/R - 1:1
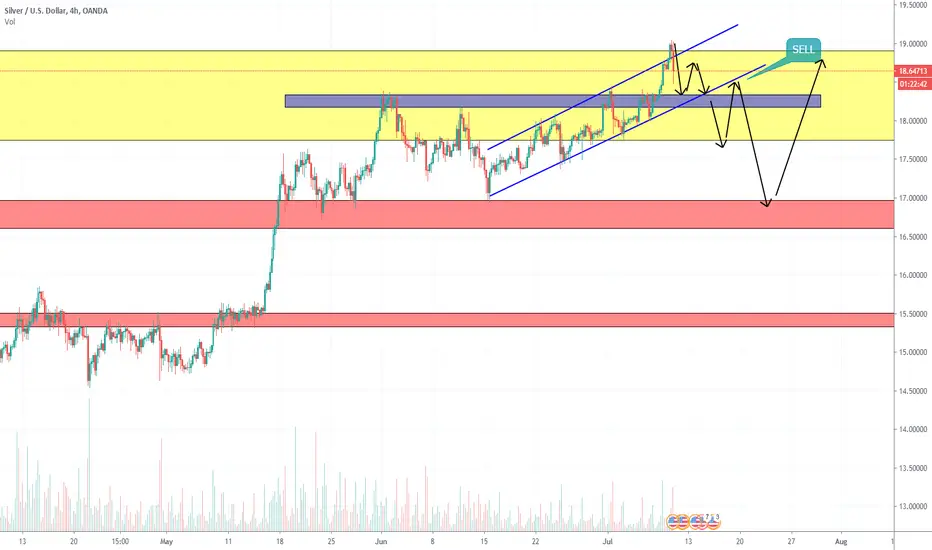
XAGUSD ShortYellow zones- critical zones based on the monthly time frame
Red zones- critical zones based on the daily time frame
Blue zones – critical zones based on the 4h time frame
Last week's the Silver COT Report showed us some signs for a possible shortage on long contracts. The price has finally broken over the monthly critical area at the 19.00000 zone and a few more attempts may be seen before a good correction takes place. 18.300 will be a good mark to take profit on the current down momentum and also to see if the price can break the current channel it's in. The "parallel" channel is being respected since the 15. June.
There are 2 scenarios:
1. If the price breaks bellow the 18.300 bottom-trendline there will be a good entry point. It will be at the neckline of the future "M" structure. Such an entry gives us a better confirmation for a possible downtrend correction.
2. If the price reaches the 18.300 area and just goes for a second attempt for a good close above the 19.00000 zone.
If the first scenario takes place, we need to see a strong rejection from the daily critical at the 16.85000 area which also aligns perfectly with the 0.5 Fibonacci retracement level. If this happens we can prepare for another attempt on the previous highs at 19.00000.
Happy Trading!
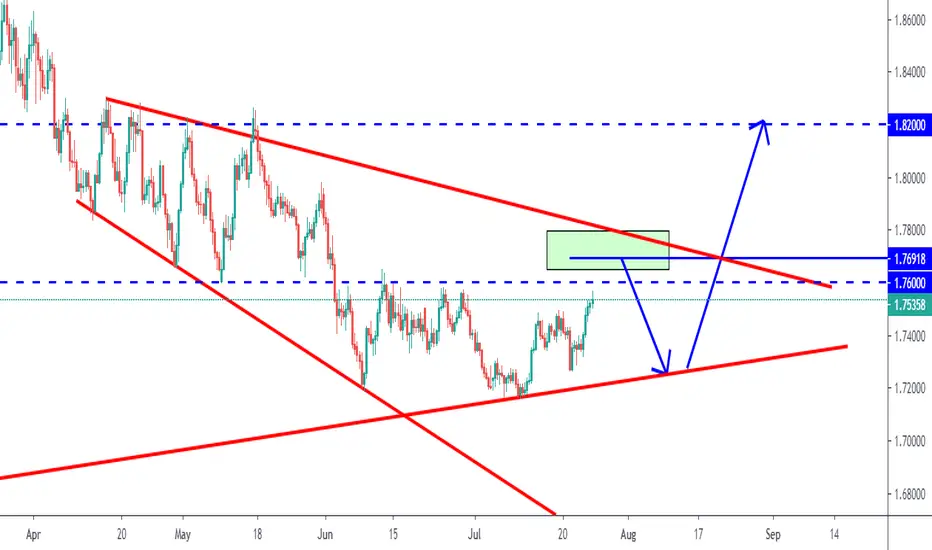
EURAUD two possible scenarioson H4: EURAUD is overall bearish trading inside our green channel and it is currently sitting around our upper green trendline so we will be looking for objective sell setups on lower timeframes.
on M30: we are waiting for a new swing to form around our lower red trendline to consider it objective and enter on its break downward.
on H4: we are waiting for a momentum candle close above our last swing to buy.

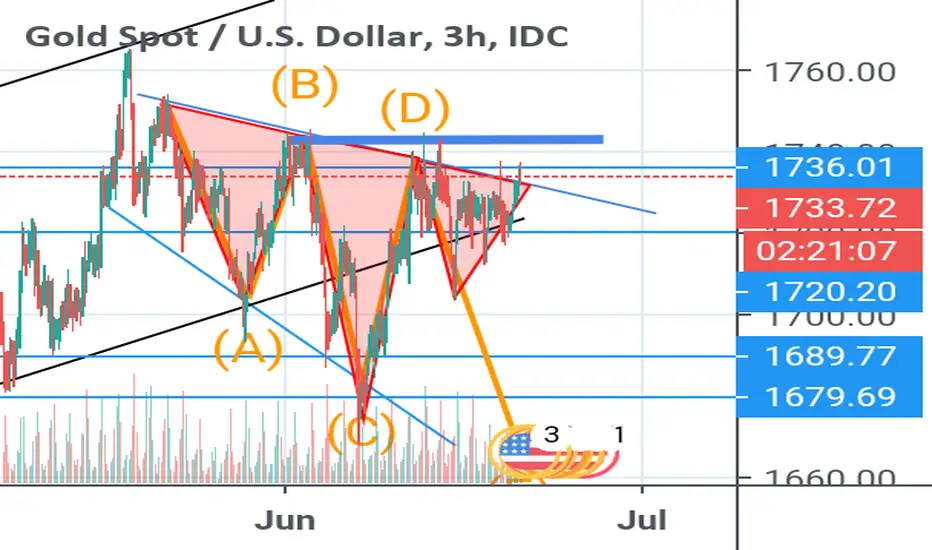
XAUUSD (GOLD) TECHNICAL ANALYSIS 6Gold has now hit the resistance trend line of the H3 (3 hours) bullish (falling) wedge and has also closed the right shoulder of the Head & Shoulder (H&S) highlighted in red triangles. Currently price is trying to break through the resistance trend line and also through the resistance level of the channel it has been consolidating the whole of this week, would rather wait for price to break to the dark blue level, then retest the resistance trend line then go for buys. However Gold may fail to break the resistance level and fall to the last touch of the support trend line of the bullish (falling) wedge and then come back up, hopefully break through both wedge resistance and channel resistance and fly up.
Remember this is my idea and I stand to be corrected. Always await for price confirmation before placing trades.
Trade smart 🔅
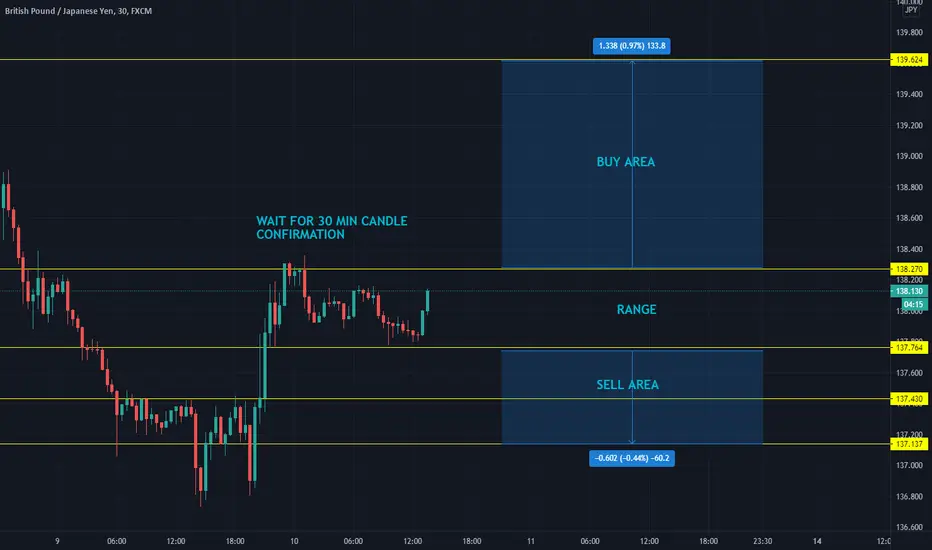
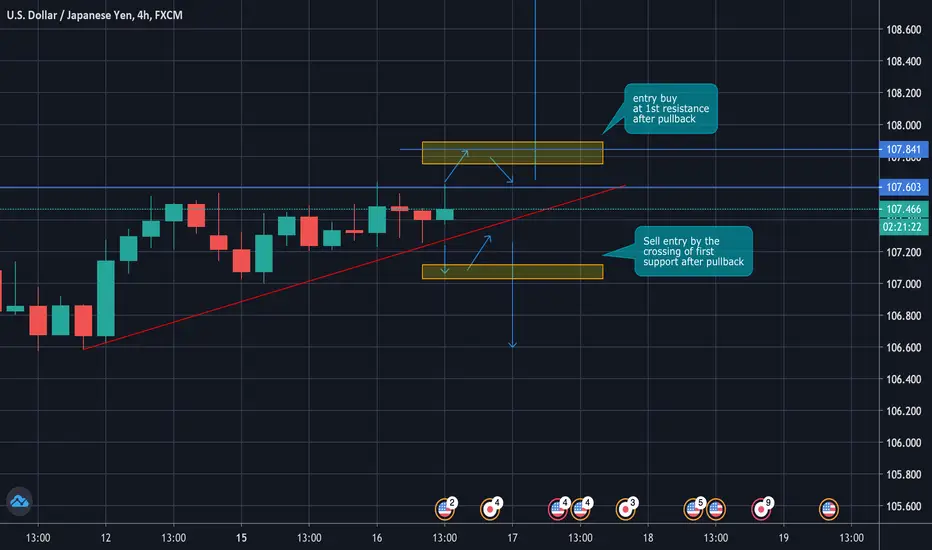
USD/JPY triangel breakoutHello im new in the forex trading world this is my analysis of what I think will happen after x time
if you could help me please react and say what I need to improve or do better
buy/sell the goldPretentions for the market when it will be opened . so we can see that if the market will do a retest maybe in the up way or the down way .

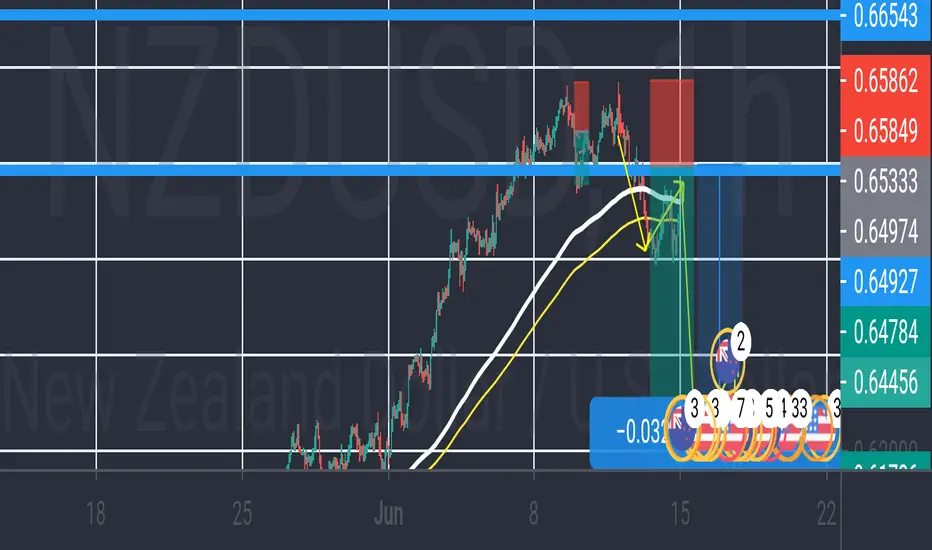
NZDUSD SELLThis is a big opportunity for the traders
Selling NZDUSD is high probability after bullback finish and start to retrace
And downtrend begin
In this trade I'm going to risk 90 to reward 320 pips
Guys please don't take my words serious make also your analysis if they match is good if I'm wrong tell me and drop your comments in the comments below thanks