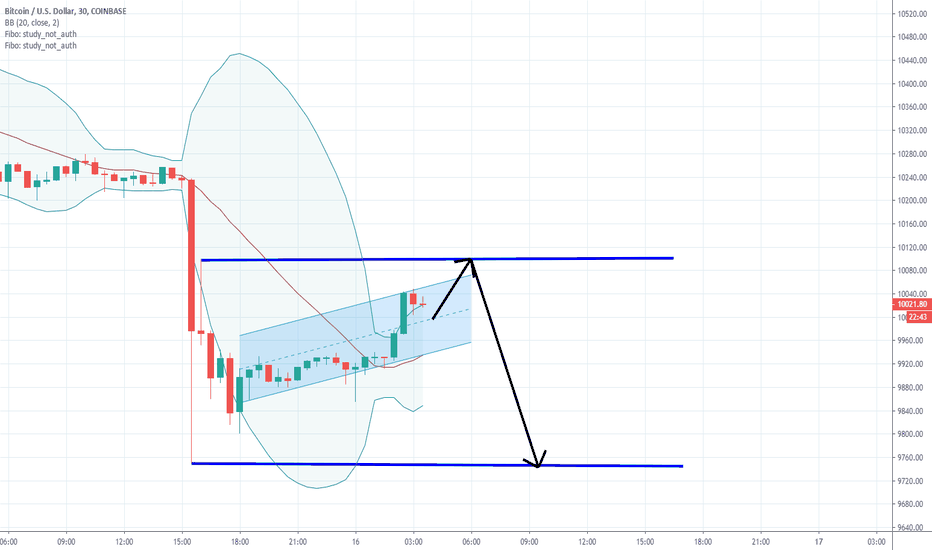
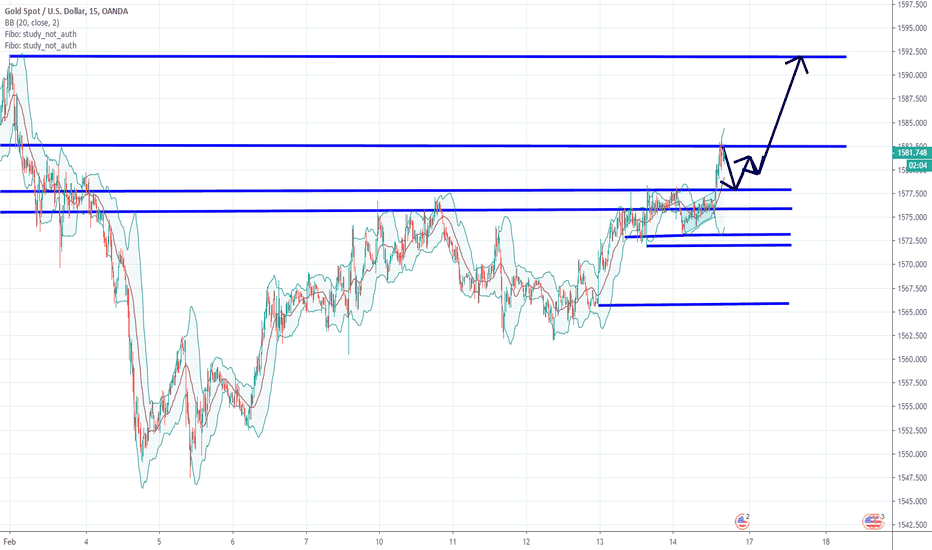
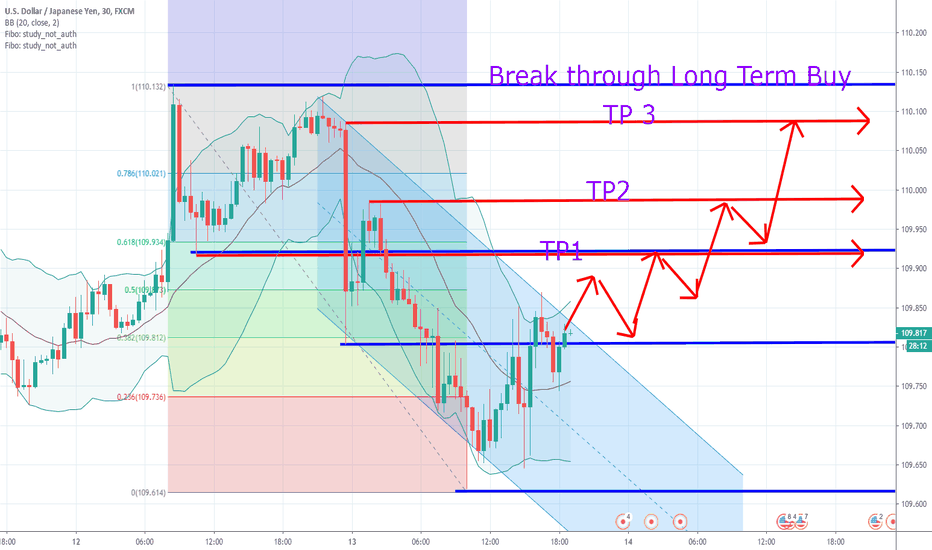
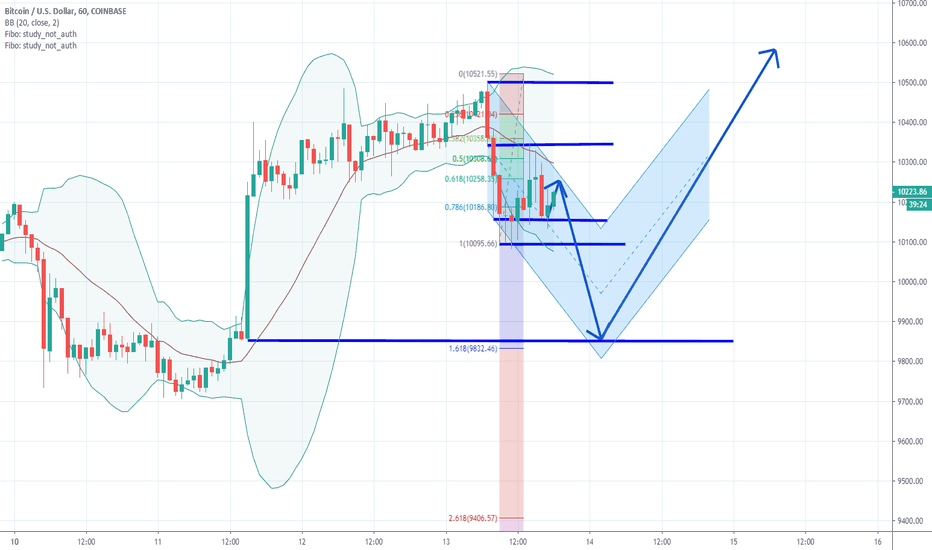
BTCUSD Current TrendAs you can see, if it breaks through the resistance line it will have strong buyers for it to shoot upwards as a long term buy. If it goes the opposite direction and breaks through the current support line then it will shoot down creating a long term sell. Comment for any additional ideas.
Sell-buy
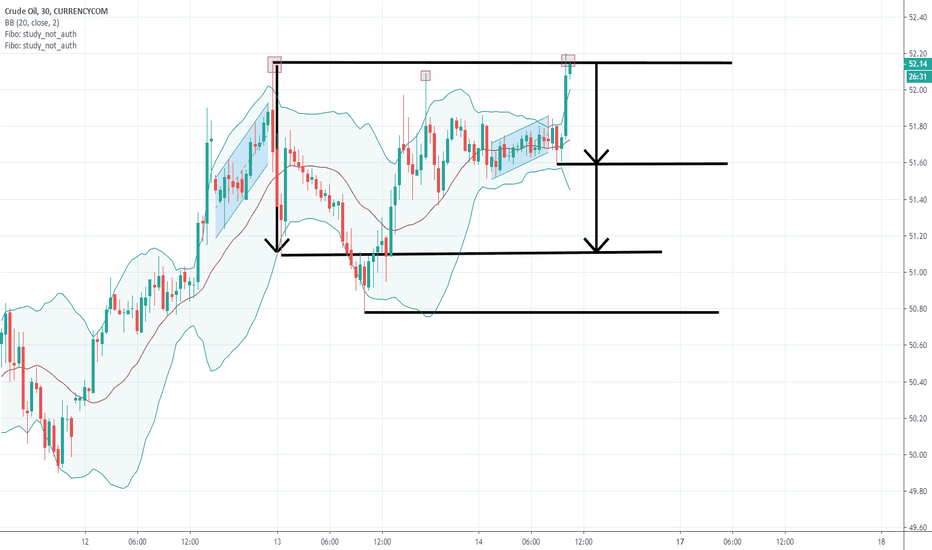
CRUDE OIL SHORT TERM BUY OR SELL DEPENDINGAs shown above, if crude oil breaks through the top resistance level with strong buyers, it will be a buy. If there are strong sellers it will not breakthrough and drop to where I have marked because of the trend that happened previously.
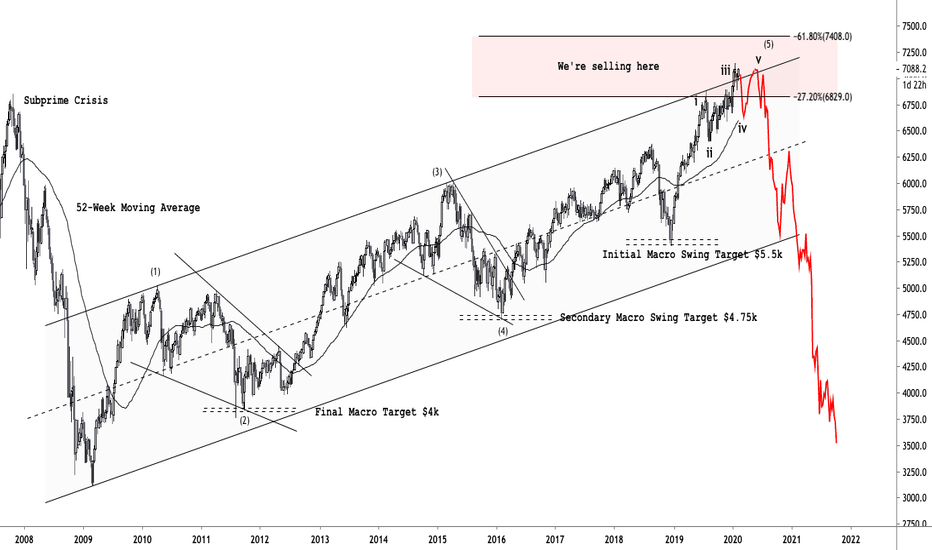
Australian Equities Unwind We're calling it.
Australian Equities have now recovered losses stemming from the 2008 Subprime Crisis sell off and are now at ATHs supported by large corporate buybacks amidst moderate earnings growth.
Our view
- Weaker relative EPS on the back of domestic bushfires, lowered Chinese demand and corporate buyback continuity.
- Lowe & Co running out of monetary stimulus and room to push asset prices higher. We see an unwind on any hawkish commentary out of the RBA.
We see weak price momentum and signs that price is now overbought and due in for a positional correction.
We have added sellside exposure across both our macro and directional portfolios
-------------------------
We look forward to continuing to provide market leading analysis to traders & investors alike across the TradingView platform.
Like, subscribe and leave your comments below!
Until next time,
Portier Capital
Macro Strategy & Portfolio Management
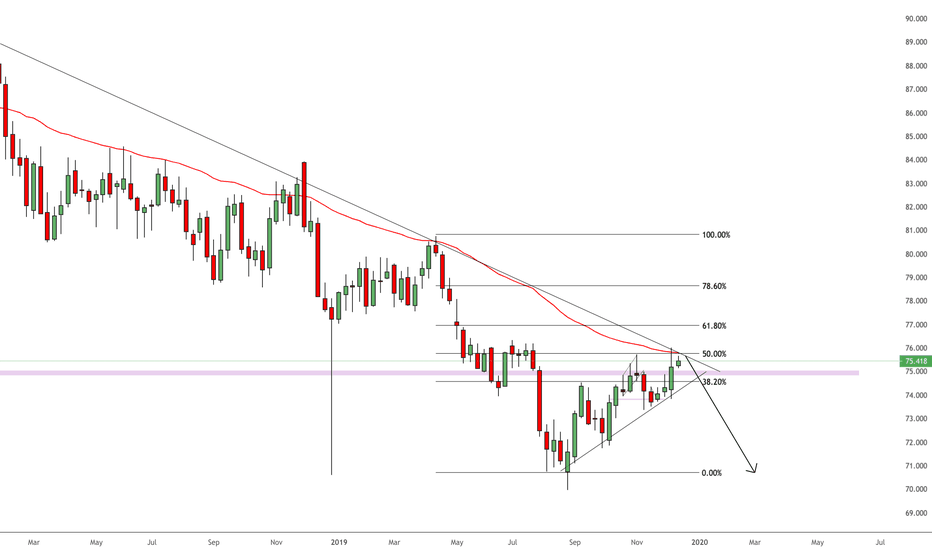
DXY Week 10th FebAfter seeing a big close on the weekly, I'm not seeing this too much as likely to push above the first target area, in the past week have seen, strong weekly closes, consolidation before falling back down again.
Currently seeing a larger expanding formation, which either way is inline for a sell-off. With that being said there is still a possibility for a retest of larger tops and previous highs.
Got a few USD pairs on the cards next week, so will be seeing how the DXY plays out.
I think from now on, every week I'm going to do a short DXY breakdown, hopefully people find value from it?
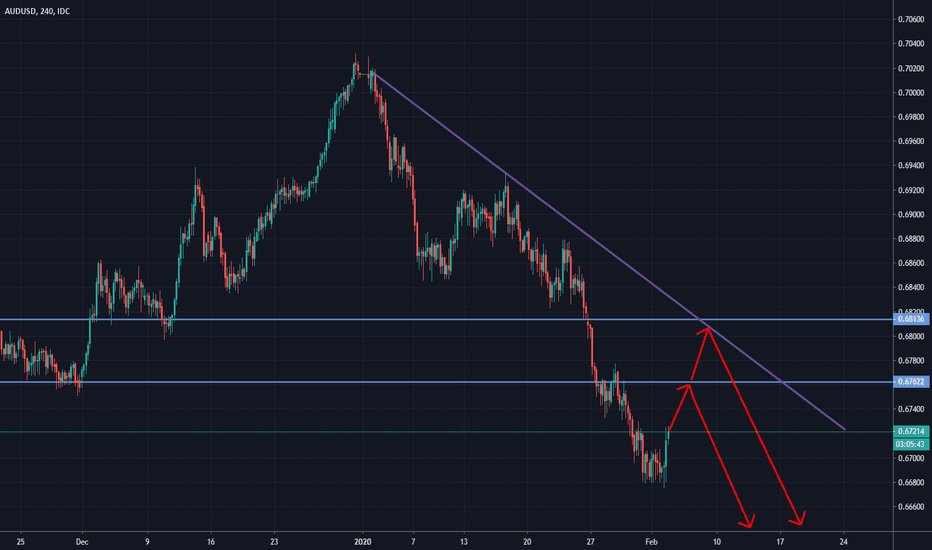
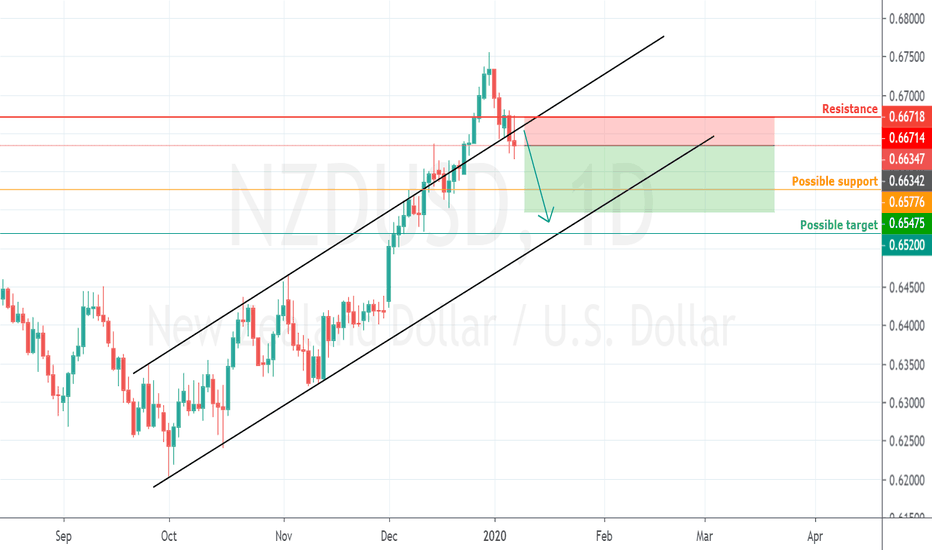
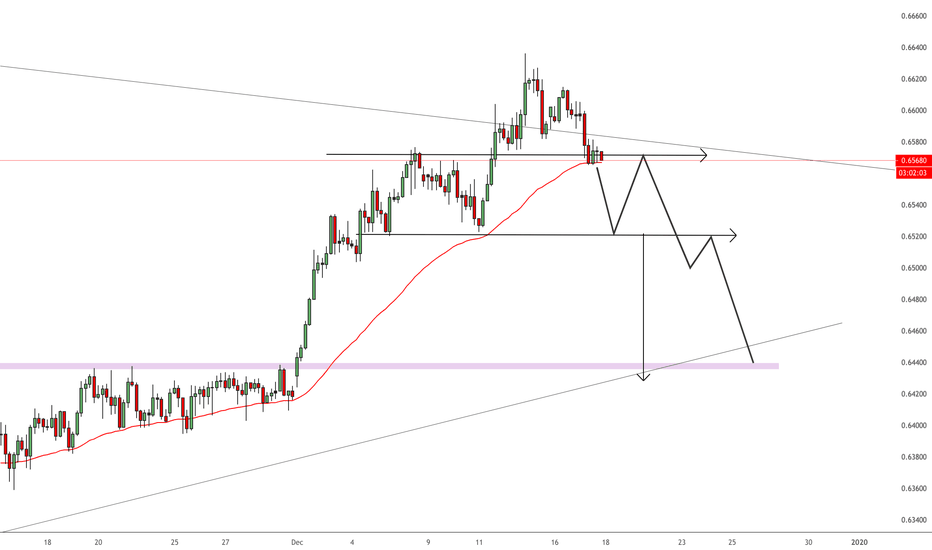
AUDUSD is near the Sell Zones...We're in downtrend in H4 chart. Currently we expect correction and rise to 0,6762 / 0,6813 levels.
We will monitor the price exhaustion, when these levels are reached and we will looking for new sales opportunities.
Increase to 0,6762 may be occurred through the day.
GOOD LUCK!
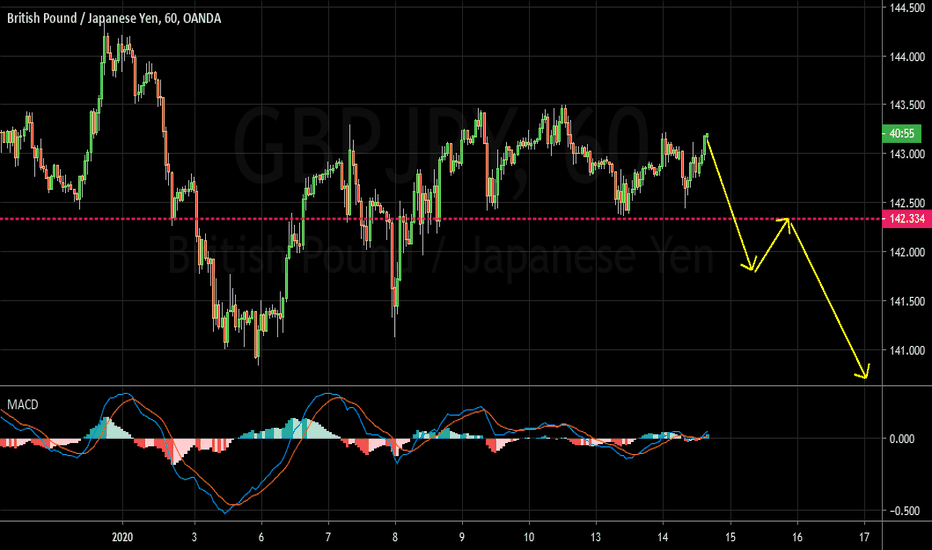
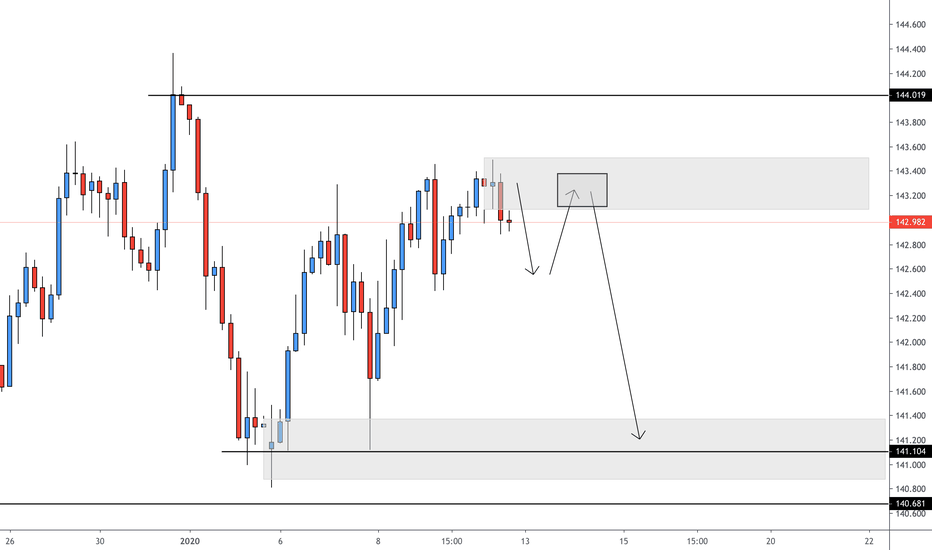
GBPJPY short (Supply Demand) First Video AnalysisHello Traders
This is my first video analysis. I chose my favorite pair GBPJPY. I hope you liked it. Please leave a like and tell me your view.
Also if you have any questions let me know in the comment section down below.
Thank you and we will see next time
- Darius.
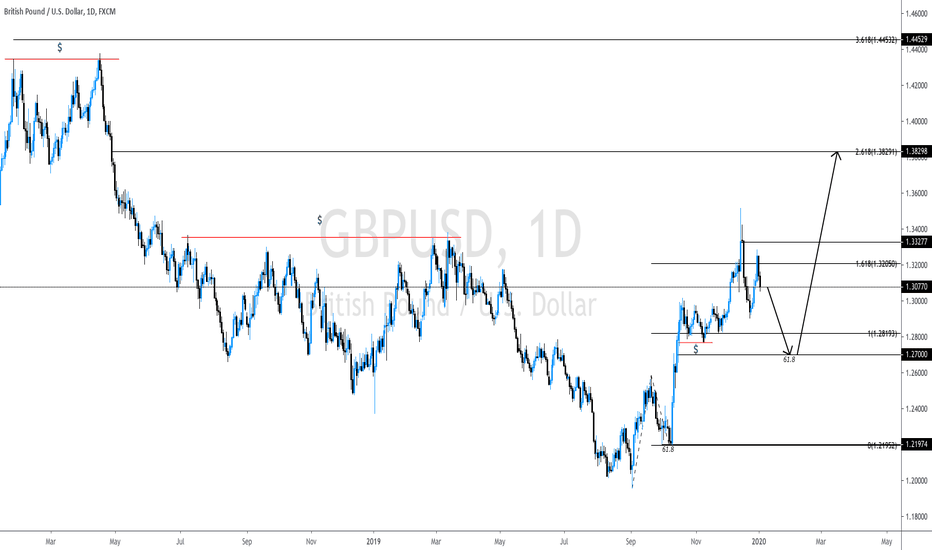
GBPUSD Trade Idea Sell to BuyEqual lows right above where the next 61.8 fibonacci retracement is. Also a whole number (1.27000) and could be the end of the correction and beginning of next bullish cycle.
Next target is 2.618, as 1.618 has been breached over the last two weeks. Expecting a liquidity grab before moving up. Maybe even as low as 1.26000. If price does travel down that way, would just have to watch for signs of a floor.
Notice how 3.618 (target 3) is right above the overall target (and major liquidity zone) which is also easily seen on the weekly chart.
2.618 is also the bottom of the distribution zone.
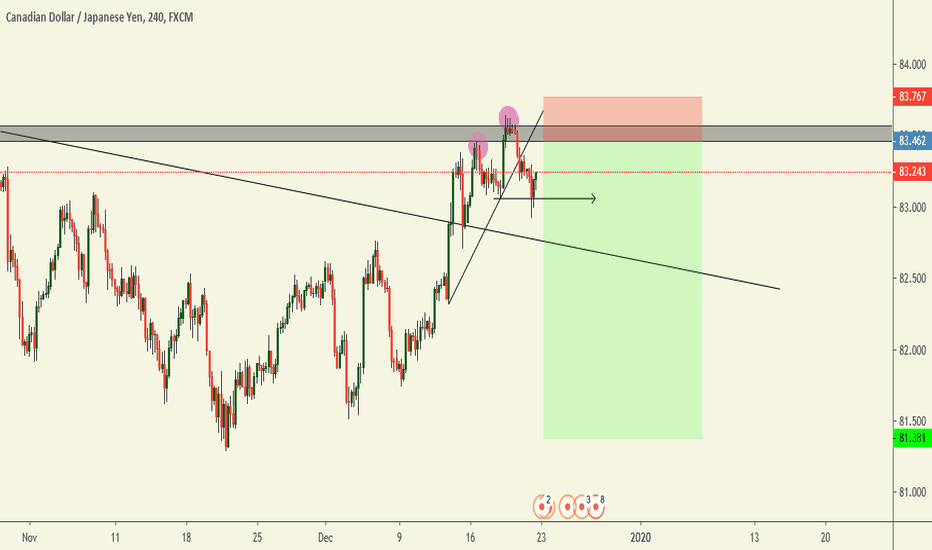
CADJPY POTENTIAL SELLnice potential head and shoulders forming off daily resistance. If we get a nice rejection off the right shoulder and .500 key level we could see CADJPY fall out the sky. We also have a brilliant counter trendline break. brilliant risk to reward. big cad news on Monday but apart from that we should see a relatively slow week coming into christmas
