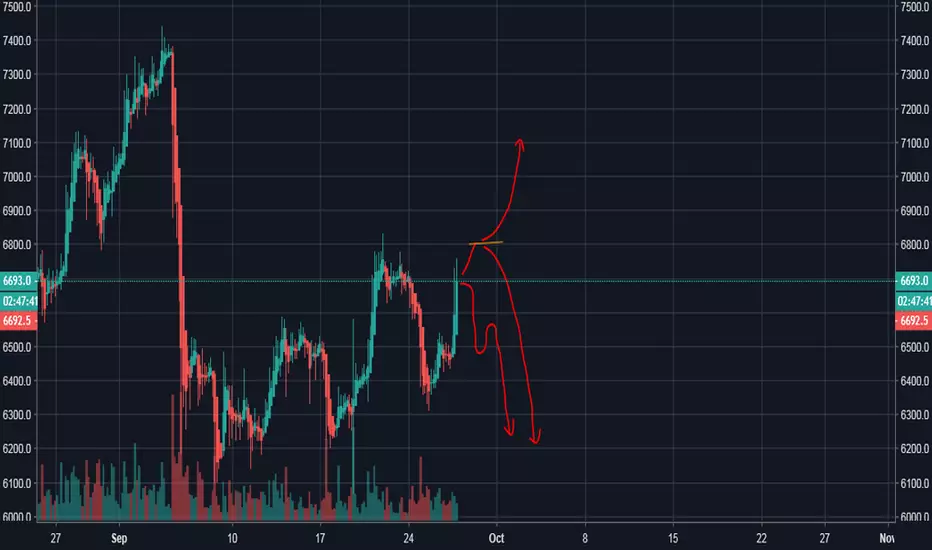
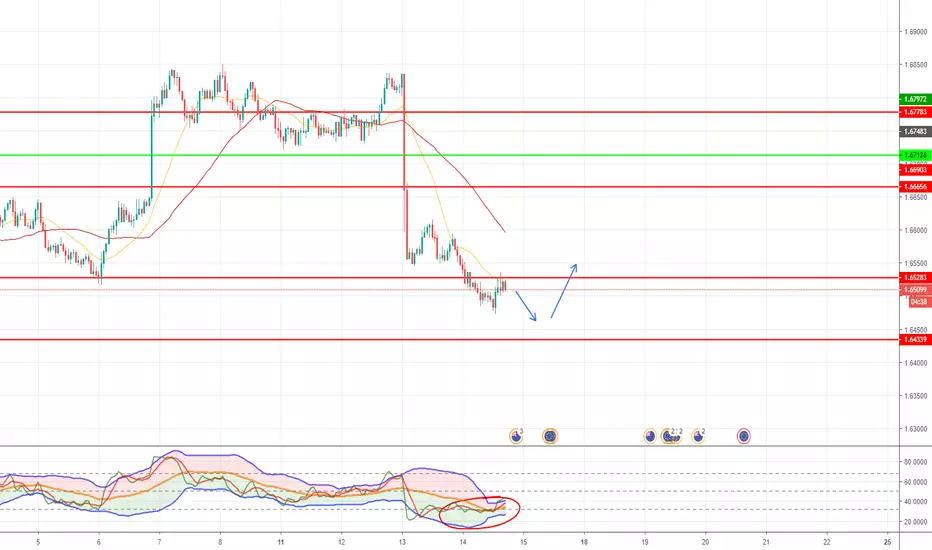
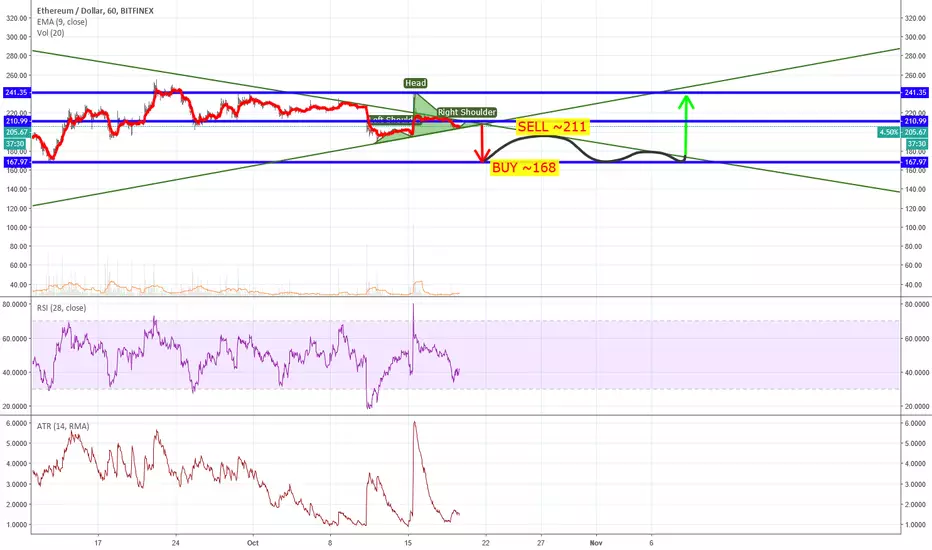
Sell-buy

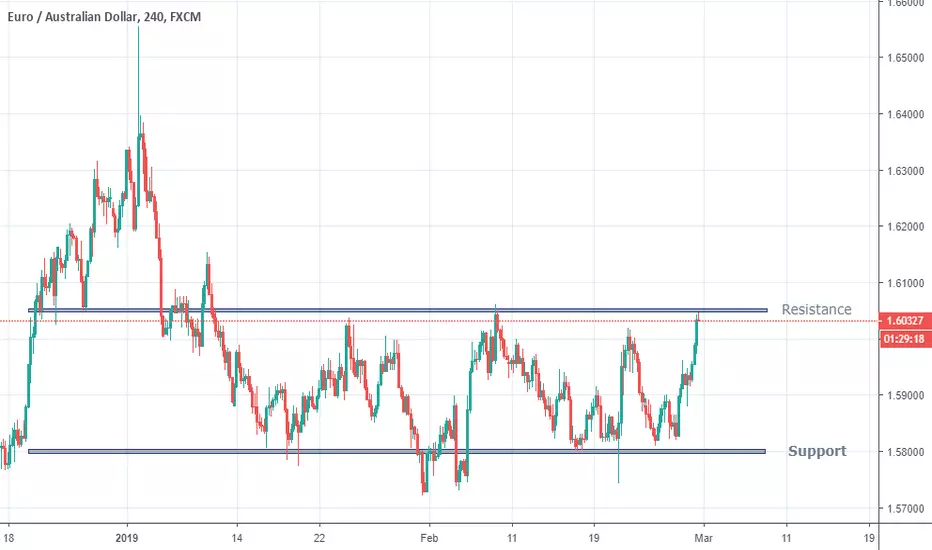
EURAUDSupport and Resistance comes into play on 4 hour time frame. Are we gonna break Resistance or retrace back to Support ??? Bulls or Bears???

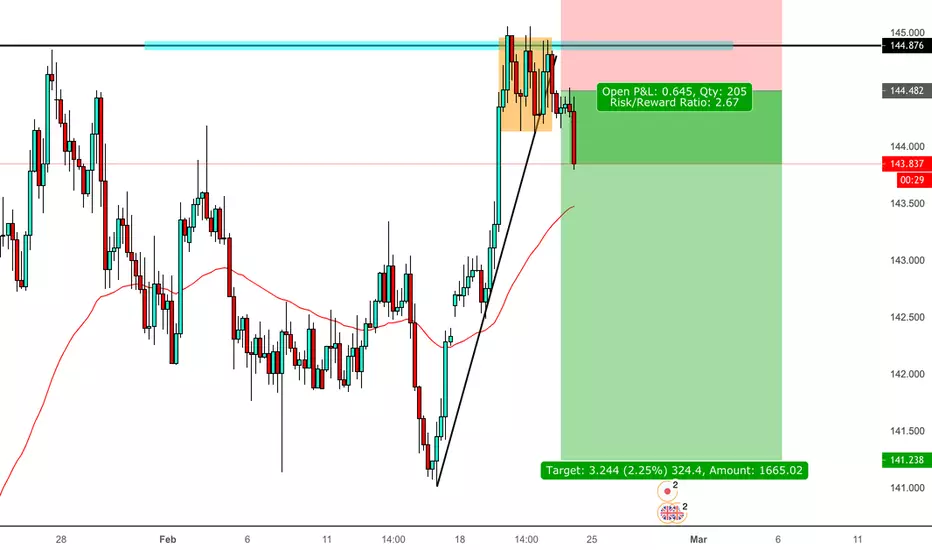
ECA Entry pointsNYSE:ECA
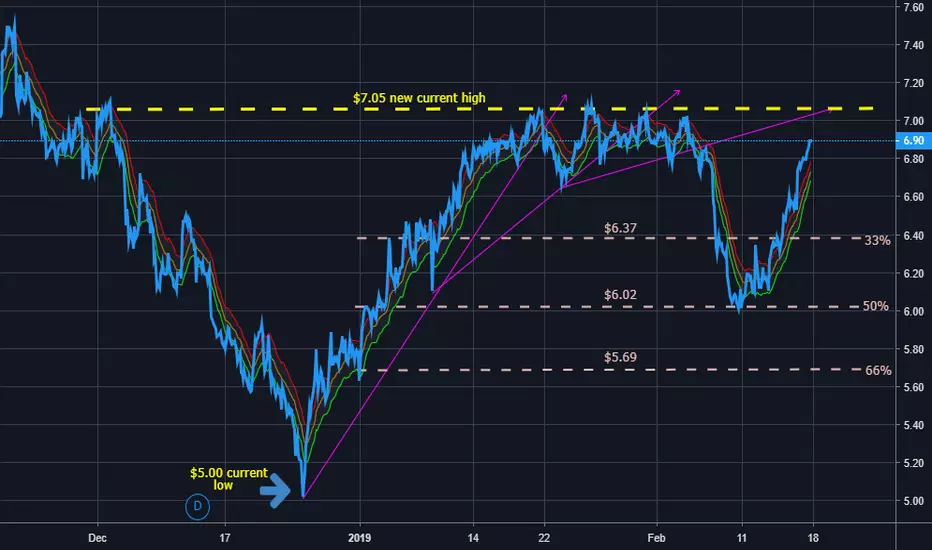
Retracement lines indicating what area's will be a good buy point. Most likely around 50%
Could be 33% if it consolidates there for awhile.
Wouldn't recommend buying at 66%.
Sell safely at $7.00.
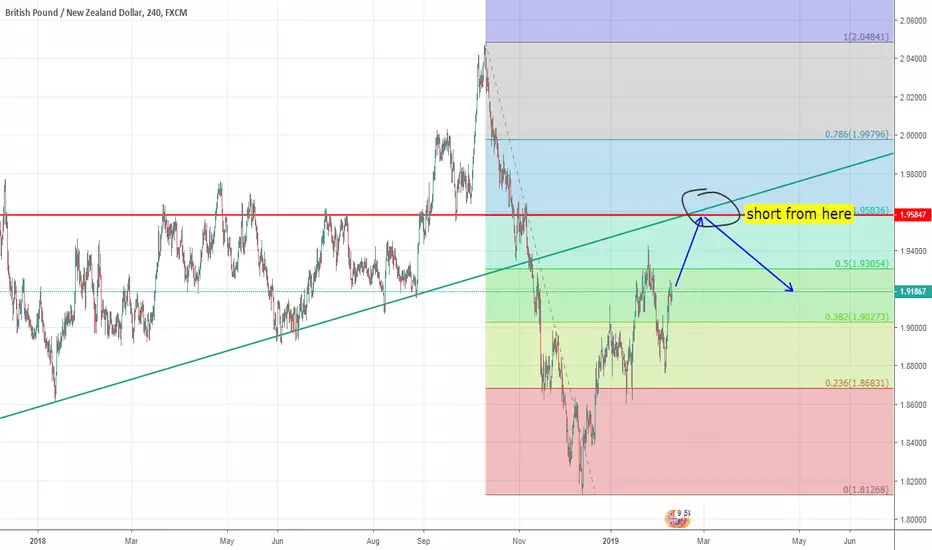
GBPNZD, SHORT SELL SETUP (POSTPONED)SELL at 1.957 (postpones sell order)
No SL at the moment (will be updated if required).
Stay focused and good luck!
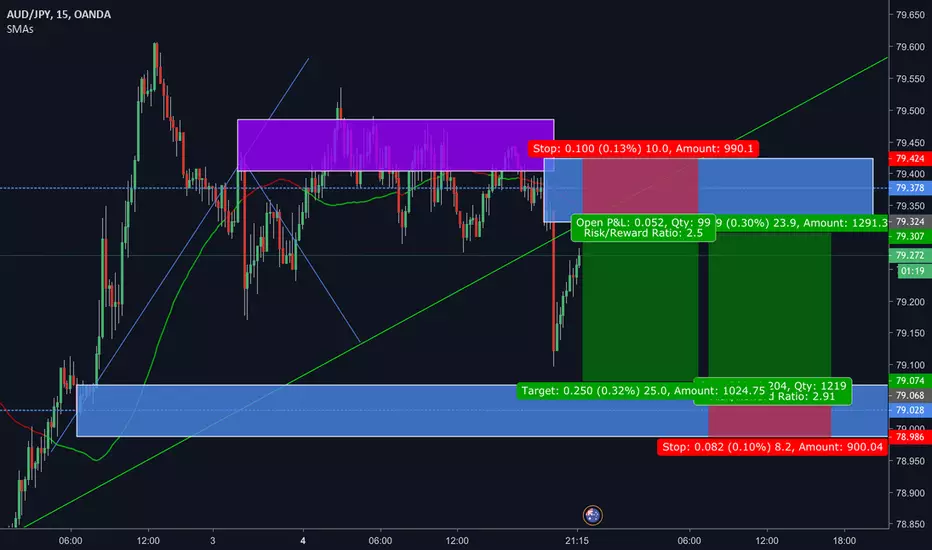
AUDJPY SELL & BUY A Supply and Demand Zones (both in blue blocks) I just noticed on the AUDJPY 15min chart. One will certainly trigger. I have more faith in the SZ since price broke so many levels to create a reversal, not to mention breaking my green trend line, which was created on the 1h. If price returns to that zone, I expect it to continue the drop. And maybe there are enough buyers in the DZ to get at least a 1:1 RR on a retracement rally.
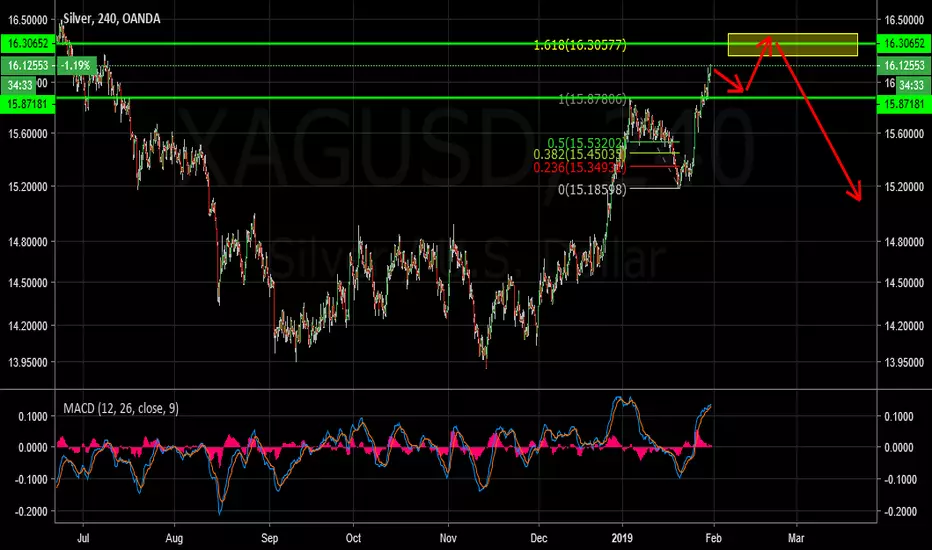
Silver Double ScenarioH4 - We may now expect one more push lower from the current zone and then the price to move higher towards the critical zone.
Once the price reaches the critical zone, we may look for evidences of bearish pressure and then start looking for sells.
In the short term we may look to buy pullbacks with bullish evidences and in the mid term we may look for sells with bearish evidences from the critical zone.
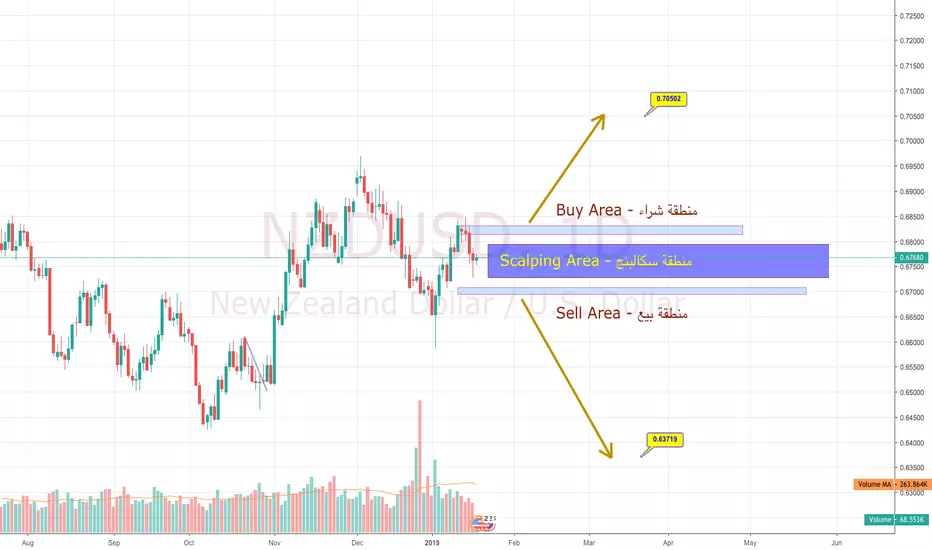
NZDUSD - D TradingDear Trader,
As you can see here with our chart NZDUSD - Daily, we have a Scalping area.
as you know this position for longterm maybe it will take 2 - 4 weeks. but with good profit when you good manage your account.
A) When the price close above Buy area we can buy it and our target as mention on the chart.
B) When the price close below Sell area we can sell it and our target as mention on the chart.
Good Luck, God with you
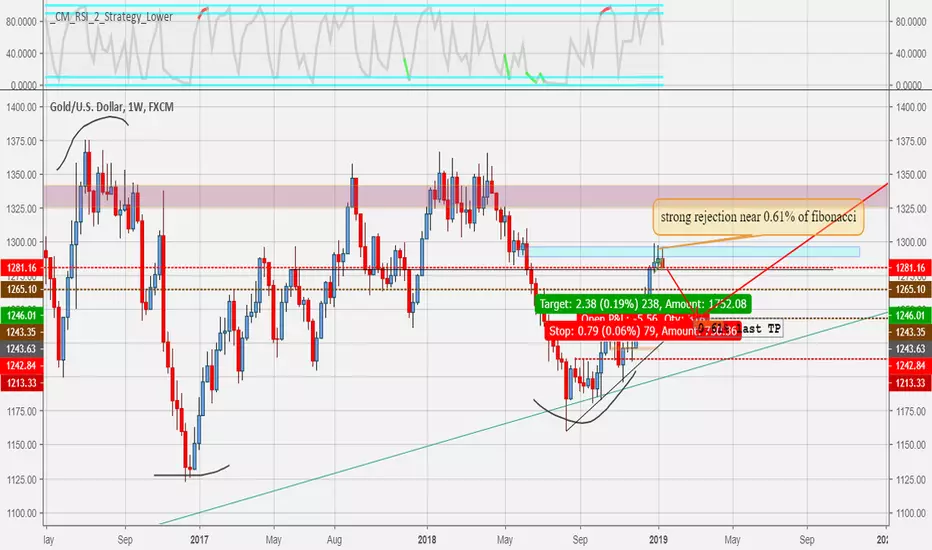
Possible short and mayor longRetrace with a nice rejection (with good candles setup) near the 0.61% of fibonacci.
I see a wick till a retest of a daily trendline at near

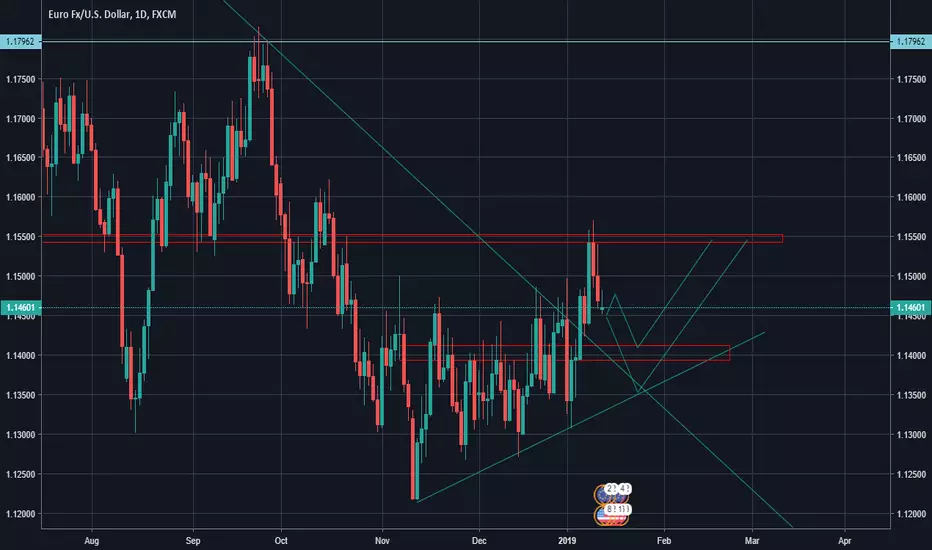
EURUSD brexit upcoming! RETEST imboundTechnical view: EURUSD breakout strong from the uptrend. A retest of the Trend is upcoming. After the retest we expect a run for the EURUSD pair.
Fundamental view: The brexit hearing on the 15.1 is coming fast, many news and a lot of uncertainty among investors. We expect the shutdown of the brexit program, which will make the GBP rise and EUR fall a bit, but it all comes together. The retest must happen to continue it's path north.
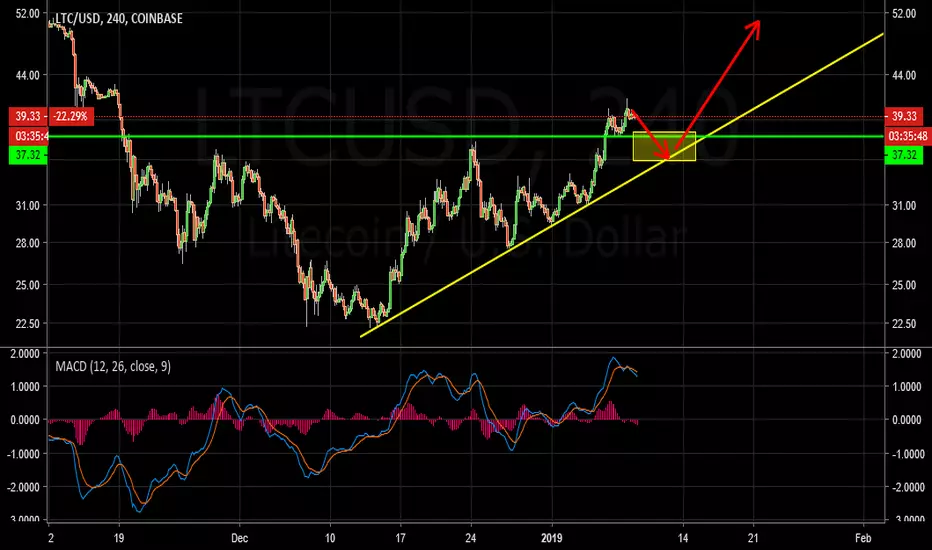
Litecoin Double ScenarioD1 - Bullish convergence, we have a good uptrend line.
We may look for short term sell opportunities and longer term possible buy opportunities.
H4 - Bearish divergence. We may currently look for short term sells with more bearish evidences.
Later on we will focus on possible buys. The zone marked in the box is critical to hold (the breakout zone and the uptrend line). If that zone is broken down, then this buy idea is invalidated.
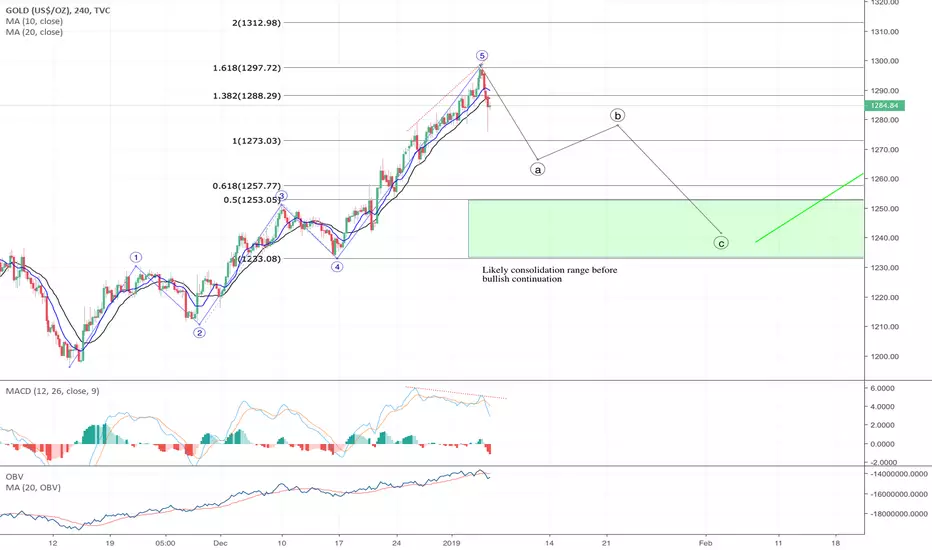
Gold Bearish Reversal – Elliot Wave AnalysisGold has just stopped a couple of points short of the statistically significant $1300 mark and it looks like a reversal is likely at this time.
As you can see on the chart, the precious metal has completed a very typical impulsive Elliot wave structure with the 5th wave extending to a key Fibonacci point at 1.618% (Fibonacci extension of wave 3) at price $1298.5. This idea is linked to my previous gold analysis.
This structure of the Elliot wave pattern is different to common equity analysis as the extension is on the 5th leg rather than the 3rd leg. This is a common pattern for commodities but rare for other asset classes. This subtlety further strengthens my view on a reversal for gold in the near term.
Furthermore, there is a clear divergence in the MACD indicator as illustrated by the dotted red line. This is a significant reversal indicator as it highlights that the momentum on the trend is beginning to fade and a reversal is likely.
As such, I believe a reversal is likely given that there is confluence of multiple indicators, chart overlays and chart patterns. The reversal will likely follow a corrective zig-zag pattern (ABC) with it completing the 3 wave structure between 3 and 4. In my experience, most corrective patterns complete between wave 2 and 3 if a wave 3 extension has taken place. However, since wave 5 has extended in our chart, it will likely see consolidation between 3 and 4 (green rectangle area).
Also bear in mind that there is a chance that gold can continue to rise to the next Fibonacci level at $1312. Fundamental analysis at the moment is a mixed bag and as such we need to proceed cautiously. We currently stand within a complicated market environment where some strategists believe that there will be no more Fed rate hikes for 2019, a sign that the next recession is closer than expected. Conversely, some believe that the bears have had enough and the bulls are back in play for equities.
For a potential sell trade, wait for the confirmatory downward cross in the MA (20) and MA (10) on at least a 3H chart (4H is preferred).
A stop loss can be placed above $1293 (just above the maximum turning point of MA (10))
A take profit can be placed at $1253
Some things to keep in mind that will determine the future performance of equity markets and thereby gold prices:
• Interest Rate Hikes – a cease in rate hike will likely push equities up higher in the short run
• China US Trade War – Apple’s repriced forecast may be a catalyst to end the trade war, returning much needed confidence back into equities
• US Economic Data – Keep an eye on Purchasing Managers Index(PMI), GDP, Unemployment rate and inflation rate
Chart Indicators
Moving Average (10)
Moving Average (20)
Moving Average Convergence Divergence (MACD)
Accumulation/ Distribution with Moving Average (20) overlay
Suportes e ResitenciasEstamos em um cunha de baixa, se passar dos 3620 na Bitfinex podemos ter um bull run, por outro lado podemos buscar os 3k
AUDUSD in 60minAUDUSD is short in 60min for a while and wait for the break out when it has touched the yellow line


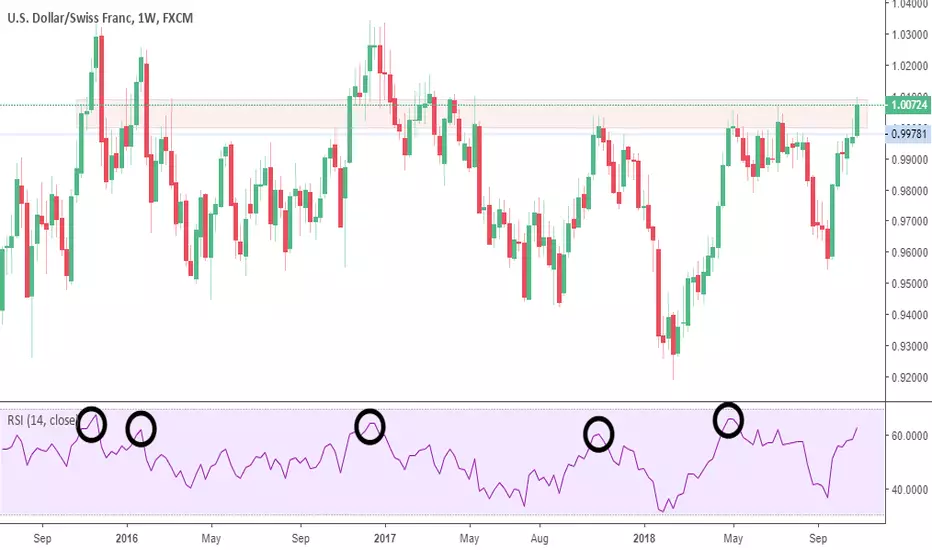
USDCHF Critical AreaUSDCHF: If you look at the weekly, and go back a few years, it's evident that when RSI is close to being overbought, it drops, dramatically! I have circled these points.
The key here is to wait until the day/week closes to see where we stand. Very rarely in the past few years has it broke from this region, so this remains a strong resistance.
You can break it down as you go into the lower timeframes, but this is big picture.
If this was helpful, hit the like button.
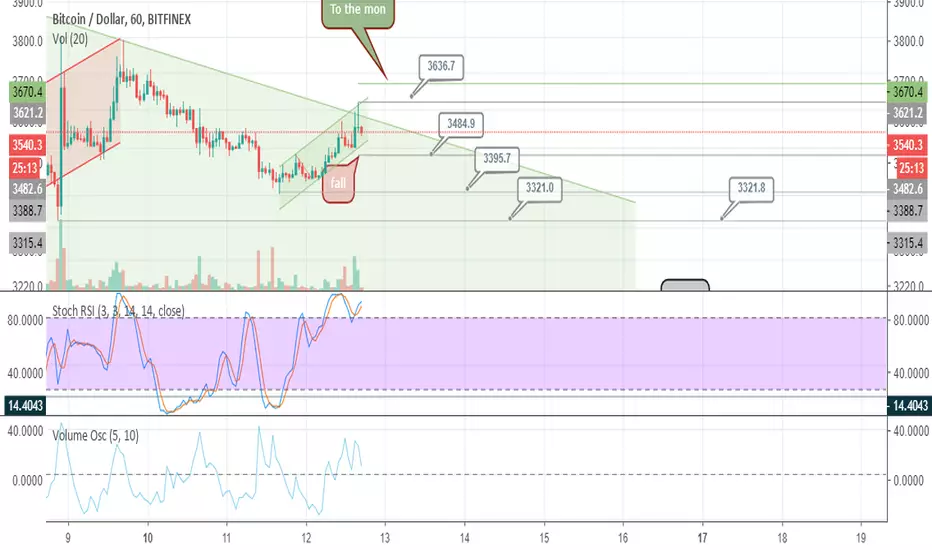
Very Important Moment in Bitcoin LifeIn the next hours Bitcoin fate will be decided.
My advise is to be out of the market till the end of September as a lot of manipulation will happen in the next day or two as Bitmex September Contract and CME Bitcoin futures contract end in 28 September and that ETF rumor is also in 30 September. Take care guys!