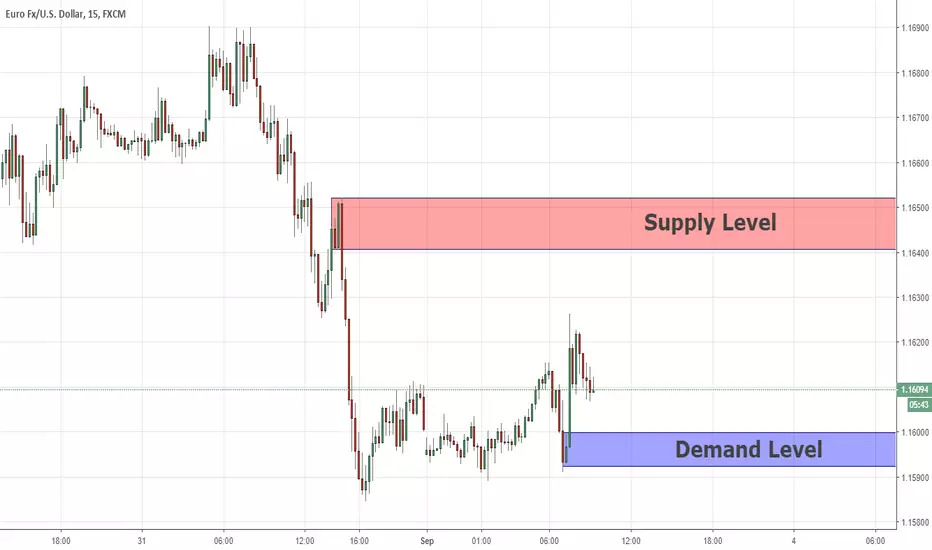
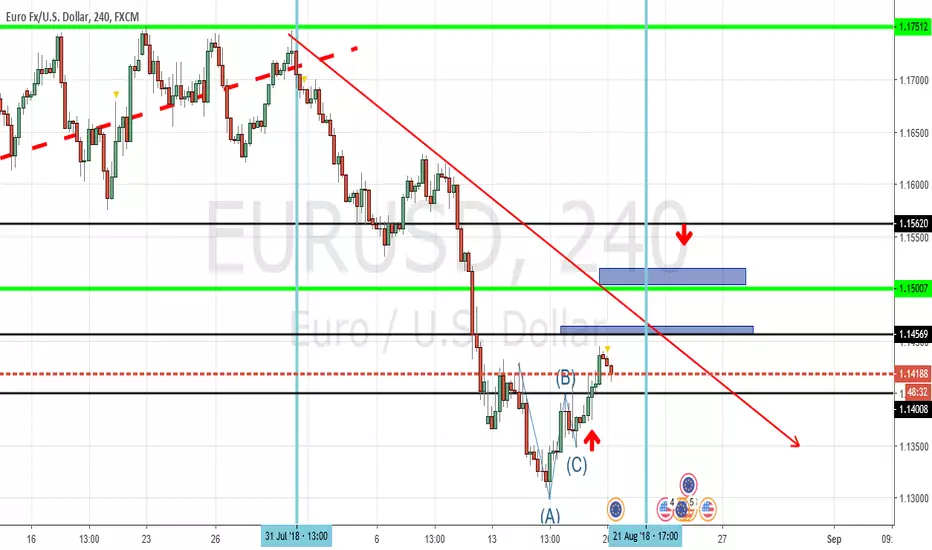
Short Terms Analysis EURUSD 03/09/2018Those are the next key levels for short terms position on EURUSD.
For the short terms, the price seems to tend the supply above.
The demand below is a great continuation level of buy position as long as the
Price didn't reach the supply yet. I'll buy at this demand, and my target will be the supply above,
Which is also a great level of intraday sell position.
Sell-buy
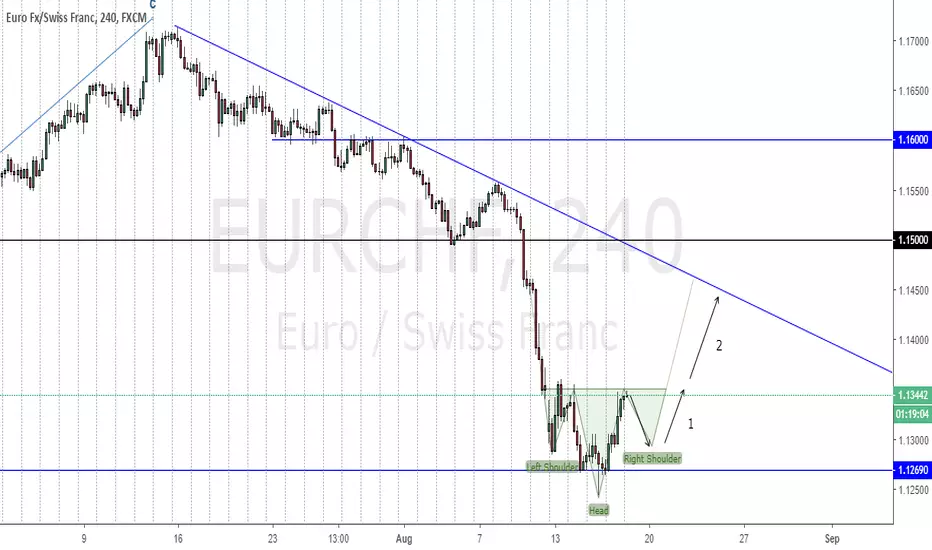
EURCHF forming a SHS pattern??EURCHF completed the bearish movement and now the price could make a big correction. In order to do this, I am seeing a Head and Shoulder Pattern to reverse until trend line.
Let´s wait for final confirmations(candle) to enter on a couple of trades.
EURJPYLOOKING TO SELL AFTER A CANDLE CLOSE BELOW THE ORANGE TRENDLINE
AND
LOOKING TO BUY AFTER A CANDLE CLOSE ABOVE 130.00 ROUND LEVEL

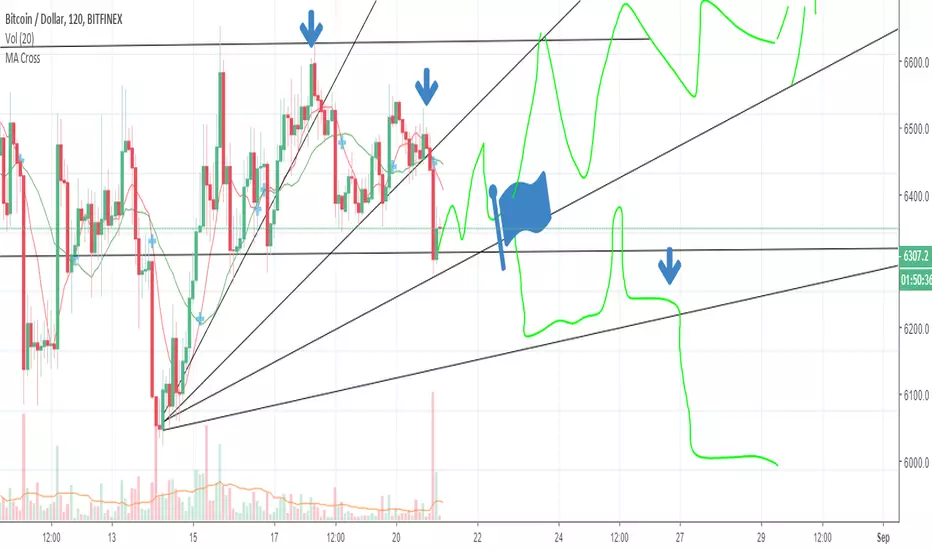
Bitcoin ETF Rejection Again! (According to CNBC)Bitcoin ETF Rejection Again! (According to CNBC)
But no sign of huge selling pressure so far
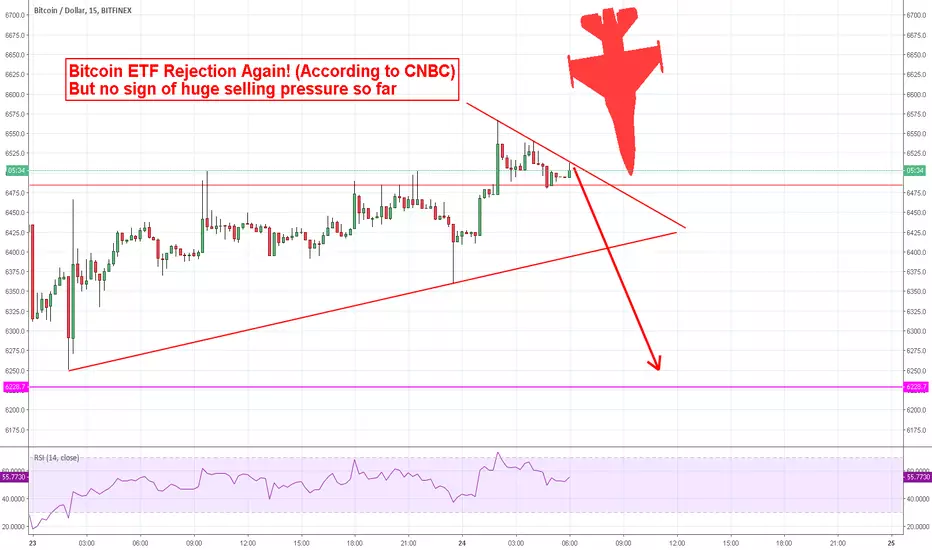
ETF D -2
We have more than 2 days to wait for the ETF
the investor remains wary
I see 2 radical scenario
if the ETF accepts:
we're going on a dry pump
if the ETF is refused it is the fall
very obvious analysis but she especially wants to say placed stop loss
wait the dip
enjoy
UJ- GREAT RISK REWARDits sell stop :)
Don't forget to breakeven and respect your money management PLS !
USD/JPYThis pair is in for a big week next with either a major push to the upwards or downwards. after being in a corrective stage most of the week, we saw a major impulse as expected as it broke through our trend line. i expect further downside as we collect more retail stages with another correct wave and then another push lower. lower lows are expected this week.
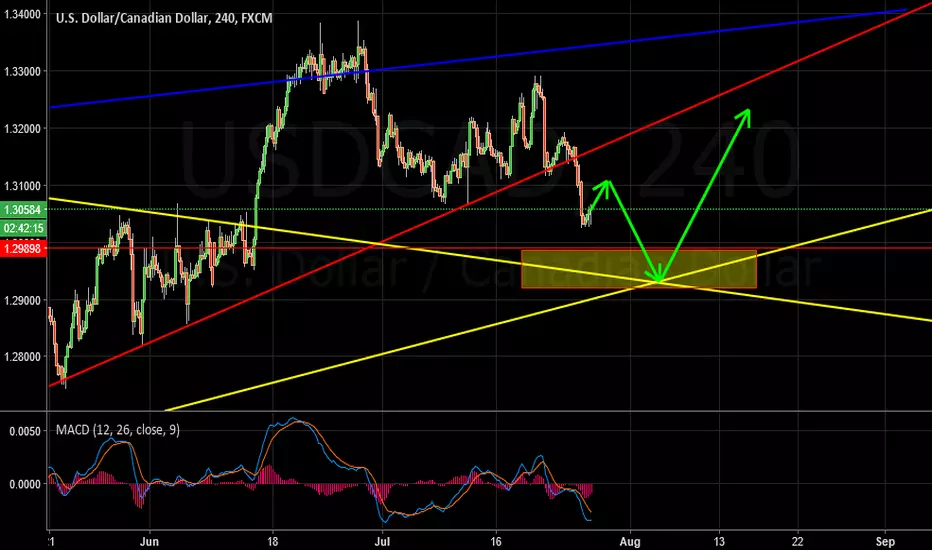
USDCAD Double Scenario H4 - We may look for a correction to happen now and once this correction completes itself, we may look for short term sells towards 1.29.
D1 - 1.29 zone is a confluence of Fibonacci expansion level and 2 trend lines.
Once the price reaches this confluence zone, we may look for longer term potential buy opportunities with bullish evidences.
LONG or SHORT? Dont Know? Just goin to have to wait! It either i'm goin LONG Or SHORT on EURCHF Daily ! Just have to a wait for a retest Pullback nearest top resistance 1.18134 , then goin SHORT if there a candle stick reverse pattern! OR if there a BREAKOUT on 1.18134 then goin to wait for it come back to retest1.18134 for a LONG since it trending up!

DOW JONES DOWNTREND FROM 24900 TILL 23300 BEFORE END OF JUNEMUST SELL NOW >>>>>>>>>>>>>>>>> DOW JONES FROM 24900 TILL 23300 BEFORE THE END OF THESE MONTH

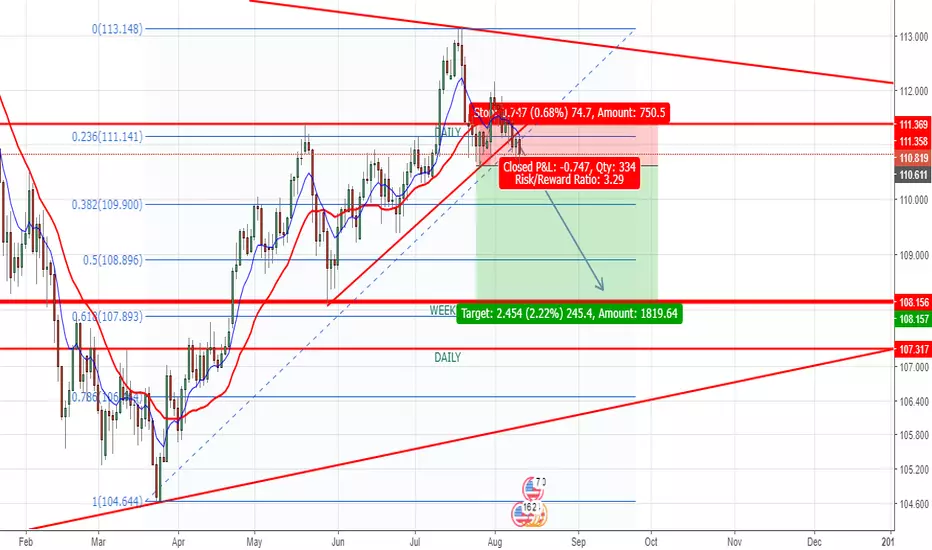
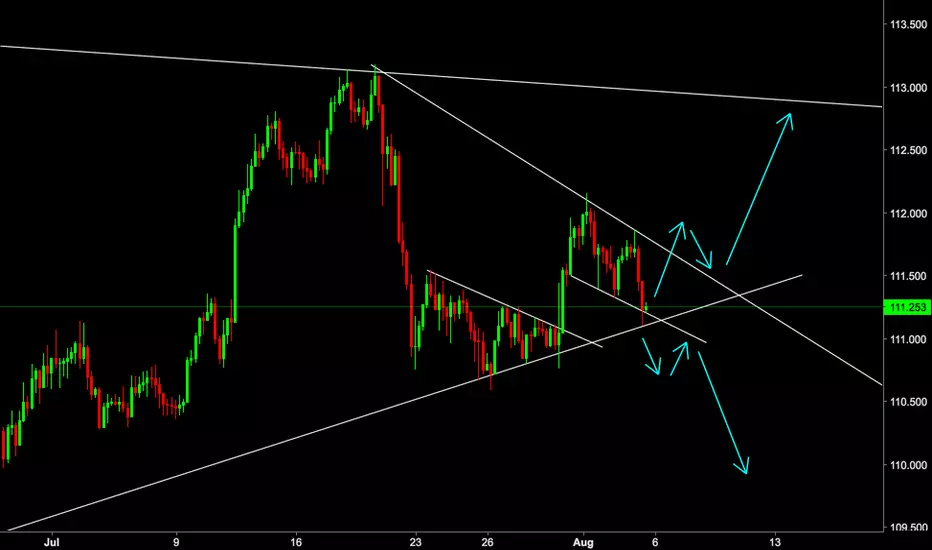
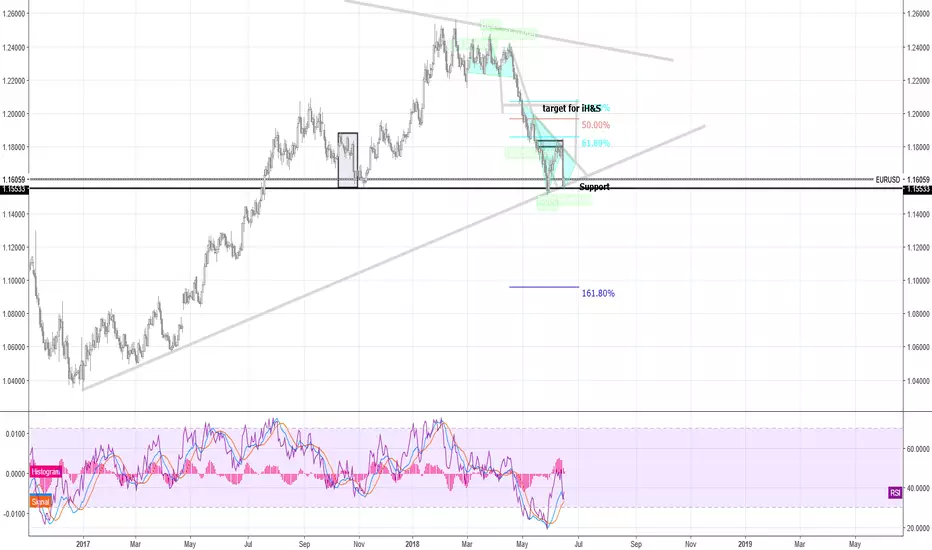
EURUSD quickieOverall the daily downtrend has consumed everyones minds and possibly their accounts. What we're seeing is a retest of 1.16. Now, we've seen this kind of bear candle before (highlighted in box to left) and so what we might expect is some consolidation.
Shorting is confirmed by the type of daily candle set on monday and Longing is confirmed right above the 1.159 area close to 1.16 depending on same conditions.
In the grand scheme of things we can still be shaping a bull flag in the weekly chart, or confirming the H&S pattern in the daily. Oversold levels in RSI and divergence insist on possible shorting for the next coming year.
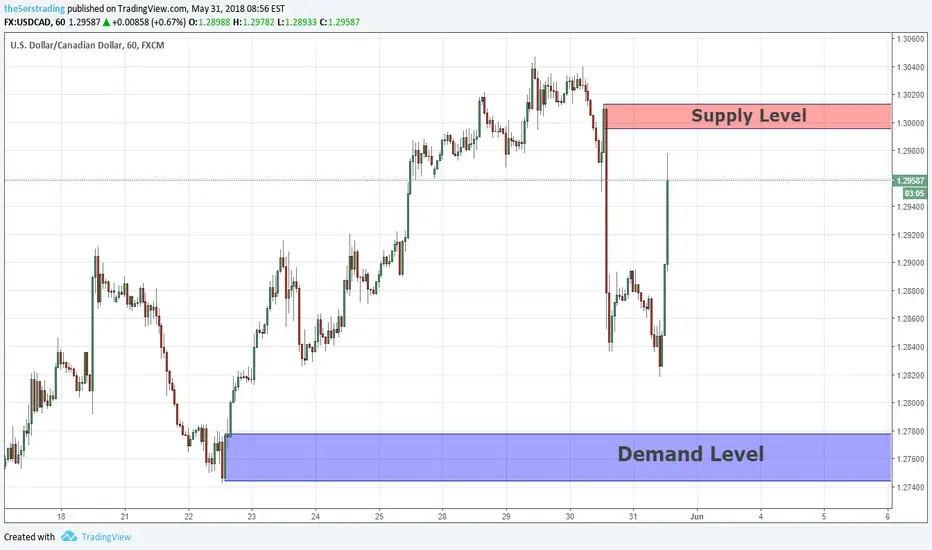
Swing Analysis USDCAD 31/05/18Those are the next critical levels to look for a swing position on USDCAD.
The supply above is a great one of sell position, the price drop from there very fast,
It seems there are more unfilled orders waiting for the price to come back, i'll sell at this supply,
The demand below is a great level of buy position, seems like Quasimodo level, i'll buy at this demand .
The5%ers Proprietary Trading Fund will double your trading balance every 10% profit.
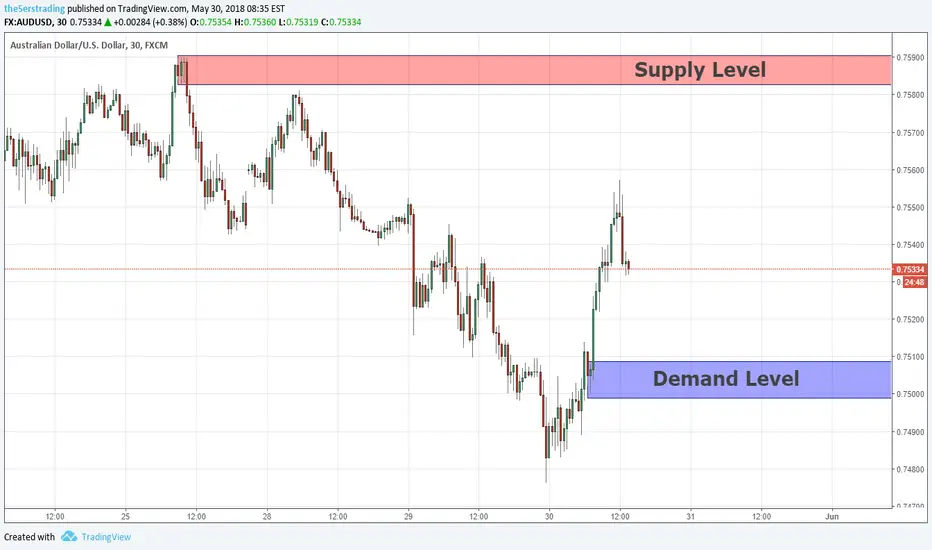
Intraday Analysis AUDUSD 30/05/18Those are the next key levels for intraday position on AUDUSD.
It seems the price on his way to reach the supply above, therefore
The demand below can a great continuation level of buy position, if
The price will back to this demand I'll buy there, my target will be the
Supply above which is also a great level of sell position, both levels are
Relevant for a day trade.
The5%ers Proprietary Trading Fund will double your trading balance every 10% profit.
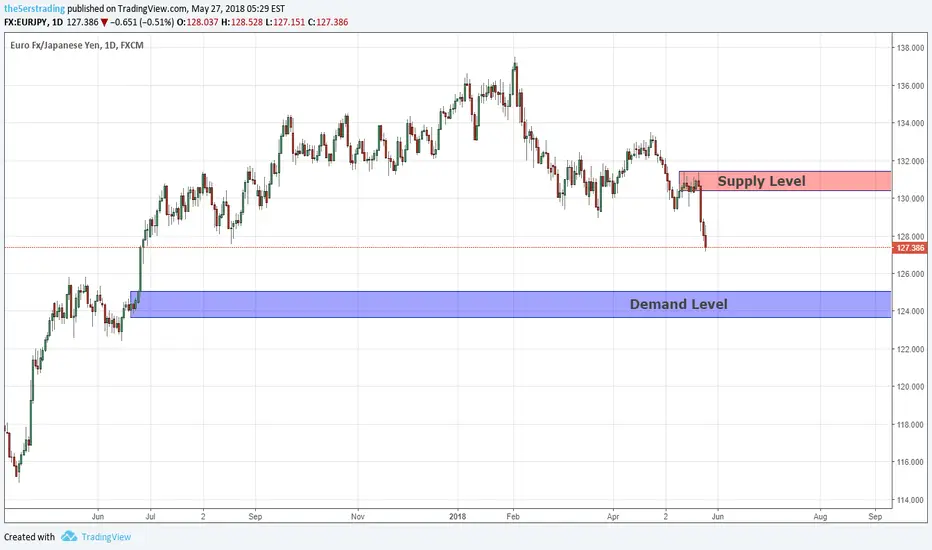
Long-Term Key Levels EURJPY 27/05/18For the long-term, the EURJPY is bearish at the moment.
The supply above seems like a great continuation level of sell position,
If the price will back to that supply I'll sell there, my target will be the demand below,
This demand below is also a great level of buy position, if the price will hit that demand
I'll buy there,
XAUUSD long term trades on long and big fallWe are having divergence all the way up and it is looking pretty correcting.
I would love to see it break that top before it starts falling but we are having big divergence between the last 2 top.
There is some space for one more spike tho.
If we do break the trendline and you see price consolidating there, do get in the sell.
If we tag the top, get in the sell with eyes closed.


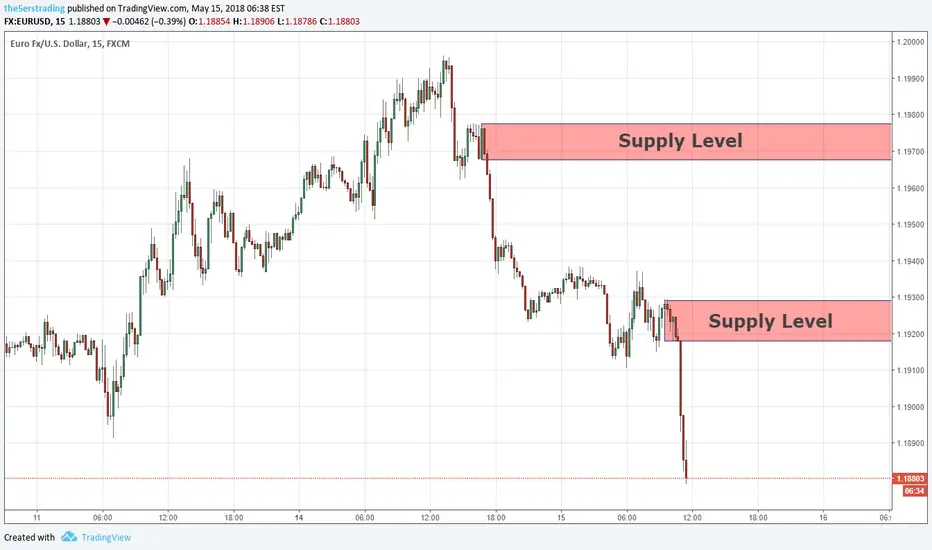
Intraday Analysis EURUSD 15/05/18There are a few options for intraday positions on EURUSD.
1- The supply above seems like a great continuation level of sell position,
If the price will back there I'll sell there,
2- If the price will break out the supply above it indicates the price tends to reach
The supply at the top, in that case, I'll look for a P"A setup for buy position and my
My target will be the supply at the top.
3- The supply at the top is also a great level of sell position, in case the price hit that
Level I'll sell there.
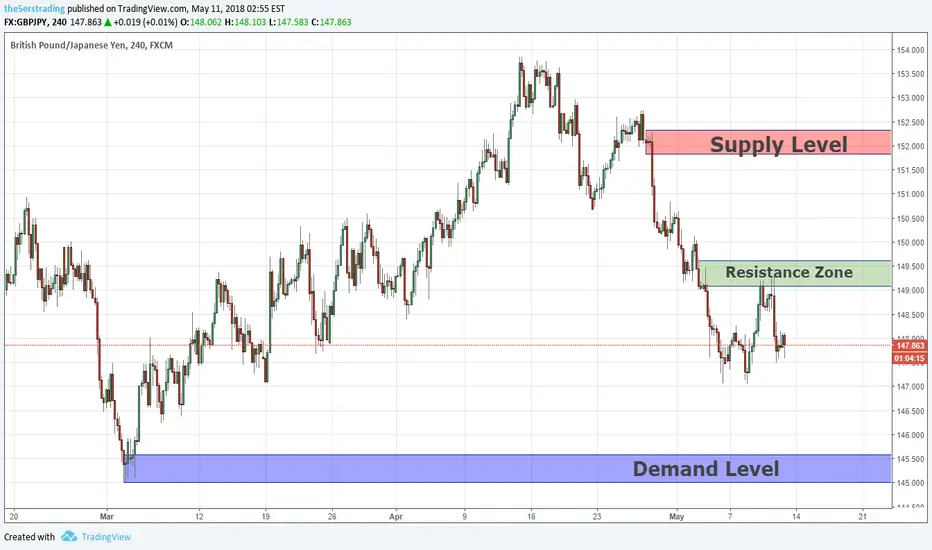
Swing Analysis GBPJPY 11/05/18For the swingers among us those are the key levels for GBPJPY.
At the moment the price seems to be bearish and most likely the final
Destination is the demand below, if the price will break out the resistance zone
I'll look for P"A setup of buy position with the supply above as a target,
This supply is also a great level of sell position and the target will be the demand below,
The demand below is a great level of buy position.
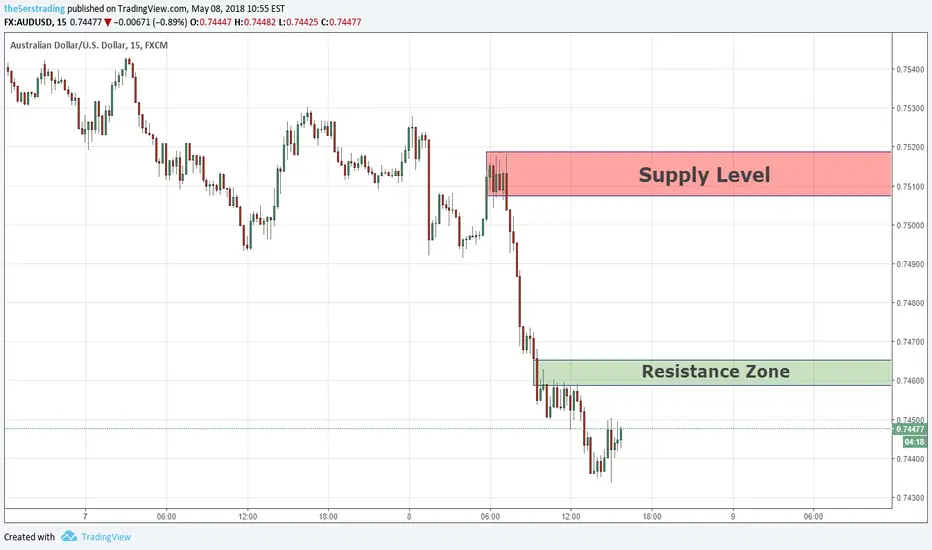
Day Trade Analysis AUDUSD 08/05/18Those are the key levels for an intraday position at AUDUSD.
If the price will break out the resistance above it indicates the price
Tends to reach the supply above, that scenario can create a signal for
Buy position in order to reach the supply, this supply level is a great continuation
Level of sell position, therefore I'll sell at this supply.
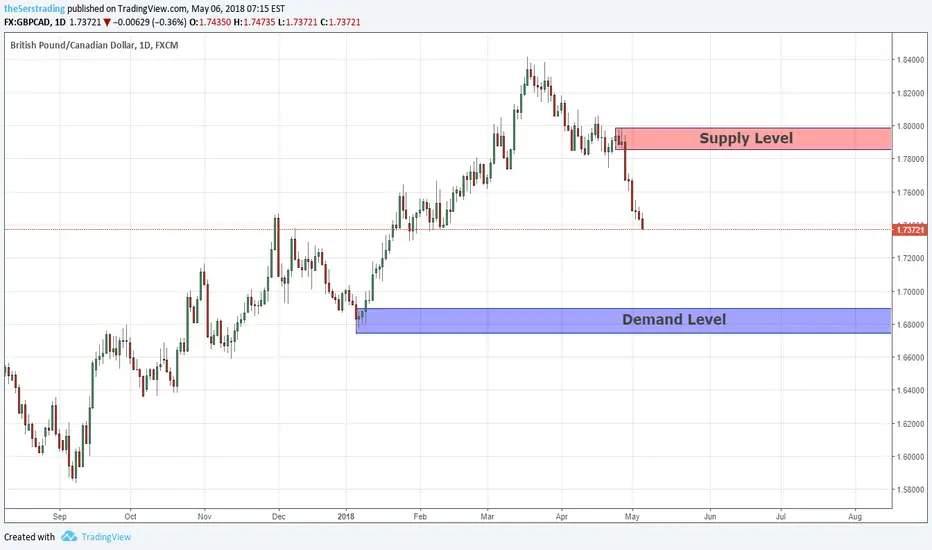
Long-term analysis GBPCAD 06/05/18Those are the key levels for long-term positions at GBPCAD.
For now, it seems the price is on his way to reach the demand below,
The supply above seems like a great continuation level of sell position,
If the price will back to this supply I'll sell there, and my target will be
The demand below which is also a great continuation level for the higher
Timeframe, therefore I'll buy at this demand.
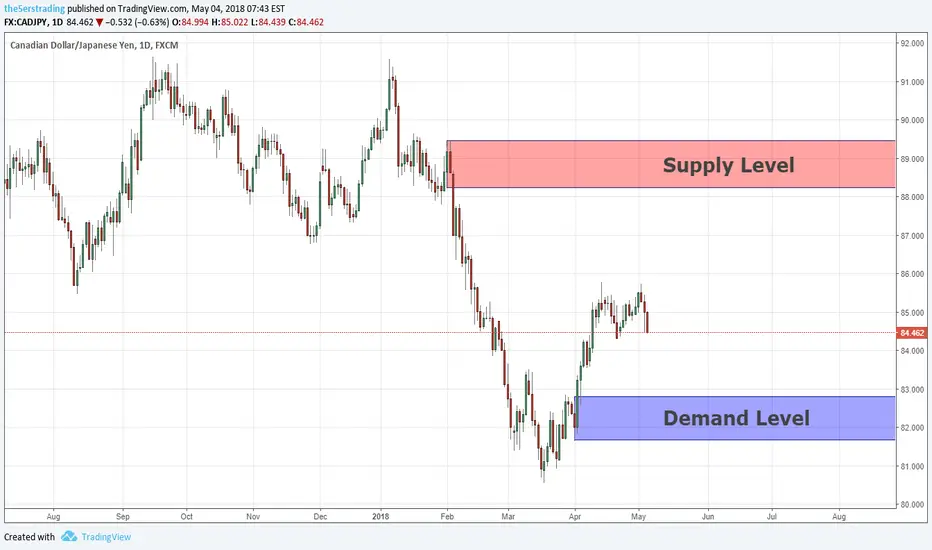
Long-term analysis CADJPY 04/05/18For the long-term, the CADJPY is bullish at the moment, it seems the price
On his way to reach the supply above, the demand below seems like a
Great continuation level of buy position, if the price will hit the demand
First, I'll buy there and my target will be the supply above which is also
A great level of reversal position, if the reach that supply I'll sell there.
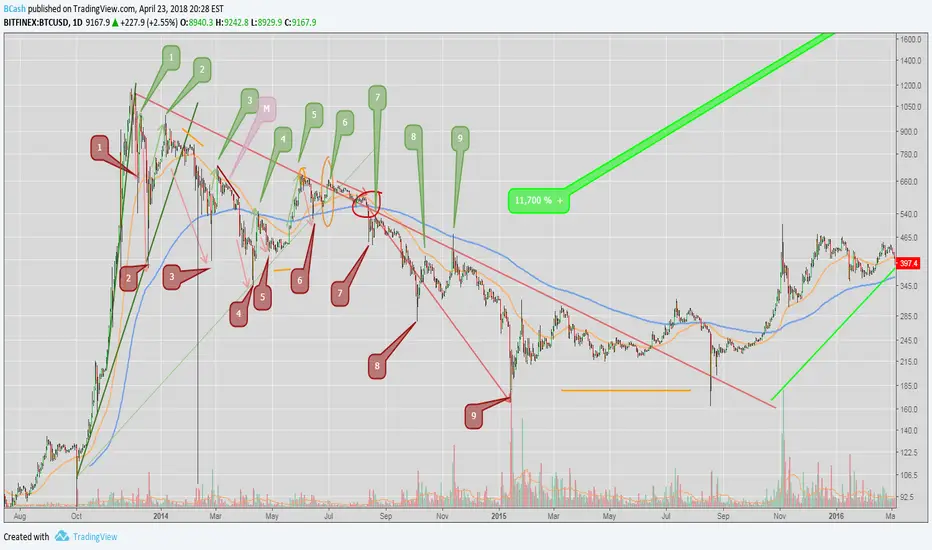
BTC Prices of 2014 vs 2018 (Part 2014)I am new to technical analysis however have been learning for the past couple months from some people like The Chart Guys, Tone Vays, and Carter Thomas ~ Thanks guys, you've been a huge help!
Make sure to check them out, as they all provide a different perspective on the market and crypto.
Anyways, I took a look at the differences between the 2014 cycle and the one we are in today here 2018.
This is the 2014 version that has the relative numbers associated with the 2018. (I will post this immediately after)
I hope you find this informational, I feel as if this is self explaining however please ask questions, point things out that you think I am doing wrong, call me bad names because I'm calling for a lower price... No matter what, I will use all information in order to better my trades and understand this market more.
I hope you are making the best out of your night
Best,
Brendan