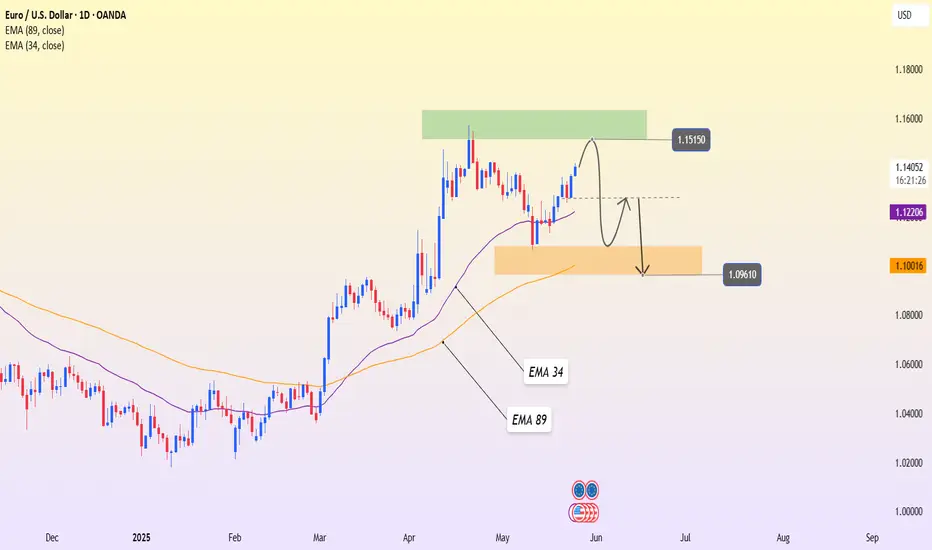
1.15150 Resistance Looms Amid EU Economic WoesOn the daily timeframe, EURUSD continues climbing toward the strong resistance zone around 1.15150 after a solid rebound from the EMA 34. However, the current candlestick structure shows signs of slowing momentum as price approaches a historically significant top — a zone prone to short-term profit-taking.
The technical setup becomes even more relevant when viewed alongside macroeconomic developments: the U.S. has just announced an extension of its 50% tariff deadline on EU goods from June 1 to July 9, temporarily easing trade tensions. However, the European Commission has revised down its Eurozone growth forecast for 2025 from 1.3% to 0.9%, highlighting persistent structural weaknesses and economic risks in the region.
The likely scenario: EURUSD may face rejection at 1.15150, followed by a pullback toward the support area around 1.09610. This zone aligns with the EMA 34, EMA 89, and a previous accumulation range. If this support fails to hold, the medium-term trend could shift clearly to the downside.
Sell-buy
May 26 US30Let's get to work... Price at the moment is trending down, creating lower highs and lower lows on the 4hr. However it broke structure on the 1hr and is trending upward.
I'm going to wait for price to get to 42,055 level and wait for it to break and retest for a buy or break structure for a sell.
Caution. Monday is a holiday so I most likely won't trade until Tuesday.
And ultimately whichever way price goes I'm going to get out at my net key level.
Have fun, stay safe and enjoy your journey

XAUUSD – Signs of Weakness at the Pressure ZoneToday’s market has low trading volume as both the UK and the US are on holiday. This makes price action more prone to “choppy” movements within a narrow range, and technical signals tend to become more reliable.
Gold is approaching a strong resistance zone around 3,420 – a level that previously triggered a sharp drop in early May. Based on the current technical structure, it’s clear that gold is entering a “pressure zone,” as upward momentum slows down and recent candles start to show hesitation.
The most likely scenario is a rejection at 3,420, followed by a pullback toward the 3,250 support area – where EMA 34 and prior accumulation volume converge. If this zone fails to hold, the next target could be around 3,170.
We don’t always have to “call the top,” but this is definitely a time to dial back bullish expectations and closely monitor price action in this sensitive area.

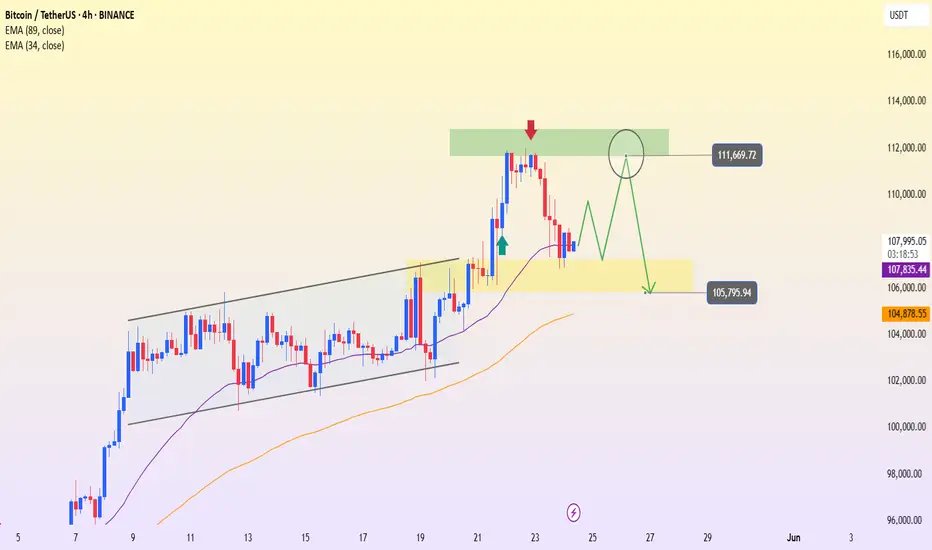
BTCUSDT – Hitting resistance, is selling pressure returning?Bitcoin is showing signs of losing momentum after touching the resistance zone around 111,669. On the H4 timeframe, the previous bullish structure has stalled with a series of red candles and a clear pullback, bringing price back to test the EMA 34 zone.
In terms of news, although the market remains excited due to expectations surrounding a Bitcoin spot ETF, many large investors are starting to take profits after the recent sharp rally. This is causing selling pressure to slightly outweigh buying in the short term.
The most likely scenario now is that BTC could make a mild upward move to retest the 111,600 area – but if it fails to break above, a reversal back toward the support zone at 105,800 is highly probable. This area aligns with the EMA 89 and a previous accumulation zone.
Current strategy: don’t get caught in a false breakout. Instead, watch the 111,600 area and wait for a clear signal. If a reversal candlestick pattern appears, short-term sell entries may be considered with a target near the lower support.
EURUSD – Testing Key Resistance, Signs of a Pullback EmergingEURUSD is gradually approaching the strong resistance zone around 1.142 – a level that has rejected price at least twice in the past. The recent bullish momentum is clear, but the current move is nearing a major barrier, increasing the likelihood of a short-term pullback.
If the price fails to break this zone and rejection signals appear, a drop back toward the support area around 1.125 is highly possible – this level aligns with the EMA 89 and recent swing lows. It will be a key area to watch where the market might “take a breath” before deciding the next direction.
The current strategy is to patiently observe price action at this resistance zone. If confirmation appears, this could offer an opportunity for short-term sell setups. However, if the price decisively breaks above 1.142, the bearish scenario would be invalidated.

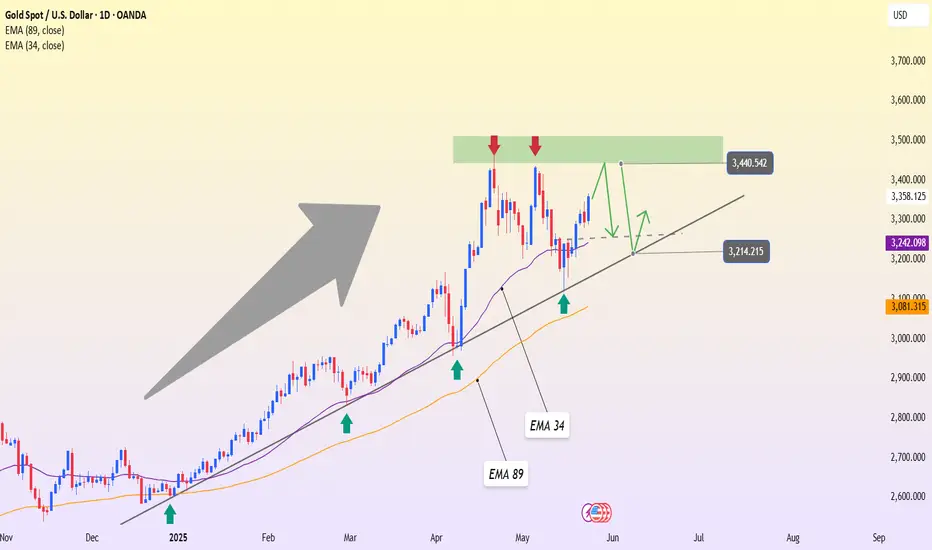
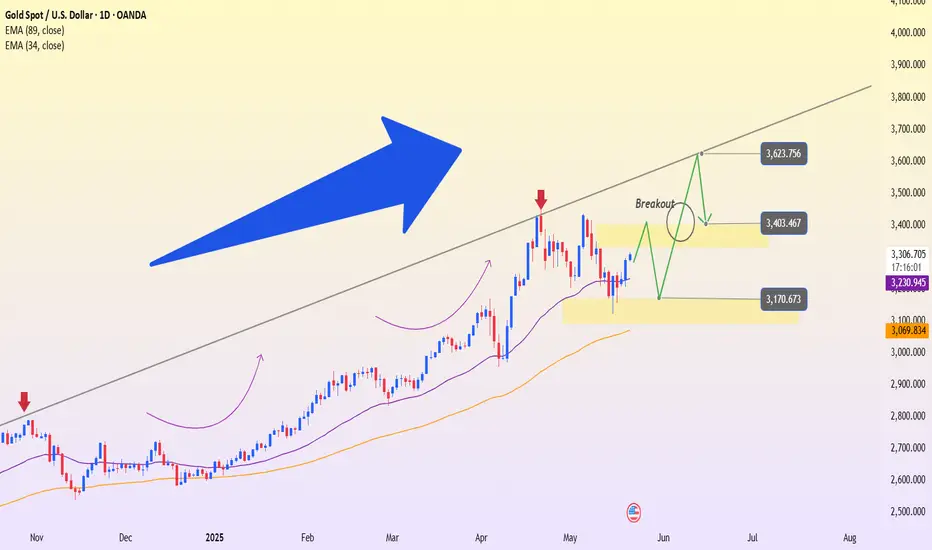
XAUUSD holds the trend – Will it break through 3,440?Gold continues to maintain a strong uptrend on the daily timeframe, supported by a rising trendline and upward-sloping EMA 34 and EMA 89. The price is now approaching the key resistance zone at 3,440 – a level that has been rejected twice in the past – making a slight pullback entirely possible.
However, the market structure shows no signs of reversal, and any dip toward the support area around 3,210 could present a “buy on dip” opportunity. As long as the price remains above the ascending trendline, the primary trend is still upward.
Traders are advised to patiently wait for clear signals near support rather than FOMO at resistance. If the 3,440 barrier is broken successfully, bullish momentum may accelerate toward higher targets.
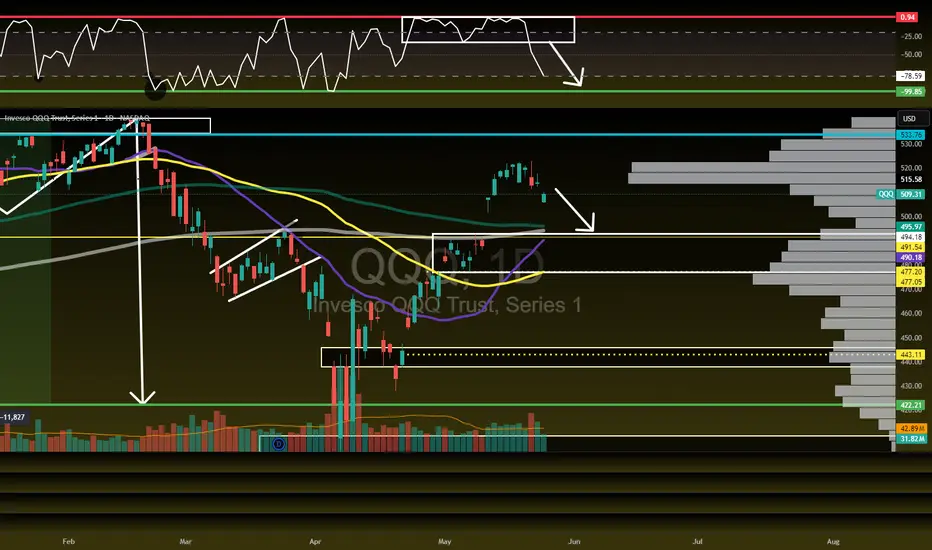
$QQQ Needs this pullback to happen!NASDAQ:QQQ a healthy pullback to fill the GAP and retest the 100/200DMA here going into next week.
A break through these MA's would be very bearish.
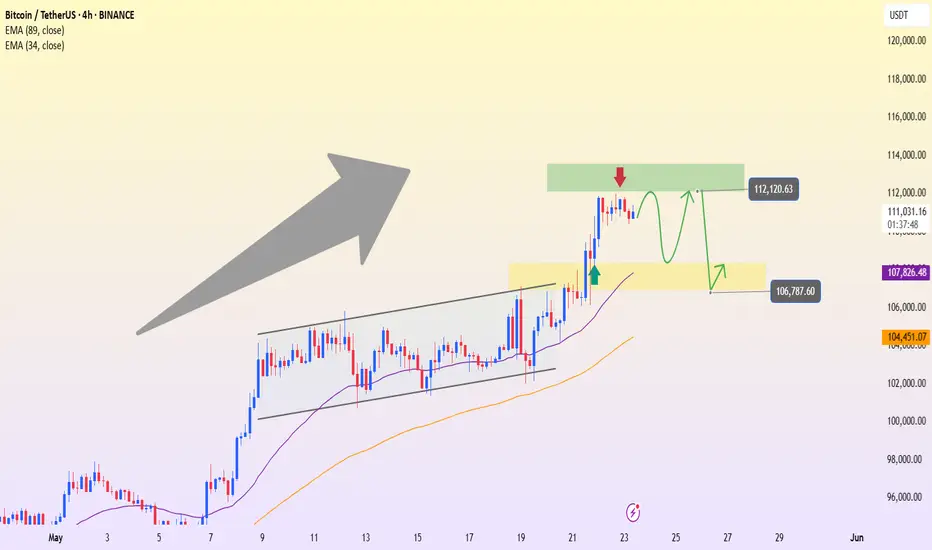
BTCUSDT – Mild Pullback, Support Holds FirmBTCUSDT remains in a clear uptrend with a structure of higher highs and higher lows, after breaking out of a prolonged consolidation pattern since early May.
The price has surged from the 106,000 resistance zone and approached the technical target around 112,000 – an area that is currently triggering a slight pullback.
At the moment, the support zone around 106,700–107,800 aligns with a demand area and the EMA34, likely serving as a springboard for the next upward move.
If BTC continues to consolidate around this zone without breaking below 106,700, the 112,000 level could be breached, paving the way for a move toward higher targets.
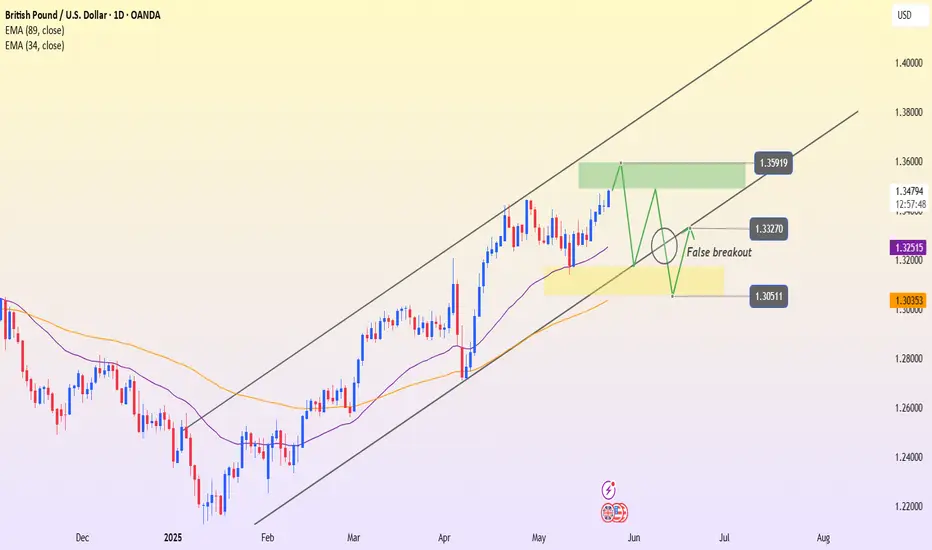
GBPUSD – False Breakout Alert at Channel TopOn the D1 timeframe, GBPUSD continues to maintain a clear bullish structure within an ascending price channel, with steadily rising highs and lows.
Currently, price is approaching the resistance zone near 1.35919 — which is the upper boundary of the channel and also a zone that previously saw strong reactions. As illustrated in the chart, a likely scenario is a false breakout above this zone, followed by a pullback towards the support area at 1.33270–1.32500 to retest the EMA34 region.
If this support holds, price could bounce back in line with the upward channel structure, opening the door to the next target zone.
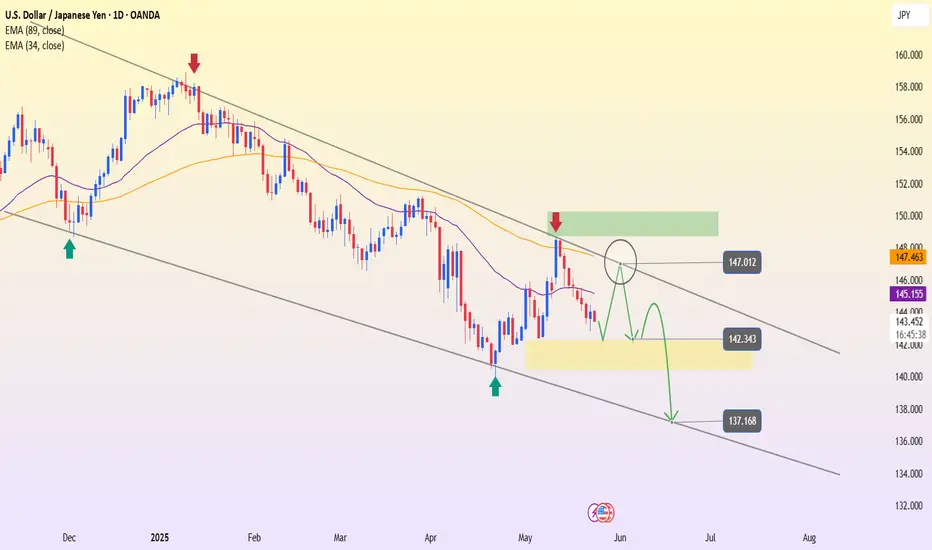
USDJPY – The downtrend continues, channel still leads the wayLooking at the D1 chart, USDJPY remains firmly within the descending channel that has persisted since the end of 2024. Every time the price approaches the upper boundary of the channel, selling pressure reappears – and the recent touch around the 147.012 area is no exception.
After being rejected at this strong resistance zone, the price has turned lower and is now forming a pullback structure within the prevailing trend. EMA34 and EMA89 continue to slope downward, reinforcing the bearish momentum.
If the price gets rejected again around the 145–146 region, the correction pattern may complete, opening up room for a drop toward the support zone at 142.343, or even deeper toward the channel bottom near 137.168.
In summary, the primary trend remains bearish – and the preferred strategy now is "sell on rally" when the price nears the upper resistance of the channel. Patience and watching for price action will be key.
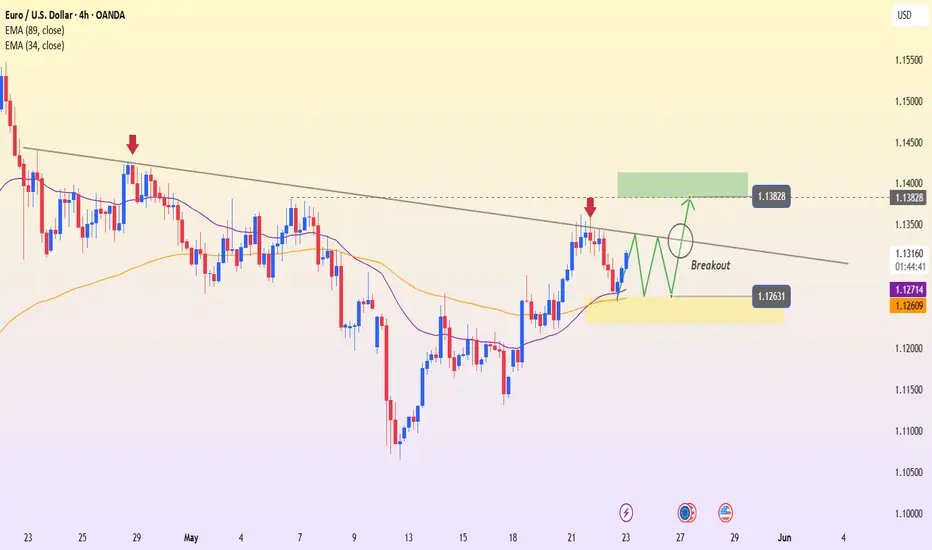
EURUSD – Consolidation below trendline hints at breakout aheadHello traders! EURUSD is currently forming a rather interesting consolidation pattern right below the descending trendline – a level that has rejected price twice in the past.
After a mild pullback from the 1.1382 zone, price has quickly recovered and is now hovering around the EMA34 and EMA89. This is an important confluence area and is acting as short-term support around 1.1263.
If EURUSD continues to hold above this support and forms sideways accumulation, the probability of a trendline breakout will increase. In that case, the next target will likely be the previous high at 1.1382.
U.S. bond yields are fluctuating sharply, and geopolitical tensions – such as trade uncertainty or regional instability – may serve as catalysts that support the euro.
Keep an eye on the breakout zone – if price breaks out decisively, it could be a strong confirmation of a new bullish trend!
After a sudden drop, is gold "loading up" for a breakout?Hey everyone! At the start of today’s Asian session, gold is moving sideways around the $3,300 level, following yesterday’s sharp swing. Looking back, the price had climbed for three consecutive sessions earlier this week, then suddenly spiked to a two-week high of $3,345 during the Asian session on Thursday—only to quickly drop and close near $3,294.
This sharp reversal reflects the ongoing tug-of-war between a strengthening US dollar, volatile US bond yields, and unstable geopolitical factors. However, on the 4H chart, the bullish structure still holds, with price currently retesting the support zone around the EMA34.
Key price scenarios to watch:
If the support area around $3,214 holds → gold could bounce back toward the $3,345 region.
On the other hand, if $3,214 breaks → the bullish scenario will be temporarily invalidated and gold might revisit a deeper accumulation zone.
Right now, watching the price reaction around yesterday’s low is crucial—this could be the key to catching the next wave.

XAUUSD – Testing resistance zone, will there be a breakout?Gold continues its impressive recovery on the 3H timeframe, after bouncing strongly from the support zone around $3,300. Currently, the market is approaching a key resistance area at $3,400 – a level that previously triggered strong selling pressure.
EMA34 and EMA89 have crossed upwards, indicating that short-term bullish momentum is gaining strength. However, since this is a former resistance zone, a pullback to the $3,300 area before continuing the upward move is entirely possible.
On the news front, rising jobless claims and weakening manufacturing PMI have lowered expectations for the strength of the USD. However, a slight uptick in the services PMI keeps market sentiment cautious – resulting in a tug-of-war, though still leaning in favor of the buyers.
What do you think? Will gold break out further or take a breather first?

XAUUSD – Short-term bounce, major trendline still in play!Hey everyone, looking at the chart, we can see that gold is still moving within a larger uptrend. However, it's now testing a key resistance trendline that has repeatedly caused price to reverse in the past.
The recent bounce from the $3,170 zone looks strong on the surface, but in reality, it's just retesting the $3,400 resistance area – where selling pressure could reappear. Price behavior is also showing signs of losing steam as it approaches previous highs.
If the price fails to break through the upper trendline, a pullback to the $3,400 support zone is the first likely scenario. A deeper move toward the $3,170 area – which previously triggered strong buying – could also unfold.
Summary: Price is currently testing a strong resistance zone. If it fails to break above, the likelihood of a corrective reversal increases. Watch the trendline reaction closely and plan accordingly!
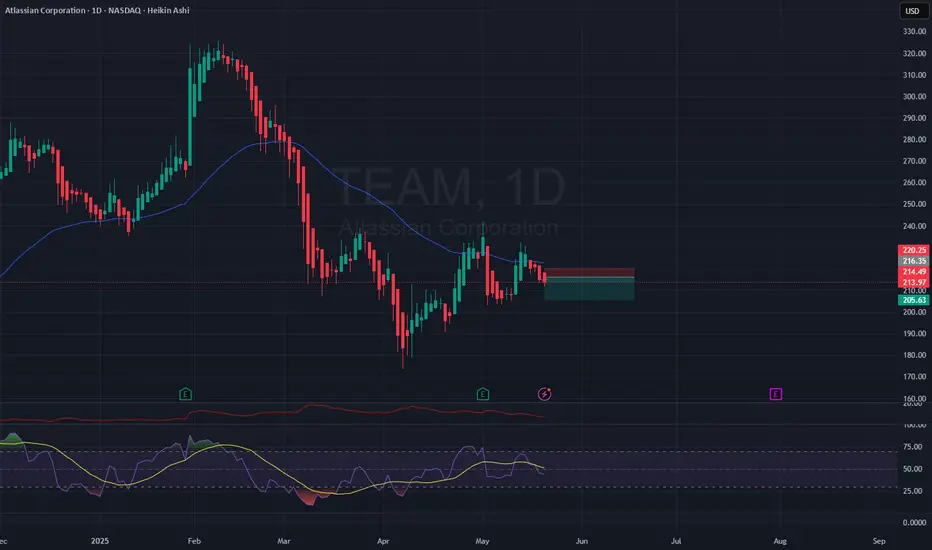
Based on macd and SMA ready to shortBased on macd and SMA ready to short first profit @204 soon. Simple moving average is ready and supportedby MACD also
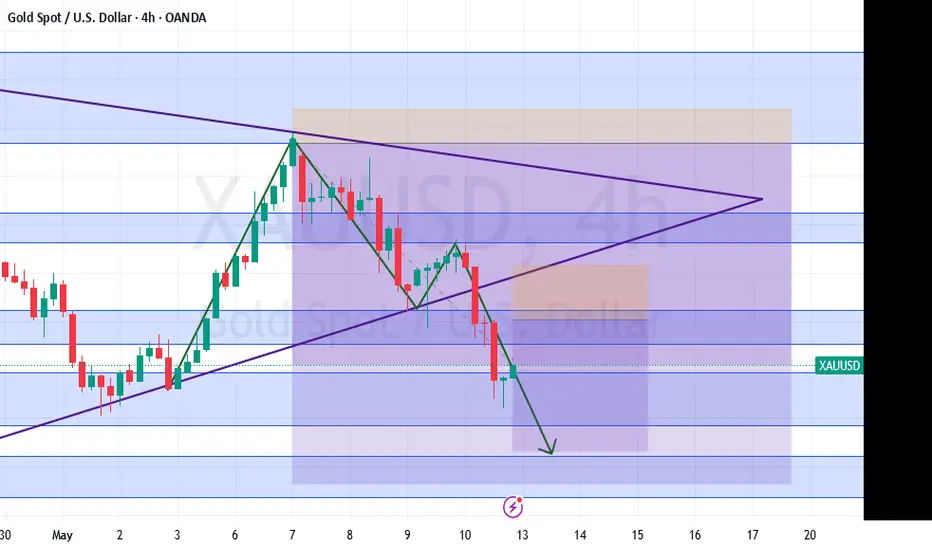
XAUUSD – Is the “Death Triangle” About to Break Down?Hey everyone, looking at the 8H chart, we can see that gold is tightening inside a narrow triangle – a sign of both consolidation and a potential major breakout coming soon. However, what's worth noting is that the price structure leans toward a bearish breakout, as gold continues to form lower highs and gets repeatedly rejected around the $3,250 resistance zone – which also aligns with the upper edge of the triangle.
Below, the long-term ascending support line is under significant pressure. If sellers maintain control and push the price below this trendline, the next potential target could be the $3,080 zone – aligning with the most recent swing low and acting as a possible support area.
Summary:
The $3,250 zone is the “checkpoint” to watch for selling pressure. If the price fails to break above this level, the downtrend is likely to continue.
The lower edge of the triangle is the “lifeline” for buyers. If it breaks, the likelihood of a deeper drop increases significantly.
What’s your take on this setup? Let’s share our views and spot the best trading opportunities together!

Is Gold About to Enter a Sharp Downtrend?Hey traders, looking at the chart, it’s quite clear that gold is currently undergoing a clean technical pullback – with the main objective being to fill the GAP around the $3,200 zone. This area is a strong confluence with the EMA34, and also marks a level where decisive selling pressure was previously observed.
Technically speaking, the overall structure remains bearish. Gold is still neatly confined within the descending channel, and recent rebounds appear to be nothing more than setups for sellers to "reload." The EMA34–EMA89 continue to serve effectively as dynamic resistance, and price action is already showing signs of fading bullish momentum as it approaches this key barrier.
The market is also responding to growing concerns over new U.S. tax policies, combined with a waning sense of defensive positioning. From my observations and feedback from various sources, the general sentiment leans toward gold continuing to weaken in the short term – not because of any sudden shock, but due to a lack of compelling bullish catalysts.

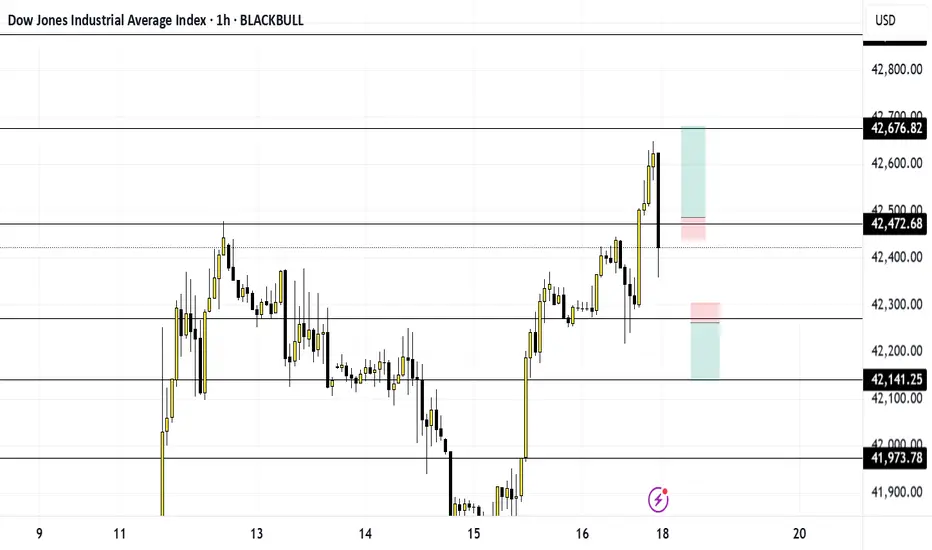
US30 Markup May 18thWhat did the tomato say to the other tomato during a race? Ketchup!! Now lets ketchup on these charts.
Price is in an uptrend and is nearing my key level 42,474. If price breaks and retests that area, then I will get in for the buy and buy up to 42,672 area.
However, like a puppy, price does whatever it wants. So, if price breaks structure around 42,268, I shall wait for price to break and retest that area so I can get in for the sell down to 42,141.
I shall be waiting for the break and retest on the one-minute timeframe for both the buy or sell.
Lastly, enjoy yourself, and be responsible.
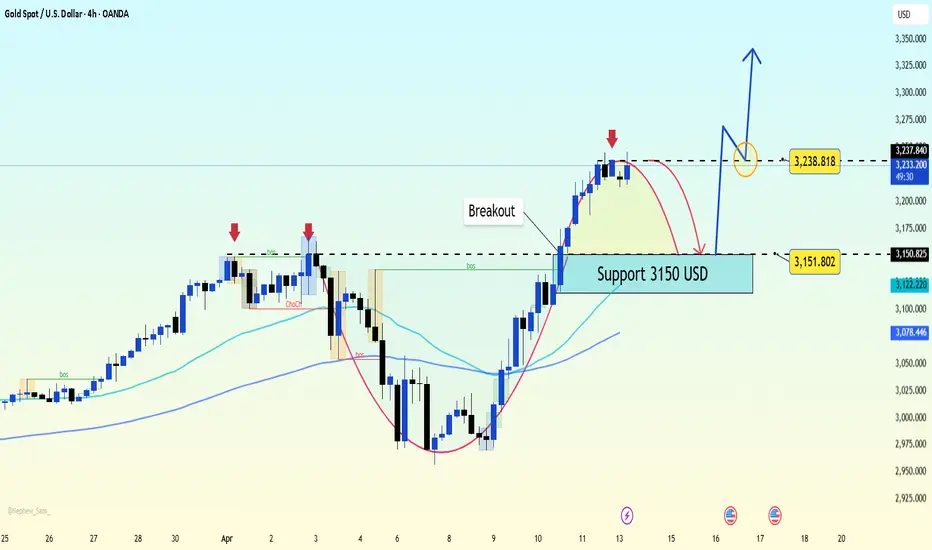
[XAUUSD] Daily Analaysis 12 - 13 May 2025Continuing my mapping in the previous post, H4 GOLD turned out to be stronger and brought GOLD down to support 3195 - 3238. Of course, today's large decline will be followed by a fairly high correction as well. Anticipate GOLD which will correct to the previous low at 3282.
With the confirmed downtrend pattern, the SELL Area 3262 - 3290 is worthy of our SELL position again.
GBPUSD today should buy or sell?GBP/USD continues to build on its bullish momentum, reclaiming the 1.3100 level on Monday morning. The ongoing weakness of the U.S. dollar suggests that the path of least resistance for this pair remains to the upside.
The key monthly employment report is set to be released on Tuesday, followed by the latest consumer inflation data on Wednesday. In addition, investors this week will also face the release of U.S. monthly Retail Sales figures and pay close attention to a speech by Federal Reserve Chairman Jerome Powell — a speech that could play a crucial role in shaping the USD’s price dynamics. These events are expected to provide meaningful catalysts for the GBP/USD pair in the latter part of the week.

Gold Gathers Strength Amid Global UncertaintyRight now, gold is benefiting from a convergence of highly favorable conditions for a strong bullish trend. Growing concerns about a global trade war have triggered widespread risk-off sentiment, driving capital flows into safe-haven assets like gold. As a result, the precious metal has maintained an impressive upward momentum throughout the past week and is currently stabilizing around $3,235.
From my personal view, the U.S. dollar is showing clear signs of weakness — and that only adds fuel to gold’s rally. The $3,300 mark looks like the next logical milestone, with $3,500 as a longer-term target if the current trend holds. Recent corrections in gold have been shallow and brief, which reflects persistent buying pressure and no signs of a distribution phase at the top.
This week, we should pay close attention to major monetary policy events, including meetings from the Bank of Canada, the ECB, and a speech by Federal Reserve Chairman Jerome Powell. These events could bring increased volatility to the market. However, if central banks hold or cut rates as expected, it will provide even stronger psychological and technical support for gold.
Personally, I remain optimistic about the bullish outlook on XAUUSD — how about you?
AUD/USD Breakdown: Bears in ControlThe AUD/USD pair has officially broken below its medium-term ascending channel on the daily chart, signaling a strong shift in momentum. After failing to hold above the resistance zone at 0.6311 – 0.6386, the pair reversed sharply and is now trading around 0.6213.
🔍 Key technical highlights:
A confirmed breakout beneath the channel support, accompanied by strong bearish candles, suggests growing seller dominance.
Both the EMA 34 and EMA 89 are now positioned well above the current price, reinforcing a medium-term bearish trend.
A potential short-term pullback to the 0.6240 – 0.6266 area may occur before further downside continuation.
📉 Next downside target: If bearish momentum persists and price fails to reclaim the broken support, the pair is likely to slide toward the marked support at 0.59142.
💬 With the USD gaining strength amid hawkish Fed expectations and the AUD facing domestic economic headwinds, selling the rallies remains the favored strategy in the current environment.

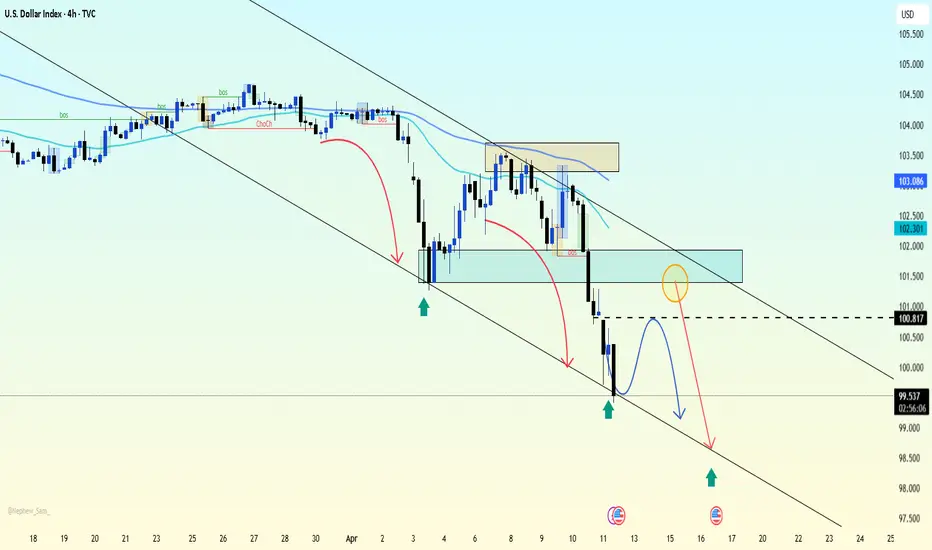
DXY Breakdown: Bearish Momentum Builds Amid Weak U.S. DataThe U.S. Dollar Index (DXY) is maintaining a clear bearish trajectory, with price action on the H4 chart showing a consistent pattern of lower highs and lower lows inside a descending channel. The technical structure points to continued selling pressure, and recent fundamental developments only reinforce this view.
📰 Key drivers behind the decline:
The latest U.S. CPI data came in weaker than expected, signaling easing inflationary pressure and fueling expectations that the Federal Reserve may cut interest rates sooner than anticipated.
A slight uptick in jobless claims has raised concerns that the U.S. labor market may be losing momentum.
Simultaneously, global players like China and Japan are shifting toward more stable monetary policy, prompting capital flows away from the dollar.
📉 From a technical perspective, DXY has broken below the key 100.817 support zone and is now trading around 99.7. Each attempt at a bullish pullback has been short-lived, with sellers regaining control quickly. The green arrows on the chart indicate potential reaction zones, but the descending channel structure remains firmly intact.
Outlook: If the index fails to reclaim the 100.8 – 101.3 resistance area, there’s a high probability of further downside toward the 98.5 – 98.0 support region.
In short, DXY is under pressure both technically and fundamentally, which explains the current bullish momentum in EUR/USD, GBP/USD, and especially gold (XAU/USD).