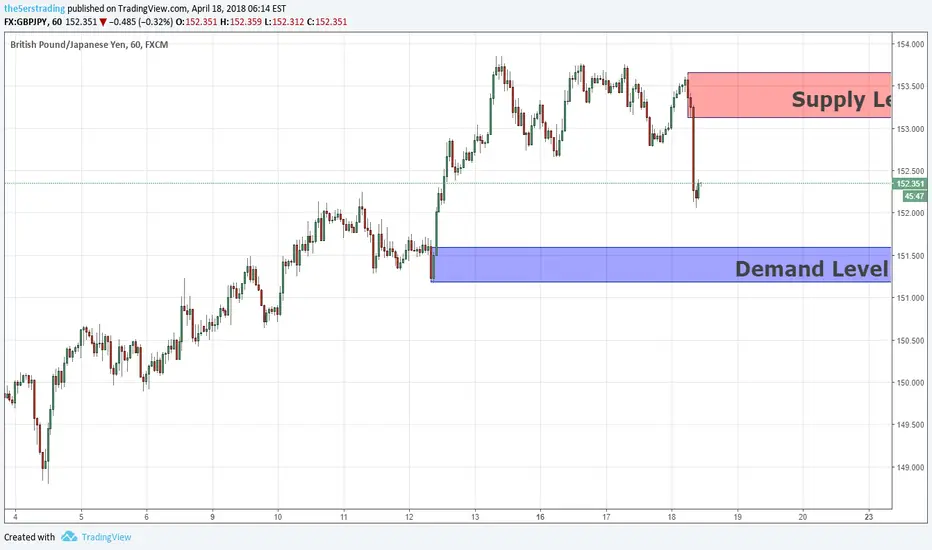
Key Levels GBPJPY 18/04/18If we are looking for a daytrade position opportunity then those key levels
Are great levels to open position, the new supply above is a great level of
Sell position, as long as the pice didn't reach the demand below I'll sell at
The supply above in order to reach the demand below as a target, the demand
Below is a great level of buy position for the long term.
Sell-buy
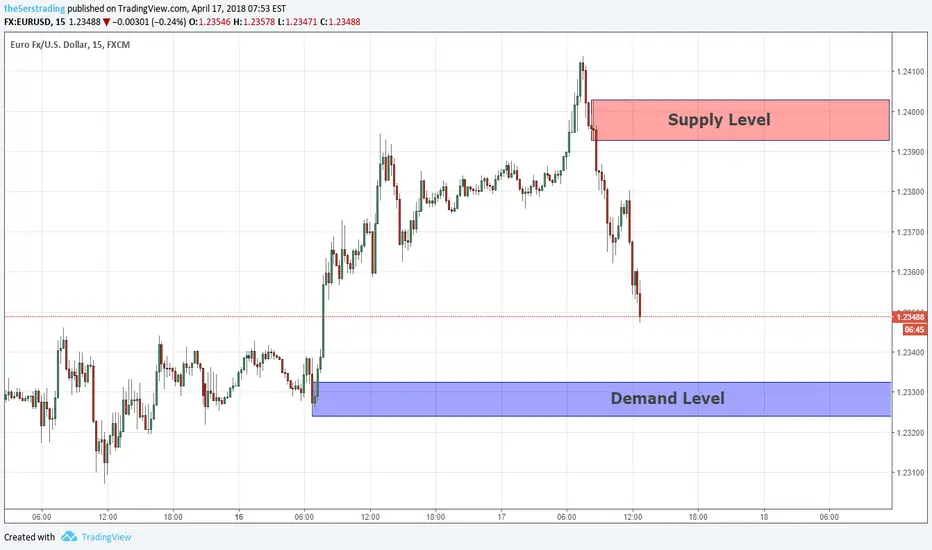
Intraday key levels EURUSD 17/04/18Those are the next fresh supply and demand in EURUSD, both levels
Are great for an intraday position, the supply above is also part of a pattern
Called Quasimodo, is a great level of sell position, the demand below is a great
Level of buy position, i'll buy there.
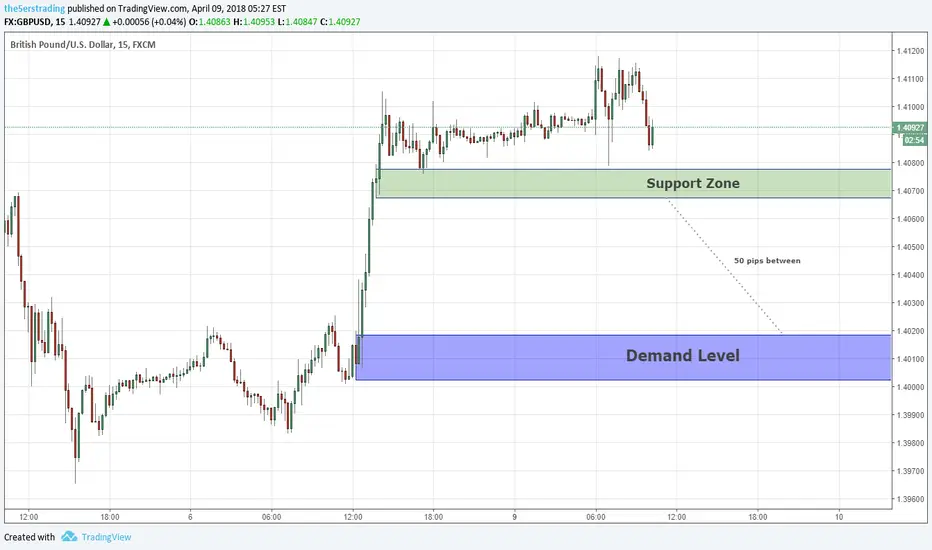
Intraday analysis GBPUSD 09/04/18If we look for an intraday position opportunity on GBPUSD we should
Wait for the price to break out the support zone below, if that happen
There is high probability the price will continue down to reach the demand
Below, there is 50 pips space between those levels and i'll look there for sell
Opportunity, also the demand below is a great level of intraday buy position.
EURUSD WEEK April 9th-13th 2018Bullish Trade Setup Primarily. Sell position is on the cards *IF* the market goes straight up, if my bullish trade sets up, I won't considering short at anytime if my bullish trade has setup

Intraday analysis GBPJPY 04/04/18For the intraday or scalping traders, those are the next fresh supply & demand
In GBPJPY to look for an intraday position, the demand below is a great
Level of buy position and the supply above is a great level of sell position.
This supply is also a Quasimodo level.

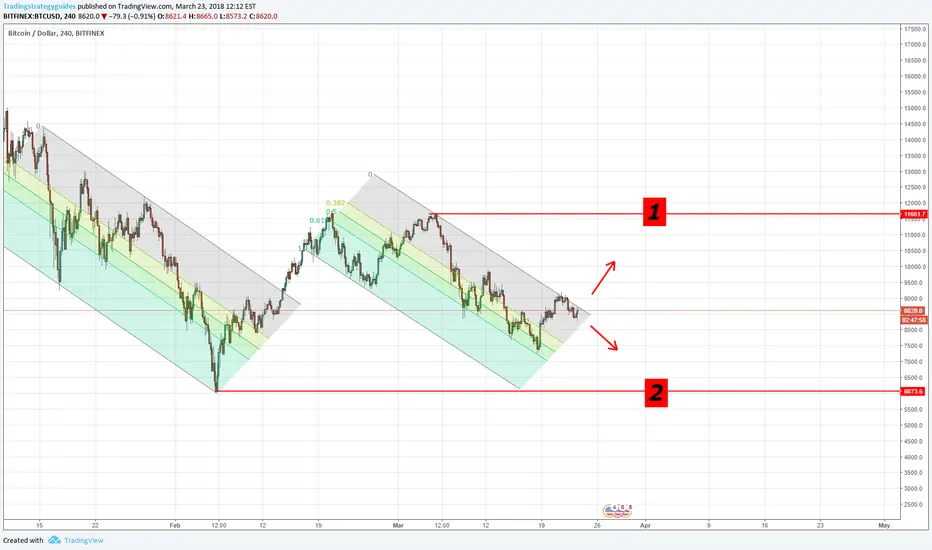
Where Do We Go From Here? Bitcoin Friendly Competition Hey friends! So I wanted to do a little friendly competition because, really, we are all in this together... right?
Will Bitcoin hit price #1 (11661.7) OR price #2 (6073.6) first?
Reply with your answer in the comments! Winners get the satisfaction that they were right, and someone else was wrong :)
Please also share your thoughts, charts, and reasoning, why you say it will hit this price point first.
With all of the incredible people on Tradingview, I think this could be a great lesson for us all!
Good luck!
P.S. Price 2 ;)
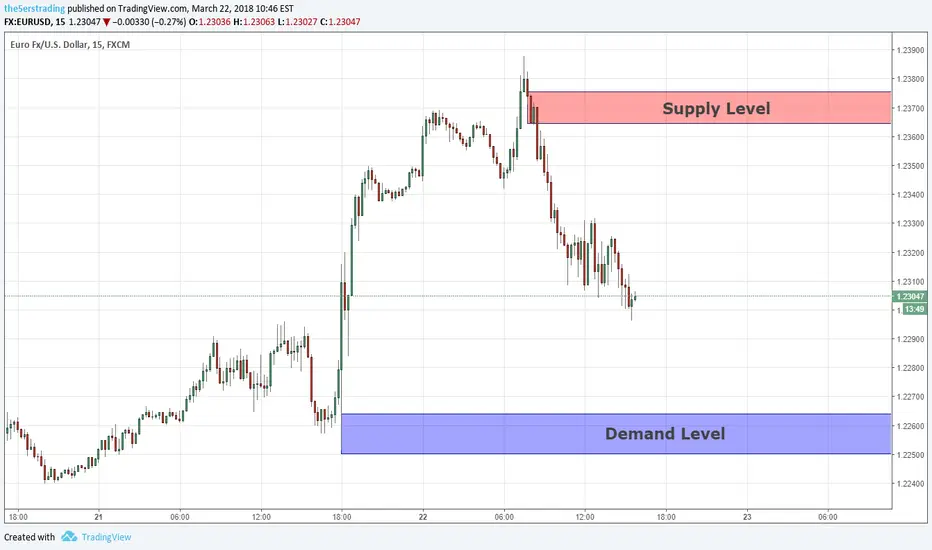
Intraday analysis EURUSD 22/03/18For the intraday terms, I marked the next fresh supply & demand,
Both levels are great for day trade position, the supply above seems like
Quasimodo level and a great level of sell position, I'll sell at this supply and
Buy at the demand below.
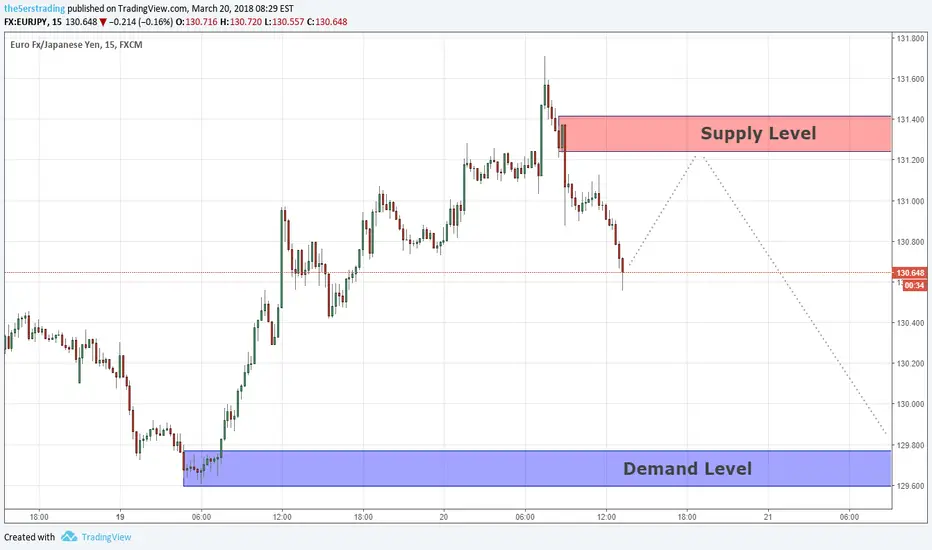
Quasimodo Levels EURJPY 20/03/18There are two levels of intraday positions at the EURJPY, there is a fresh supply
Above us and fresh demand below, both levels are Quasimodo levels,
i'll sell at the supply above and buy at the demand below.
Still saying the same thing for 2 months. Notice Me SenpaiThe trend continues...guess a lot of people didn't see what was right in front of them. Tried to heed the warning, but I know I helped a few save some money before the drops. Thank you for your support.
Always here to drop some quotes, facts or opinions to consider when making decisions.
The methods that traders use in the stock market work better then the same methods applied to crypto. There may not be a statistic out there to prove this, however if you notice around you a lot of youtubers, people here on trading view, and I all use some of the methods applied in traditional markets. Example: Elliot waves, Fibonacci, rsi readings, macd, etc.
BTC is however a little manipulated at the moment, so these theories and tactics become a lot more difficult and less predictable. This being the case, then the best thing I believe you should be doing in this situation is look into the past. There will be time for a lot of these methods, but for now you should be looking at previous graphs of BTC, DOTCOM, any examples of market crashes or corrections in the past. What is the reason for these crashes? How far do these crashes retrace? These examples are what bring me to my conclusions.
Remember BTC is around 20x - 30x faster than the stock market, The crash of DOTCOM looks almost identical to this BTC bubble crash.
I'm not an expert on the crypto market, but was Ash Ketchum an expert? Or was he a boy who wanted to be the very best?
May The Trends Be With You! -------- Please like, share, comment!!
- Furious
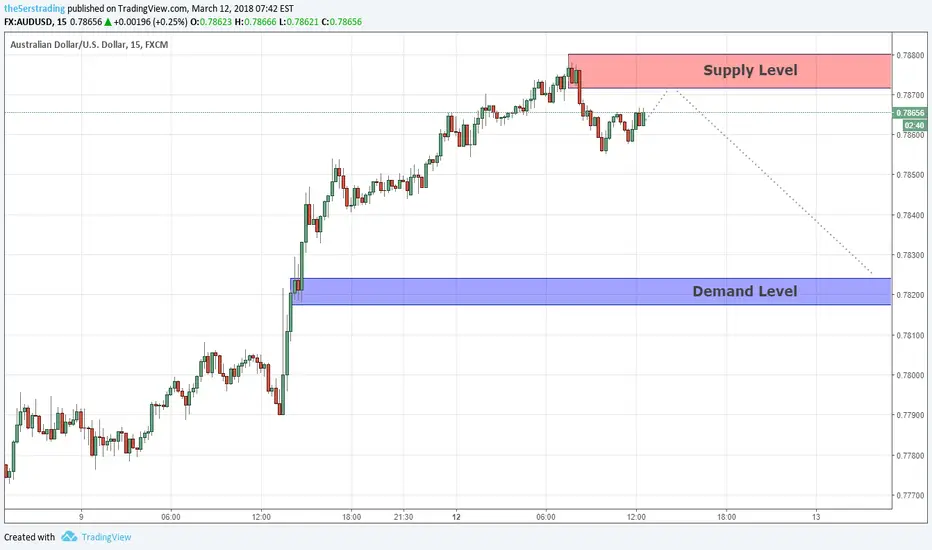
Intraday analysis AUDUSD 12/03/18Intraday opportunity for AUDUSD, above us there is supply level,
If the price reaches that supply I'll sell there, it's also Quasimodo level,
The demand below is a great level of buy position, if the price reach that
Level I'll buy there, both are a day trade opportunity.
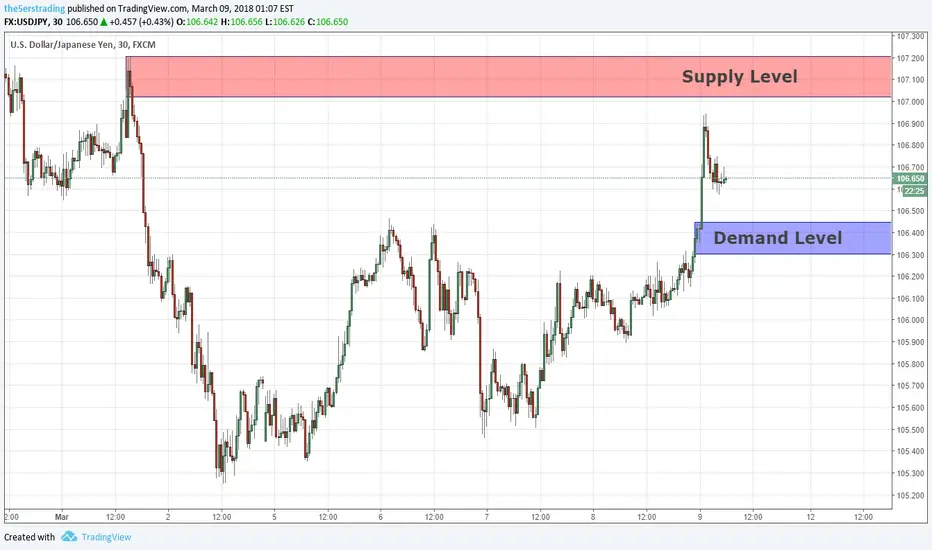
Intraday analysis USDJPY 09/03/18The USDJPY is between the supply above and the demand below,
The demand below consider as continuation level hence the intraday
Momentum is bullish. if the price retrace this demand I'll buy there,
The supply above is a reversal level if the price reaches that level I'll sell there,
Both levels are great for the intraday position.
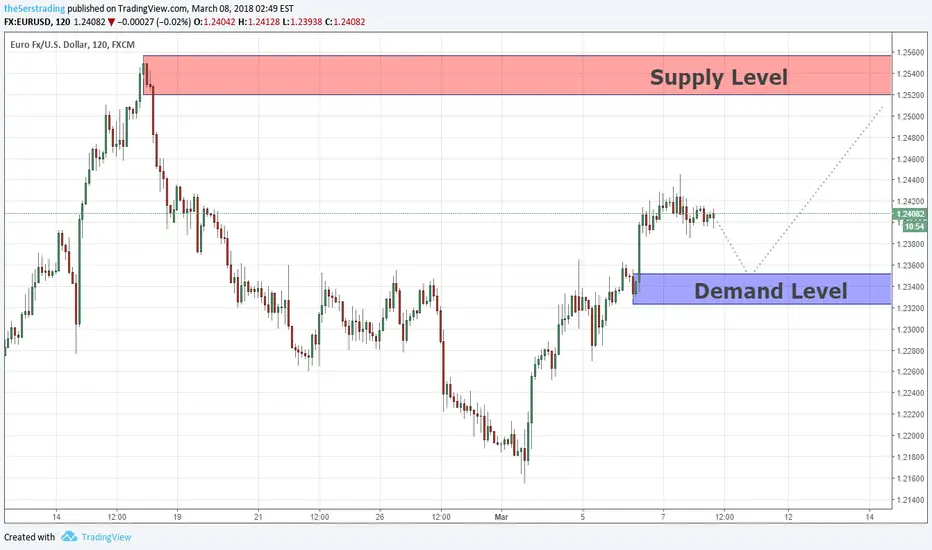
Swing terms analysis EURUSD 08/03/18At the swing term EURUSD is bullish at the moment, most likely will stay
Bullish until reaching the supply above, the demand below seems a great
Continuation level, therefore if the price back this level I'll buy there and my
Target will be the supply above, and if the price will reach the supply first i'll
Sell there, and my target will be the demand below.
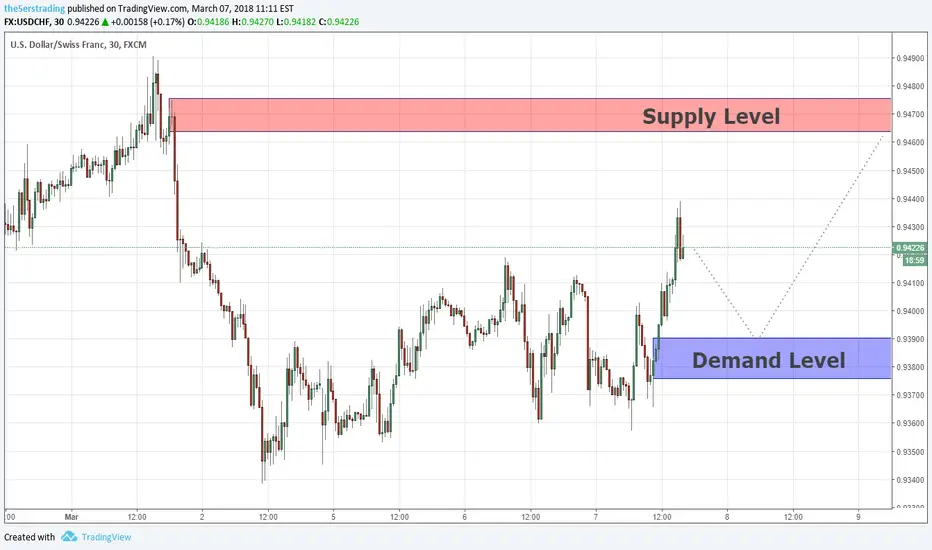
Intraday analysis USDCHF 07/03/18The USDCHF is bullish at the intraday terms, therefore i'll prefer to look
For buy position today, the demand below seems like a great level of
Continuation, if the price will back this level i'll buy there, the supply above
Seems like a great level of sell position, there are unfilled orders waiting there,
Both levels are for intraday position.
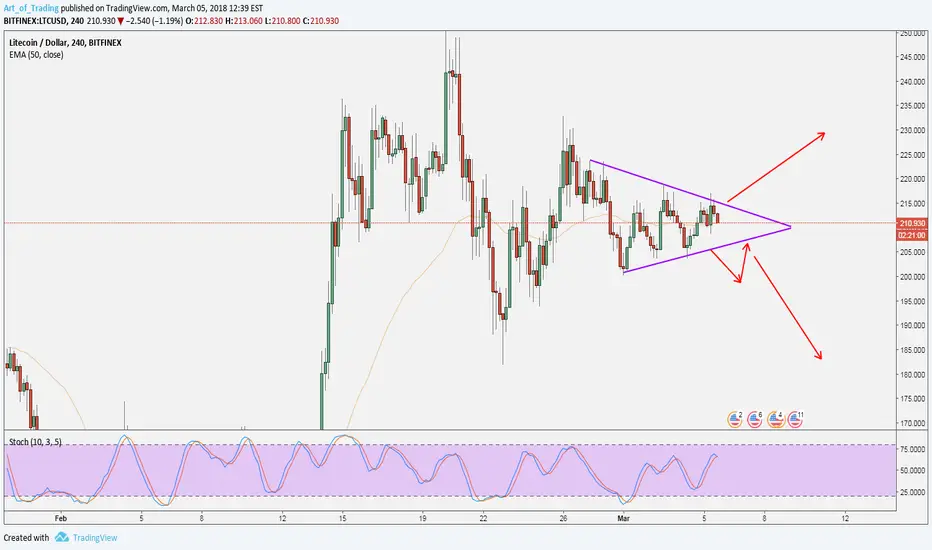
LTCUSD: Litecoin Triangle PatternThe LTC moves sideways last few days that formed the triangle pattern. These trendlines acts as dynamic support and resistance. I will await the market to breakout the triangle and then enter into the trade. After the valid breakout, I either go short or long on LTC, depends on the market condition.
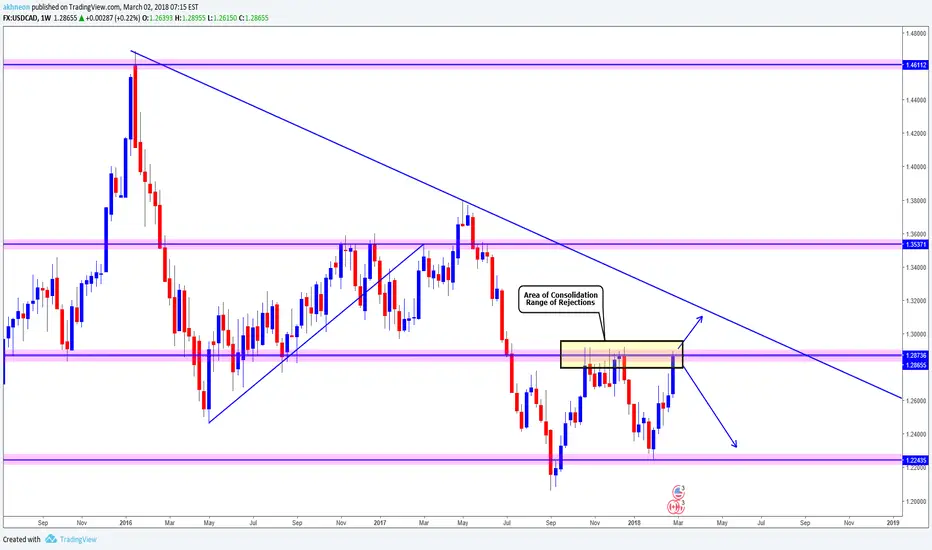
USDCAD - Weekly Timeframe Analyis USDCAD Shows a Bearish Trend throughtout the Weekly timeframe , Could either push towards the Trendline or towards the 1.22435 Support Area
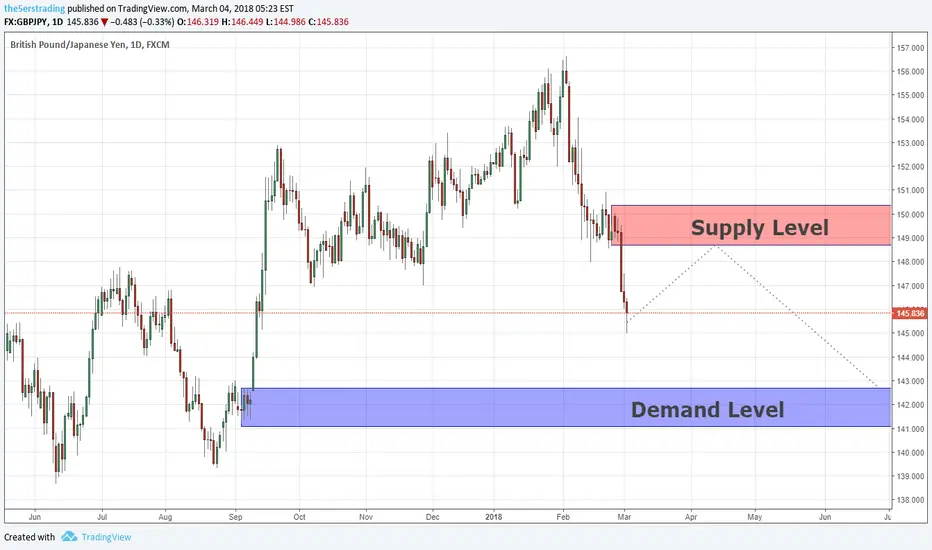
Key Levels GBPJPY 04/03/2018It seems that in the swing and long-term the GBPJPY on his way to reach the
Demand below, which is a great level to open buy position, the supply above can
Be a great continuation level if the price will back to this supply before reach the demand,
I'll sell at this supply, and my target will be the demand below. both are great fresh level,
With excellent risk-reward ratio potential.
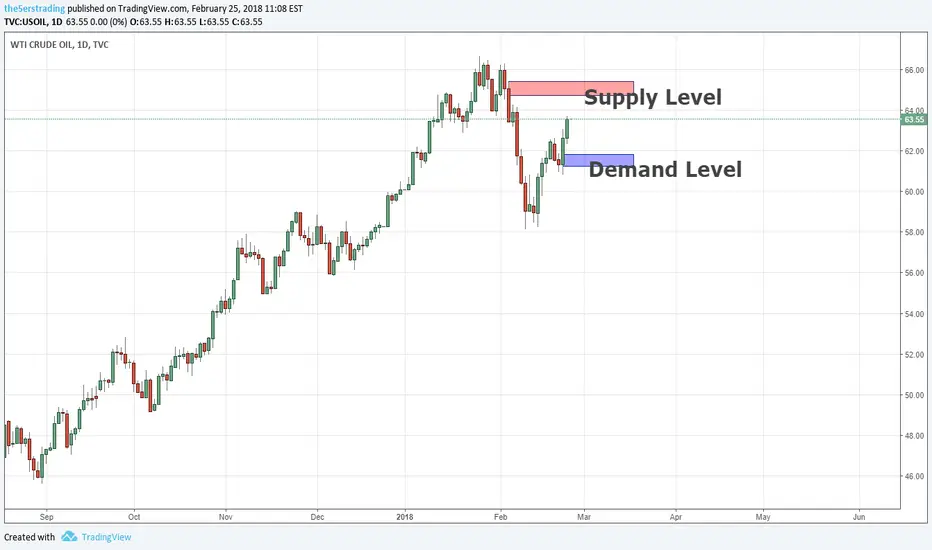
Key Levels USOIL 25/02/2018At the moment the USOIL is bullish on the swing terms, the demand below
Is a great continuation level for buy position to join the bullish momentum
Until the price reach the supply above, the supply above is a great level of
Reversal, i'll sell at this supply.
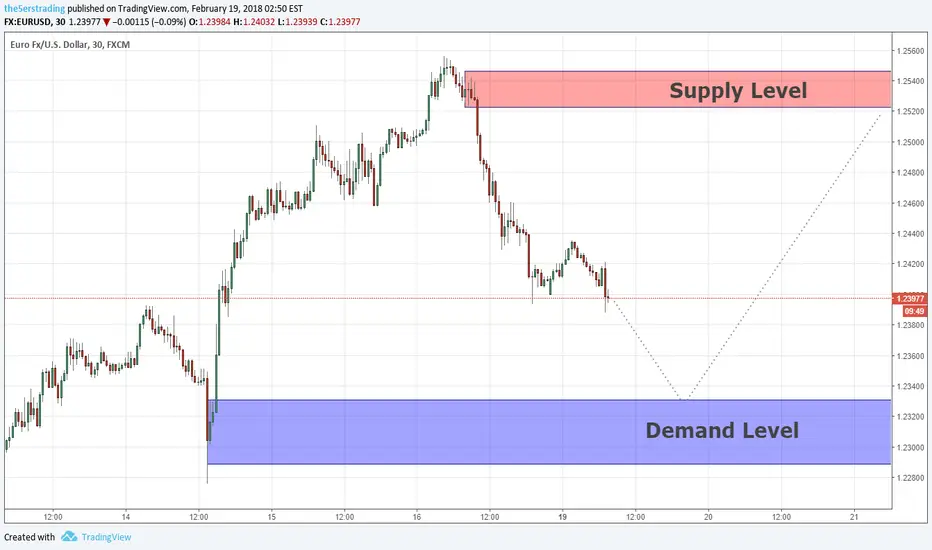
Key Levels EURUSD 19/02/2018 At the moment, on intraday time frame the EURUSD seems bearish, below us
There is a demand level and above is the supply, both are great level to trade,
For now it seems the price will reach first the demand, i'll buy at this demand,
And the target is the supply above which is a great level for sell position.
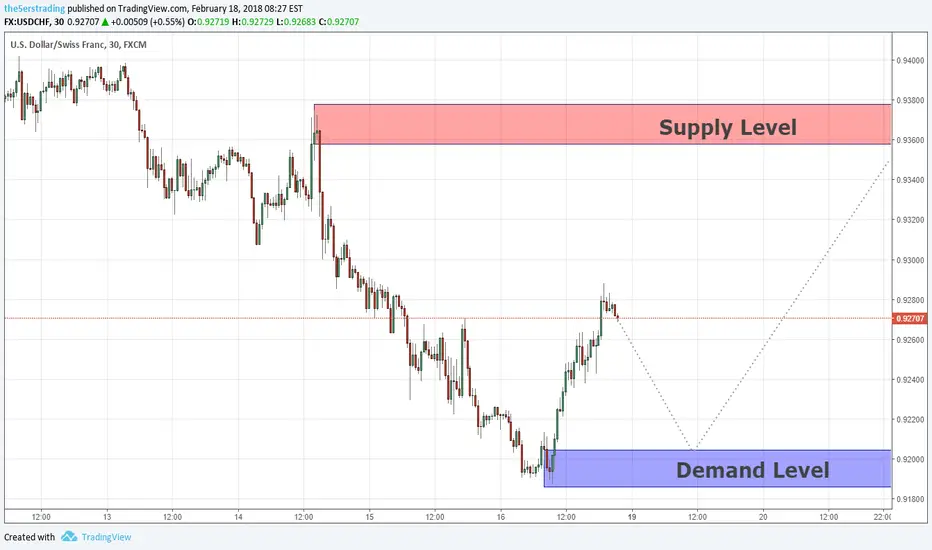
Key Levels USDCHF 18/02/2018 Those are the next supply & demand for USDCHF, it's a great level for
Swing term position, the demand below is a great continuation level for
Buy position as a continuation trade in order to reach the supply above,
The supply above is great level for sell position.
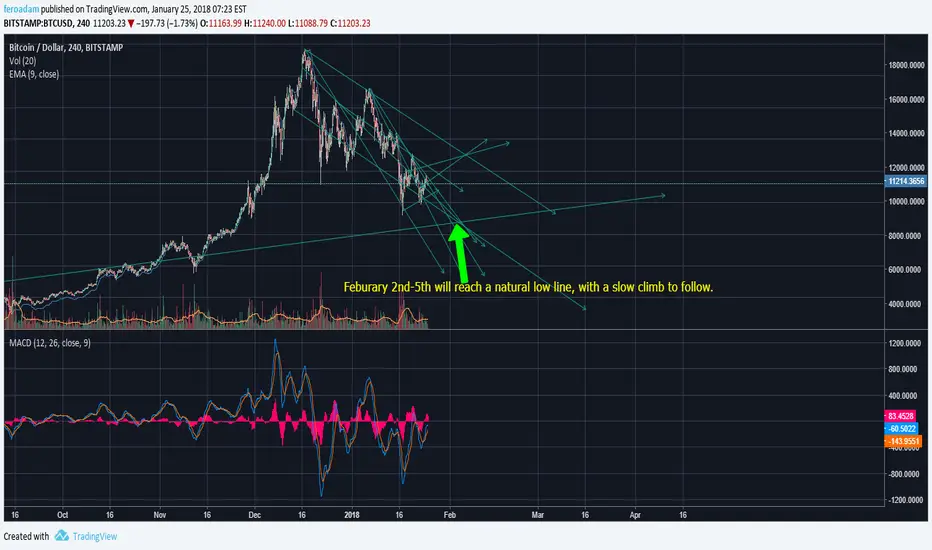
Feburary 2nd-5th will restart the natural flow of BitcoinThere was an unnatural jump in price. It should reach this natural point after a quick decline to balance out.
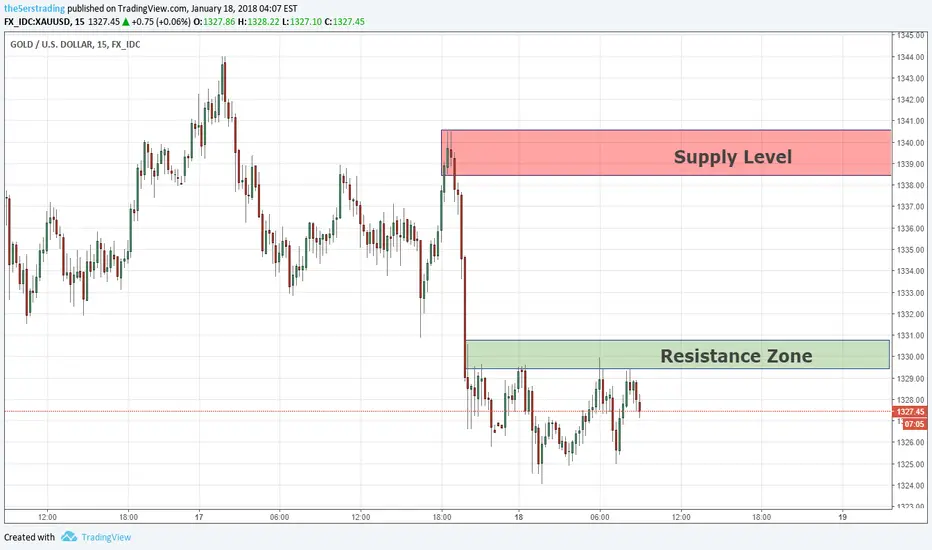
Confirmation Level GOLD 18/01/2018If the price will break out the resistance zone, it indicates the price tends
To reach the supply above, in that case, i'll look for reason to open buy
Position as a day trade, my target will be the supply above, that supply is
Also a great level of sell position as a swing term position, the target for the sell
Position is 1313.00.
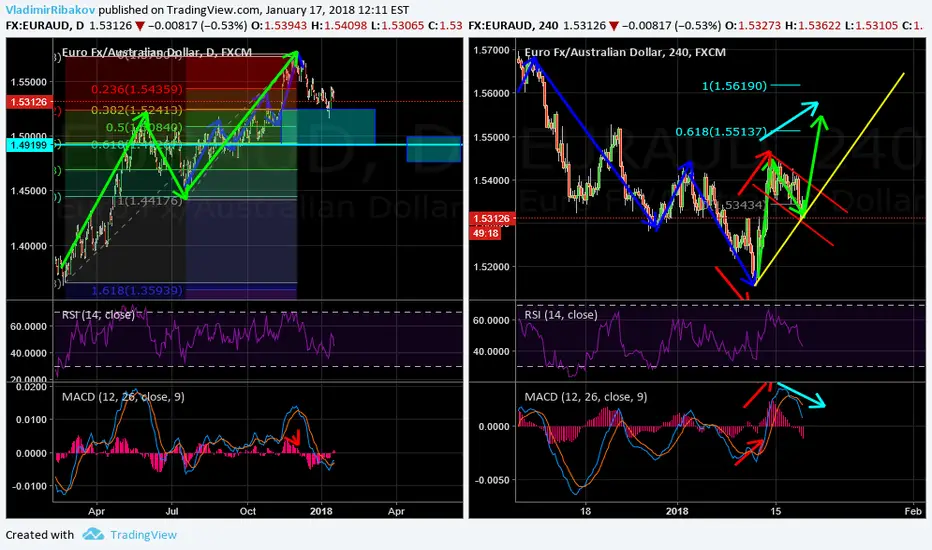
EURAUD Double ScenarioD1 - Special cycle and big double cycle. First target reached, second target not reached yet. Correction happening now once it completes itself, we can look for sells.
H4 - Triple (or special cycle) completed itself. We may expect double wave up with price reaching 50% retrace of this triple cycle.
Bullish convergence, price moving inside bullish flag pattern. Once we get a breakout at top we can look for buys.
Sell Scenario:
If we get double wave up with bearish divergence then we can look for sells with the breakout of the most recent uptrend line.
MOD might be looking to go downMOD went up by a lot yesterday and now it has to cool off. I would sell and buy at the entry and the target point.
