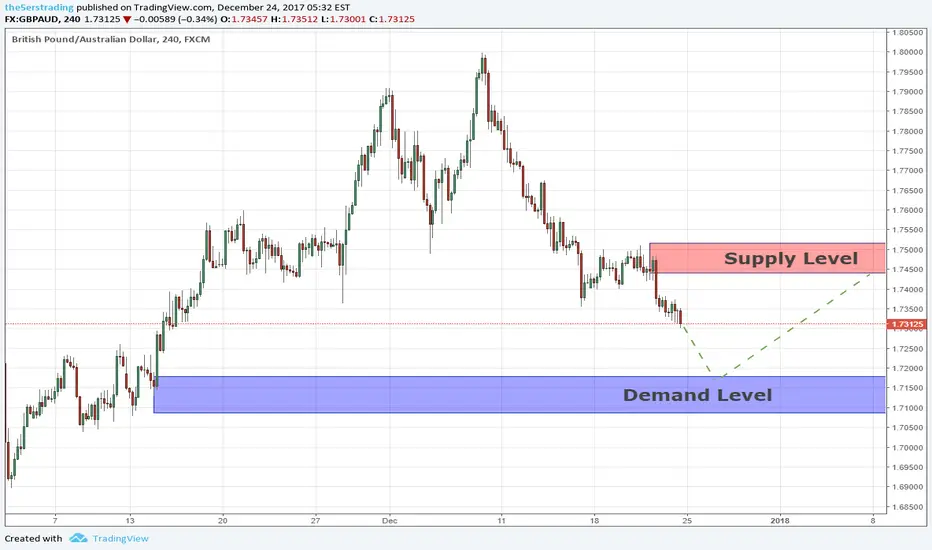
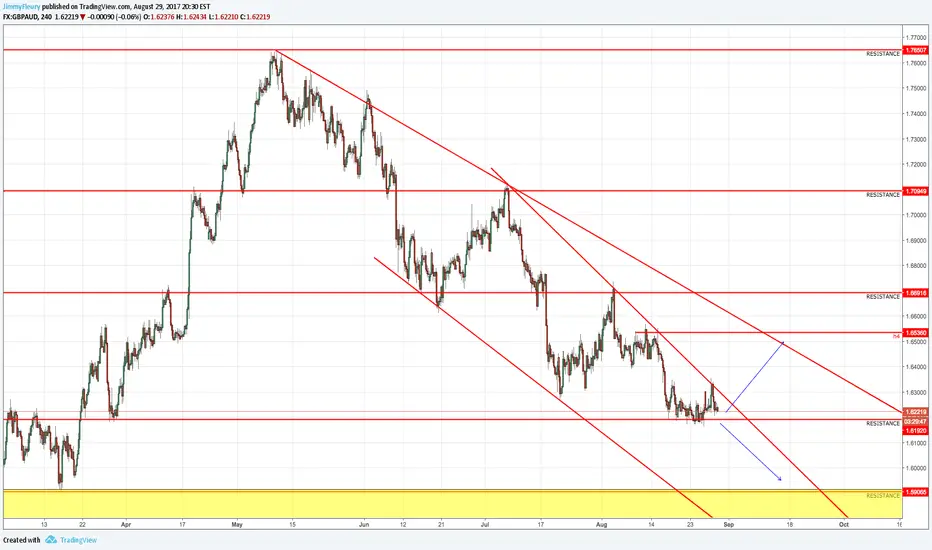
Supply&Demand GBPAUD 24/12/2017Those are the next fresh supply & demand levels for GBPAUD,
Each one of them is fresh, and I'll wait for the first time the
Price reach them, I'll sell at the supply above, and buy at the
Demand below.
Sell-buy
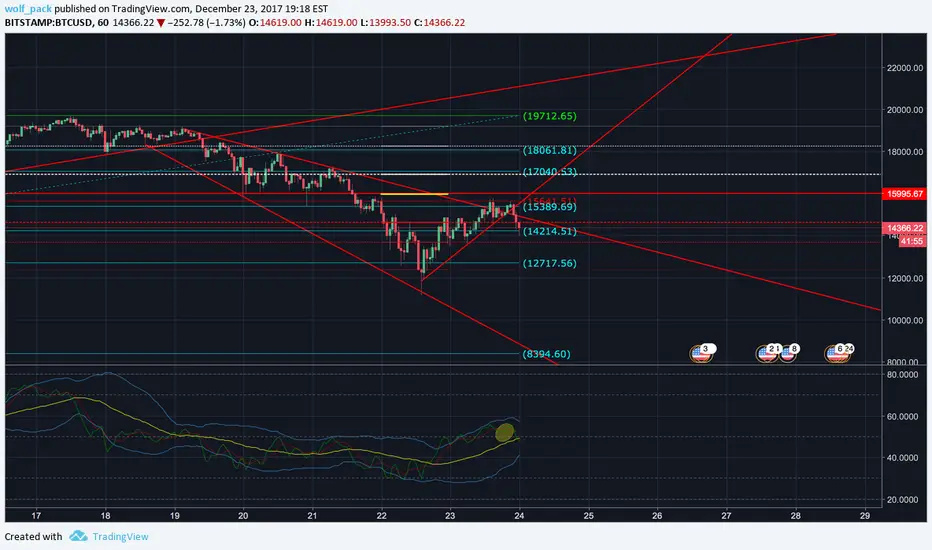
BTCUSDif price goes below 12,000 bitcoin will go to 8500 at least if it breaks above 16k it can continue up
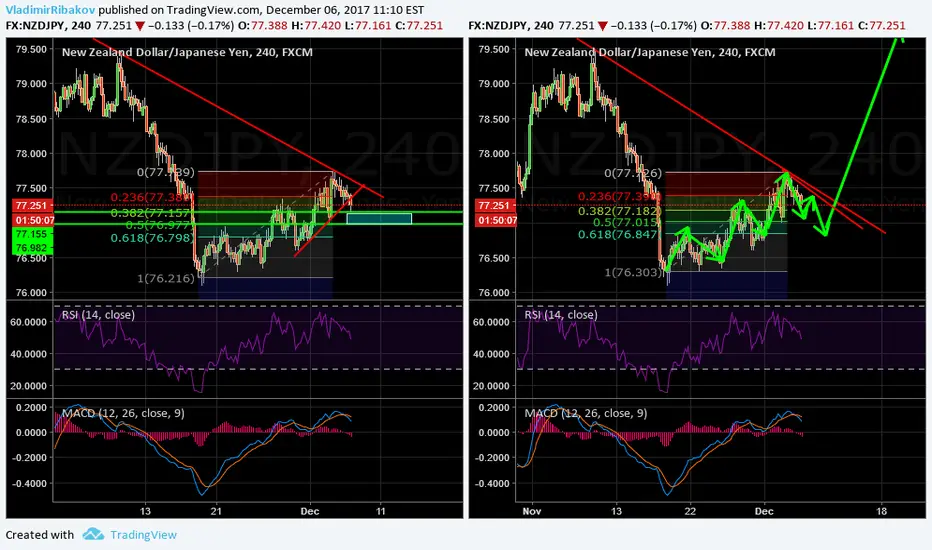
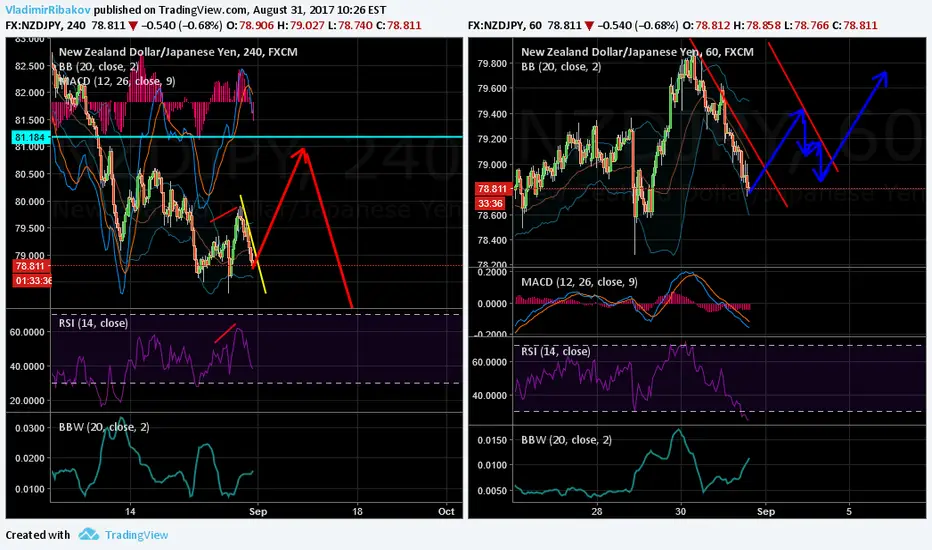
NZDJPY Doube Scenario Buy Scenario:
H4 - Triple cycle up completed, now we may expect double wave down and once it completes itself we can long with the breakout of the most recent trend line.
Sell Scenario:
D1 - Price is respecting down trend line, hidden bearish divergence formed. If we didn't get a valid breakout of this downtrend line, we may expect the price to reach the last low or may be even new lows to be created.
H4 - As long as there is no confirmation for the opposite direction, we can look for short term sells with the breakout of the most recent uptrend line.
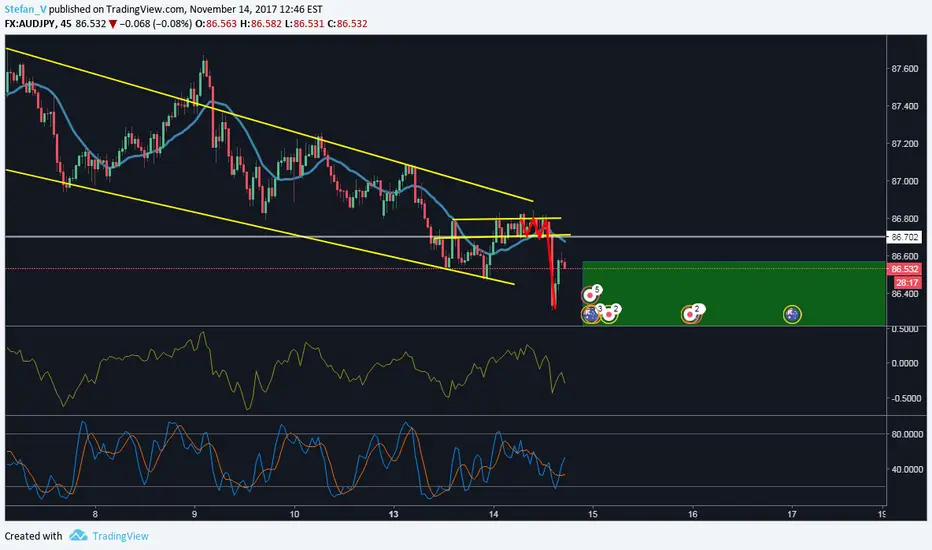
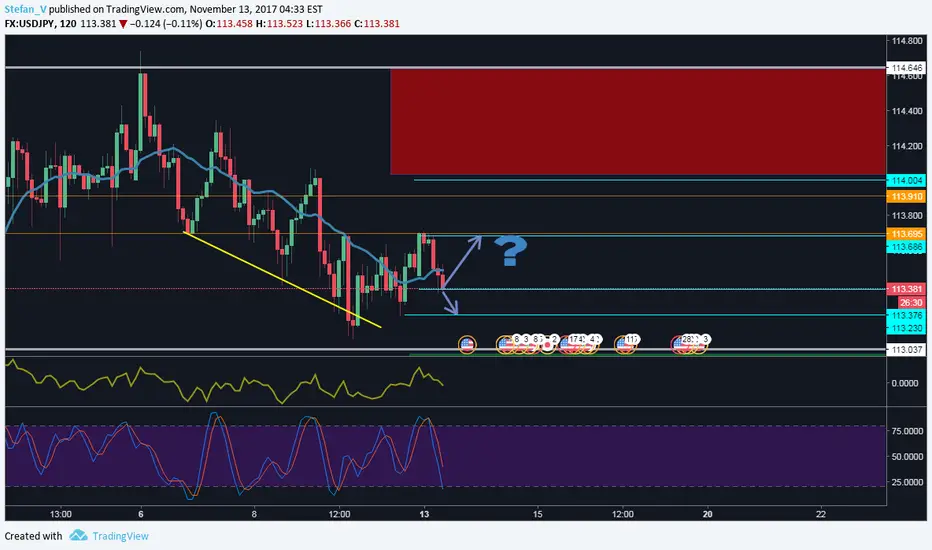
USDJPY Sell/Buy ideasI'll personally wait for a push or pull, what do you think ?
Please leave a comment.
Any objections/suggestions are welcome.
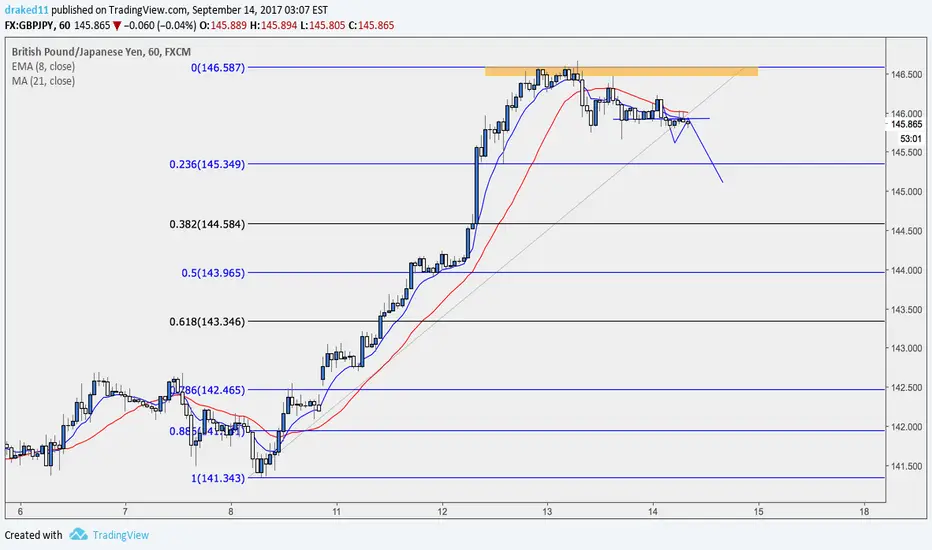
GBPJPY short and long possible on intraday trade, market openingBoth ways possible here. I would mostly go with the upside.
If and when you break it usually goes with power so 5-10 pips above the breakout is a good buy.
If we start going down, then wait for breakout and sell the flag.
We should consolidate under the trendline and then sell the flag.
Both sides, 120 pips TP.

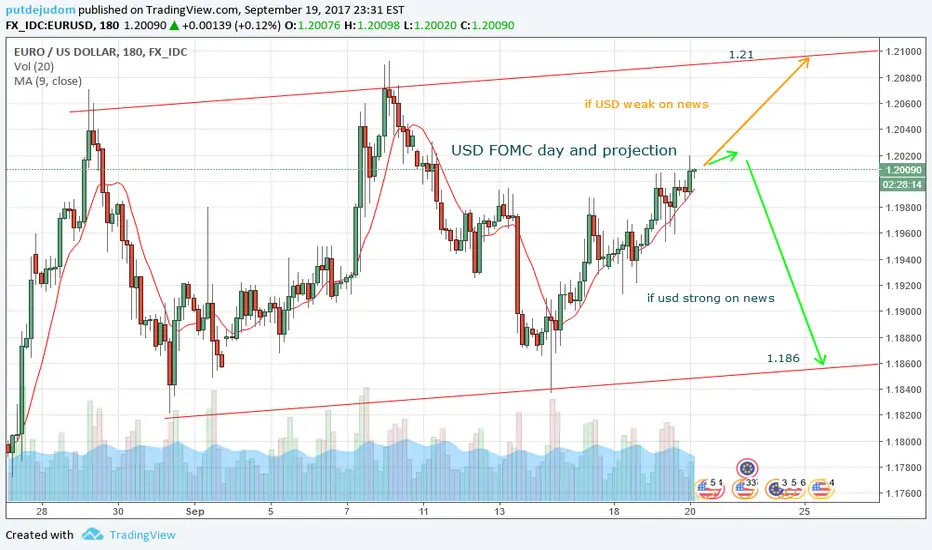
EURUSD on FOMC day target sept 2017Today this pair I will say depending on the news both side are hugely possible move
usd will move according to the economic projection
so I already predict how much it can move
BUT I don't know the direction yet since I don't know the future of what are they going to say in FOMC
so lets see how EURUSD will move tonight
enjoy trading
Please help to follow and like
Thank you
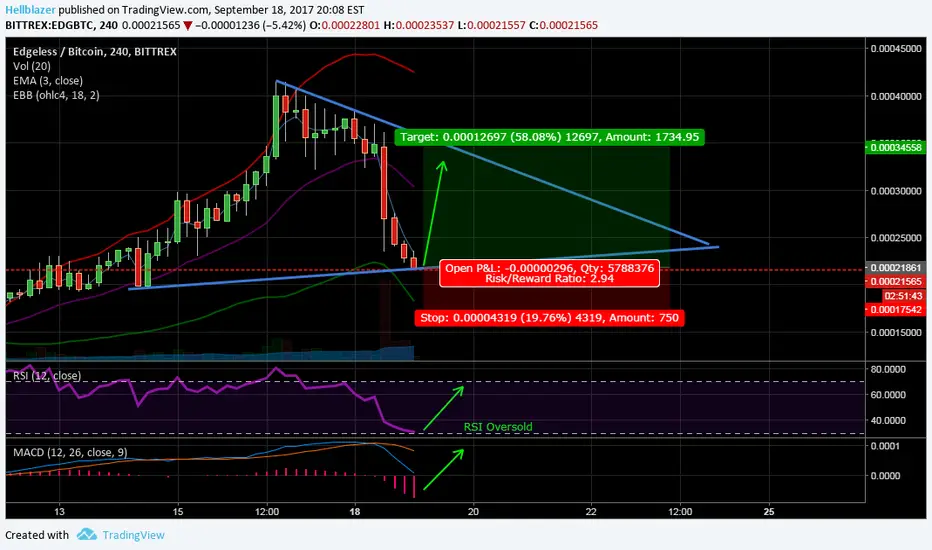
$EDG panic sell will recover quickEDG news today turned into a panic sell because of the License delay, nothing to worry about because it's coming.
Best time to buy, to me it's a non-risk buy, bounce at the trend line
Feel free and wait for bouce
Bears entering GJ?Seeing break of structure on lower Time Frames and clear bearish engulfing on 2+ time frames.
1 - 7 hour chart are around 88.6 - 100% retraces and this is where we will see sellers fight back and bring this pair back down or if we will see more bull action. Enter with as many confirmations as you can.
NZDJPY Double ScenarioWeekly range and price created a false break and it has bounced from the top. Our final target is the bottom of the range.
Daily - Bullish divergence formed. correction is expected to happen.
H4 - Triple cycle has completed itself. We have convergence and also divergence with false break.
Once the correction completes itself, look for breakout of the most recent trend line and then look for buys.
Once the price reaches this level look for confirmations for bearish reversal and then we can start looking for sells.
USDCAD big players orchestrating the next drop, don't miss it! simple as always. This is the big one we've been talking about!

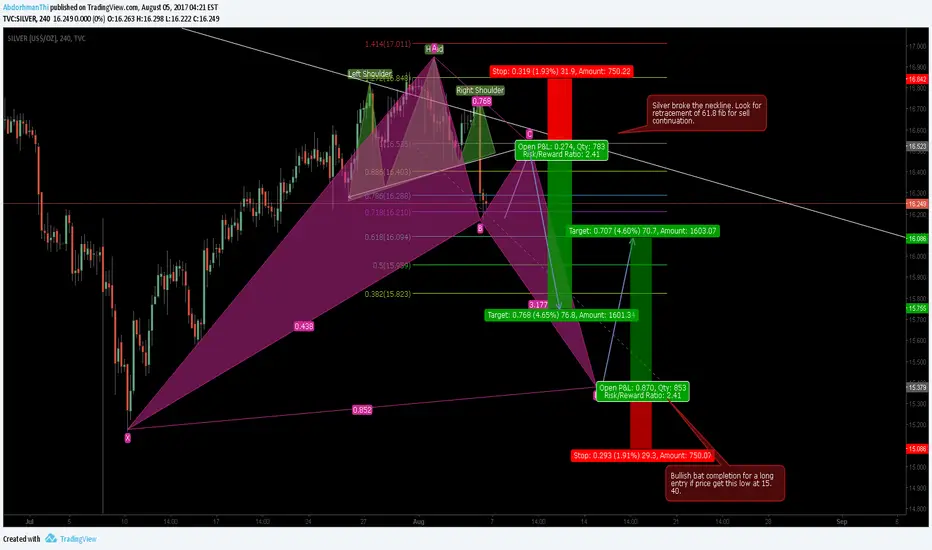
Silver: Sell then buy. Rinse and Repeat.Silver made a head and shoulder and respected the descending trend line. Now we will look for the golden number retracement to sell for a continuation. After selling there will be a good long setup at 15.40. Though I am not so sure if it will reach that level. But let us see.
Trade with care.
GBPUSD D1 possible Wavestructure With deep explaining.Hi guys i label all the waves for you waves those are in WXYXZ structure hope you like it .

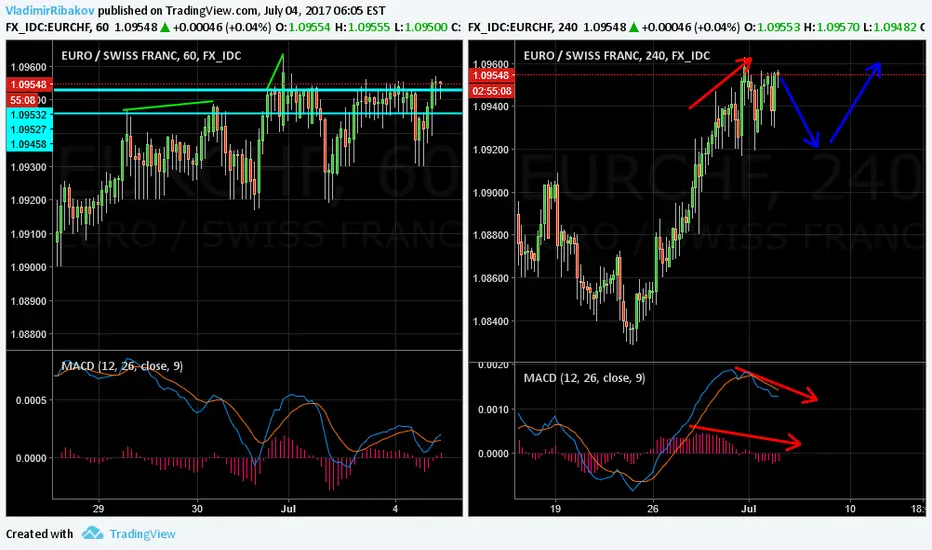
EURCHF Follow Up AnalysisIn the previous post last week, we said that we are after buys that will come immediately after corrections.
There were two false breaks on the H1 chart. We already see H4 divergence and I expect a short term bearish correction.
There are two possible trading scenarios now:
* Short Term Sells
* Longer Term Buys
Final target for the sell positions will be around the 1.09 level. Of course watch out for bullish divergences. Basically once you start getting Forex Triple B or sRs Trend Rider sell alerts, you can try shorts.
Next step would be to switch for buys. Once we start getting buy signals, at the levels where we have confirmations for the end of the correction, we will switch the trading direction and long the pair.
Let's first of all focus on the sells now, and when the time comes, I will update you.
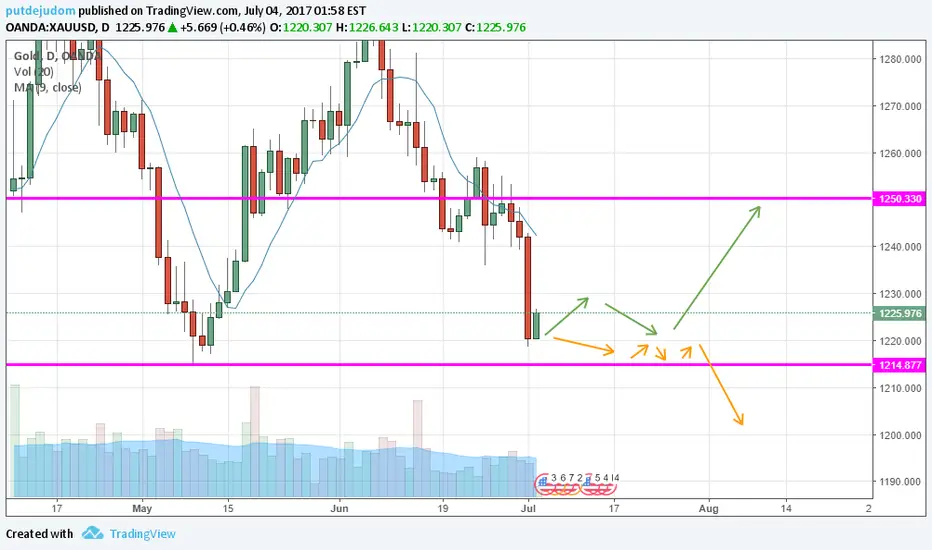
XAUUSD 1200$ or 1250$ UP or DOWN ?XAUUSD come to the point that have 2 different path
If it break down 1200$ possible
If it does not break down it will move to 1250$
Anyone who trade gold can comment which path you think it will go
If you like my work please help to like and follow
Thank you
Possible sell setup on KIWI, looks like longer term upsidelooks like we might not get the 5th corrective wave down. It will be nice if we get a short term sell setup, and even better if it decides to GO! Overall still thinking long for midterm. The overall fractal on weekly still looks like downside after a nice push up!

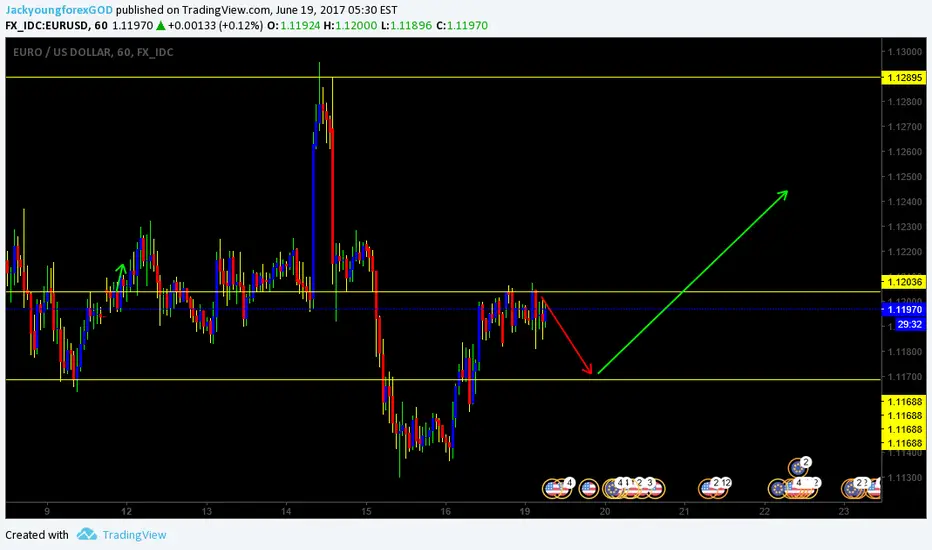
Eurusd shorting back to support then going long to continue buy Eurusd shorting back to support then going long to continue buy uptrend
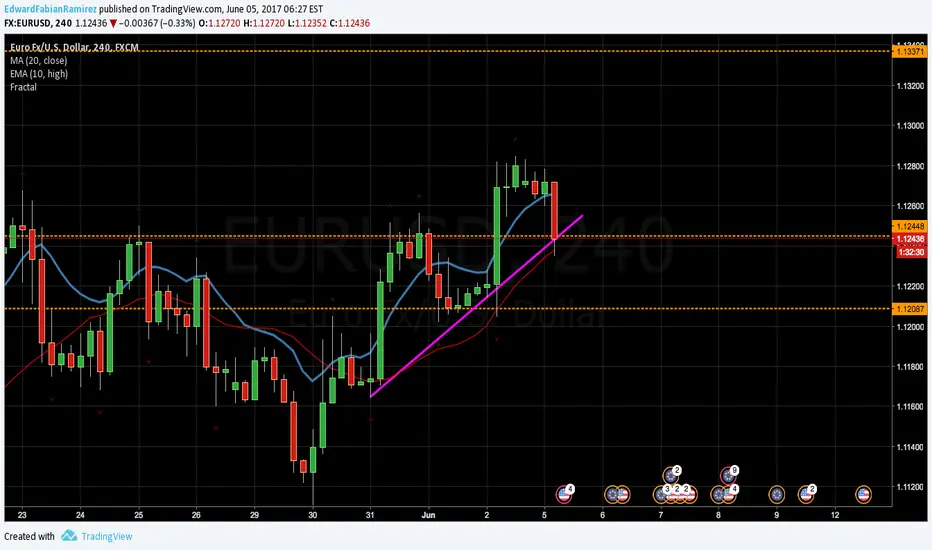
EUR/USD Analysis for Week 19.Hi everyone, this is just a log book for me on applying everything that I have learned and continue to learn as I go along. That being said, I do not advise you to base your trading on these "ideas".
Ok so this pair in the big picture has been hitting a bit of a slump. But lets take a look at it a little bit closer.
Weekly: there seems to be a resistance area around the 1.14100 level that has been hit around 4 times the the last 2 years and actually all around May and June.
____
Daily: Resistance levels around 1.13373 levels. So that can be a target if support is rejected. I am able to find a bit of a bullish trendline here on the daily:
____
4hr: So the 4hr seems to be bullish. My trendline was touched this morning but not sure if thats because of the upcoming from U.S. Also here in the 4hr chart there seems to be a previous resistance that became support at the 1.12085 level. Resistance level at 1.12448 but was broken last week on the NFP announcement. So now it could become support if trend continues bullish.
____
So here is my analysis:
Option 1 -
So we can brake the support level at 1.12448 and bounce off the 1.12085.
Option 2 -
Or we can just simply bounce off the 1.12448 support and start looking at 1.13373 as our target.
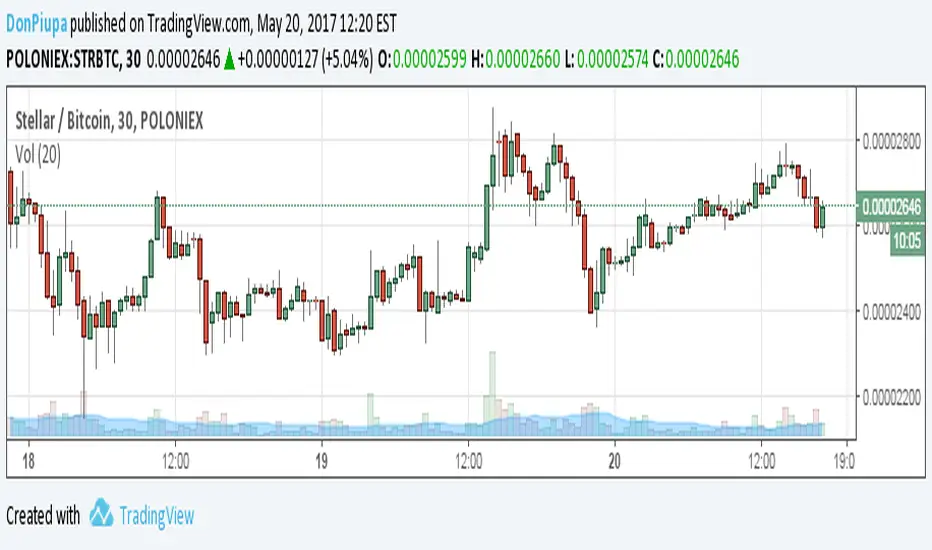
Buy NOW Stellar/Bitcoin and sell it at 0.00004000 BTCMarket cap
252.032 BTC
Current price
0.00002635 BTC
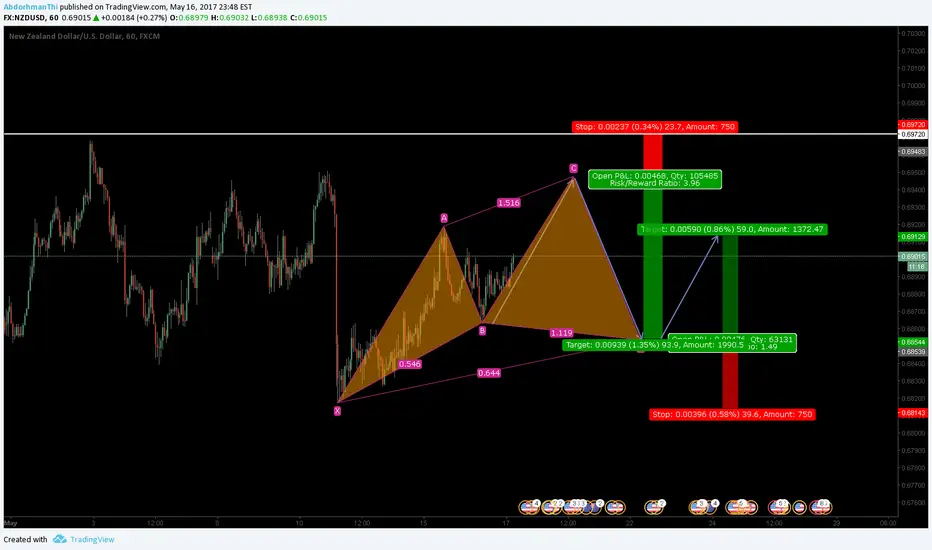
NZDUSD: Short into LongThis is the second play that can possibly happen on the NZDUSD pair. I am in favor of this happening more just because it give 2 great trading opportunities. Let see how this plays out.
Trade with care.
Weekly chart | Just an outlook Hi guys,
Technically: It seems the correction will be three waves that two waves completed and the third wave is not completed yet.
Fundamentally: Canada fundamentals are weaker than USA and Oil price is not also expected to rise so much that can improves Canada's economy.
Your likes and comments are appreciated
Thanks

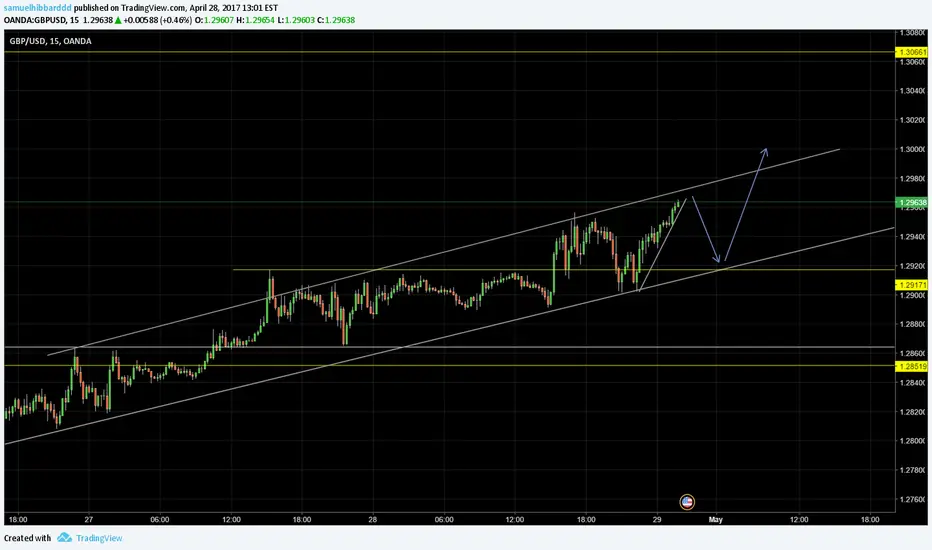
GBP/USD setupThe support and resistance lines are placed on the up trend as it broke through the fibonacci level resistance now it will be a support line.I assume the prices will increase till the resistance line at 1.2970 then it will be going into the downtrend till it reaches the previous resistance line which will now act as a support. Do place a stop loss and watch your trades