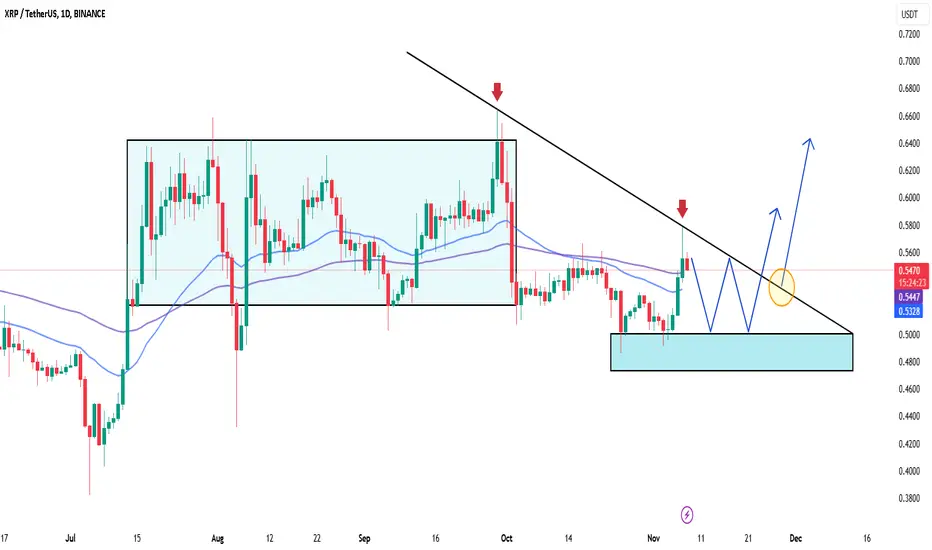
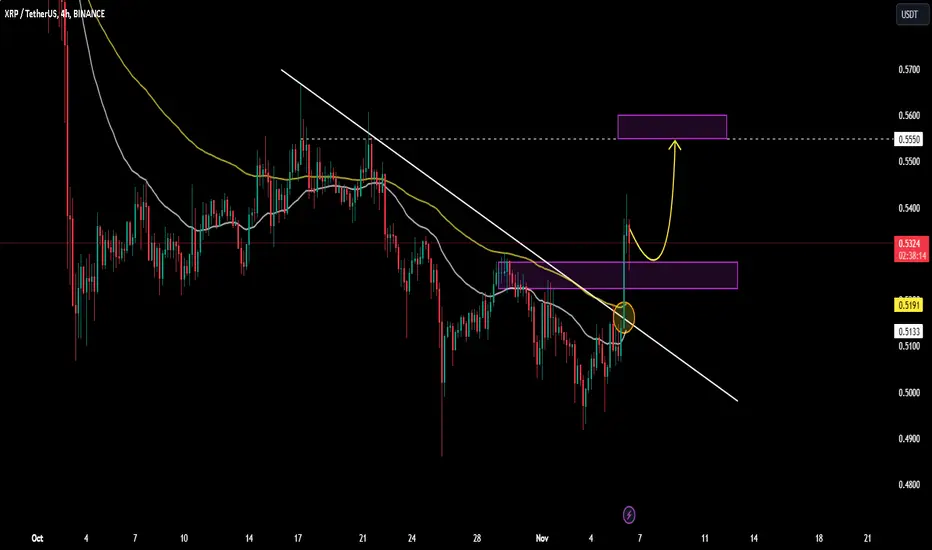
XRPUSDT: Consolidation and Potential Breakout SetupXRPUSDT is currently trading around 0.5475 USDT, facing downward pressure from a long-term descending trendline. The price has tested this trendline several times, indicating a strong resistance level that has yet to be broken.
A support zone (highlighted in blue) around the 0.5328 level has held strong, suggesting a consolidation phase within this range. If XRP can maintain support and consolidate further, a breakout above the trendline could set the stage for a bullish move, potentially targeting 0.60 USDT or higher.
However, if the price fails to hold the support zone, we may see a pullback to lower levels. Traders should watch for a clear breakout from this descending resistance or a confirmed hold of the support to determine the next move.
Sell-buy
ETH Gearing Up for $4,000?The ETHUSDT chart shows a potential bullish scenario, with Ethereum forming a rounded bottom pattern on the daily timeframe. Currently trading around $3,333, ETH has rebounded significantly from its previous lows, indicating a strong upward momentum.
Key Points to Consider:
Rounded Bottom Formation: This pattern typically suggests a reversal of the downtrend, hinting at a possible sustained upward movement if the formation completes.
Fibonacci Levels: The chart marks key Fibonacci retracement levels, which could act as future support or resistance. The target at the 1.618 Fibonacci extension is around $4,008, suggesting a potential upside if ETH breaks through resistance levels.
Resistance at $4,000: The area around the $4,000 mark could pose significant resistance, which aligns with the completion of the rounded bottom. Breaking through this level might signal a stronger bullish continuation.
Potential Strategy: Traders might consider looking for a breakout above the $3,386 level as an entry point, with an initial target near $4,000. However, a failure to hold above key support levels could indicate a reversal, so close monitoring is advised.

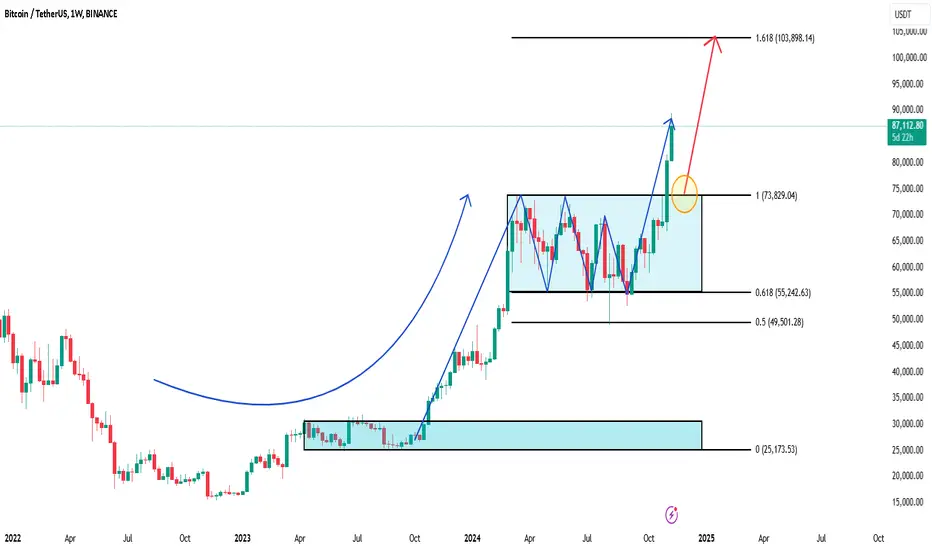
Bitcoin Eyes $100K – Next Stop in the Bull Run?Currently, Bitcoin is trading within a strong upward trend, breaking past previous resistance zones. If the price holds above the $73,829 level (the 1 Fibonacci level), it suggests a clear path toward the next Fibonacci extension at the 1.618 level, around $103,898.
The structure on the chart shows a steady formation with higher lows and recent bullish momentum. The area around $73,829 serves as a critical support level, and any retracement toward this level could present a buying opportunity for further upward movement.
Should Bitcoin continue to gain momentum, a push toward the psychological $100,000 mark could be within reach, potentially marking a historic level for BTC traders and investors.
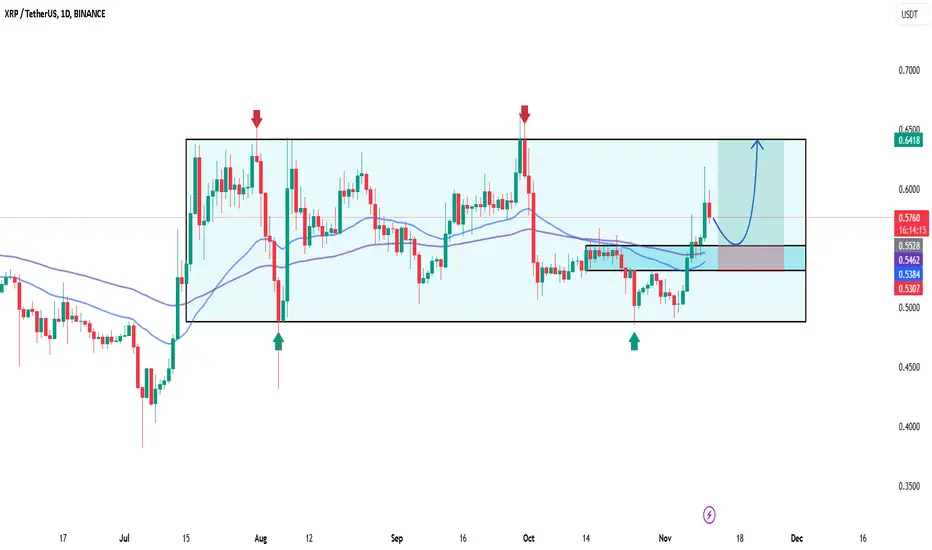
XRP Hits Resistance Level: Will It Break Through?Based on the XRP/USDT chart, it appears that XRP is trading within a clear rectangular range, with resistance around the $0.64 level and support near $0.53. Recently, XRP attempted to break above this range but has returned within the channel after facing resistance.
Looking forward, if XRP successfully rebounds from the $0.55-$0.53 support zone, there is a potential for it to challenge the upper resistance level once again. Traders should watch for confirmations around these key support and resistance levels, as a breakout above or below could signal a new trend direction.
EUR/USD Under Pressure Amid USD Strength and Eurozone ConcernsToday, the EUR/USD currency pair is under downward pressure due to a strengthening U.S. dollar.
This decline follows recent market uncertainty, particularly as the U.S. political landscape has experienced volatility, and strong U.S. economic data has fueled demand for the dollar.
The euro has also been weakened by economic concerns in Europe, including ongoing challenges in Germany, which have reduced investor confidence in the eurozone's stability.
Looking forward, the EUR/USD pair may face further downward movement if the U.S. economy continues to strengthen, driving expectations of higher interest rates.
If the pair breaks below the 1.0650 support level, it could move towards lower levels in the short term. However, political events and economic data will remain key factors influencing the pair's direction.
Gold Price Today: USD Strength Causes Sharp DeclineGlobal gold prices have sharply decreased as the USD Index rose to 105.5 points, marking the dollar's highest level in over four months.
The decline in gold is largely driven by the strength of the USD and rising Treasury yields.
Additionally, a steep drop in crude oil prices to $68 per barrel and gains in U.S. stocks have shifted investor interest toward energy and equities.
Consequently, investment in precious metals remains low, further pressuring gold downward.
The short-term bearish trend is expected to continue, with more selling anticipated
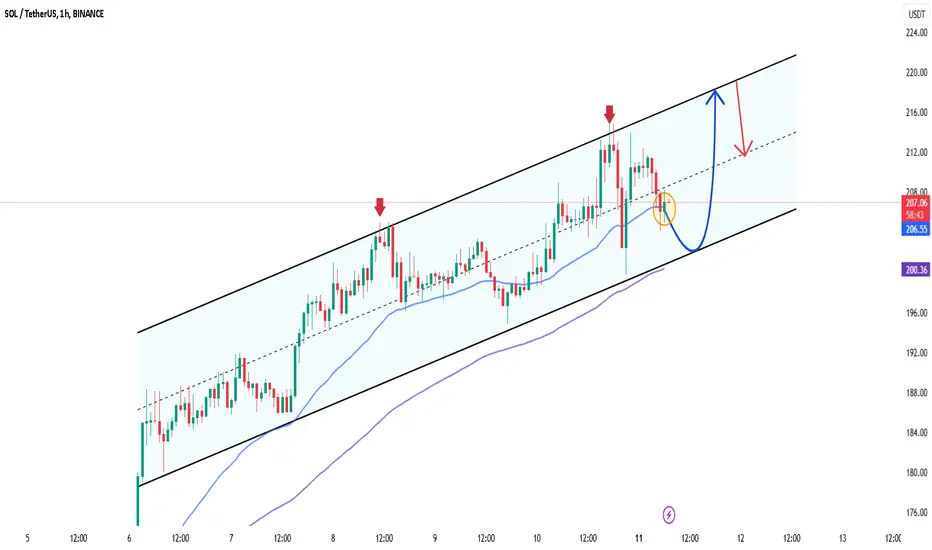
SOLUSDT : Uptrend channel continues to operate SOLUSDT is currently trading within an ascending channel, as indicated by the price's movement along the parallel trendlines. The chart shows a potential for price retracement towards the channel's lower boundary near the $200.20 level, where a support zone is established. If this support holds, the price might experience a rebound back towards the upper trendline of the channel, targeting higher levels around $215 and above.
The moving averages also support the overall upward trend, with a potential bounce scenario that could confirm the continuation of the bullish structure within the channel.
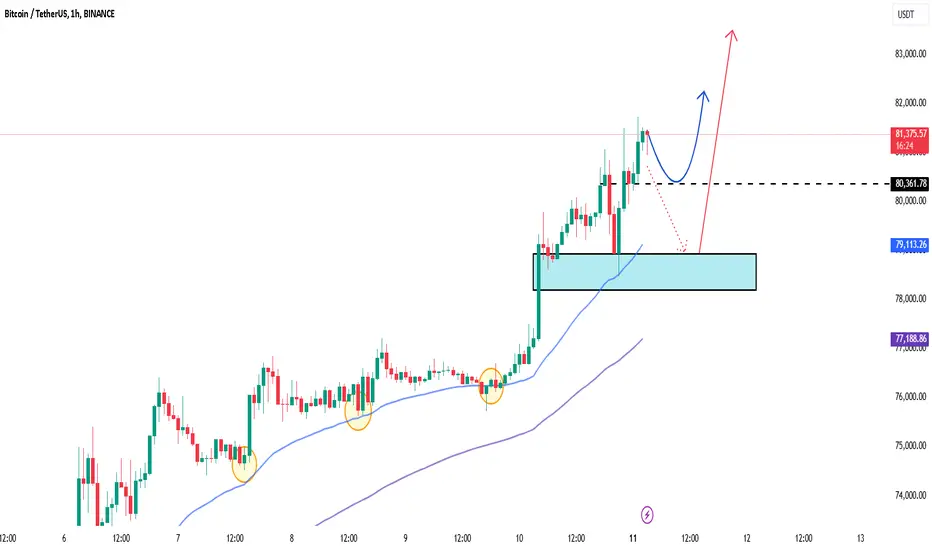
BTCUSDT: Strong Buy Opportunity on Key Support RetestBTCUSDT is trading around 81,230 USDT, with bullish momentum showing signs of a potential pullback toward the support zone between 79,113 and 77,188 USDT (highlighted in blue). This area has consistently acted as a solid support and aligns well with the moving average, suggesting a favorable entry point for buyers.
A pullback to this zone presents an ideal buying opportunity, with the potential for BTCUSDT to bounce back strongly and push toward new highs above 82,000 USDT. The expectation is for BTC to maintain its bullish trend upon reaching this support, providing an attractive setup for long positions.
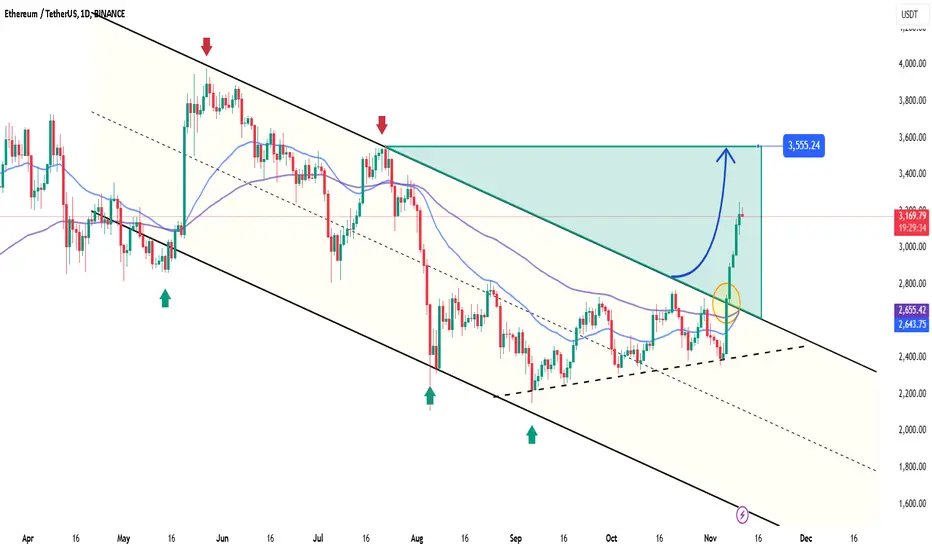
ETHUSDT: Strong Bullish Breakout with Target at $3,550ETHUSDT has recently shown impressive bullish momentum, breaking out of a prolonged descending channel. Currently trading around $3,171, Ethereum has surged past key resistance levels, signaling a potential continuation of its upward trajectory.
The breakout from the descending channel suggests a bullish reversal, with a likely target near the $3,550 mark (highlighted in the green area). This target aligns with the upper boundary of the channel and represents a major resistance level.
Technical indicators and moving averages support this bullish outlook, as Ethereum gains strength above its moving averages. Traders looking for long positions may consider buying on any minor pullbacks toward $3,000, aiming for a target of $3,550.
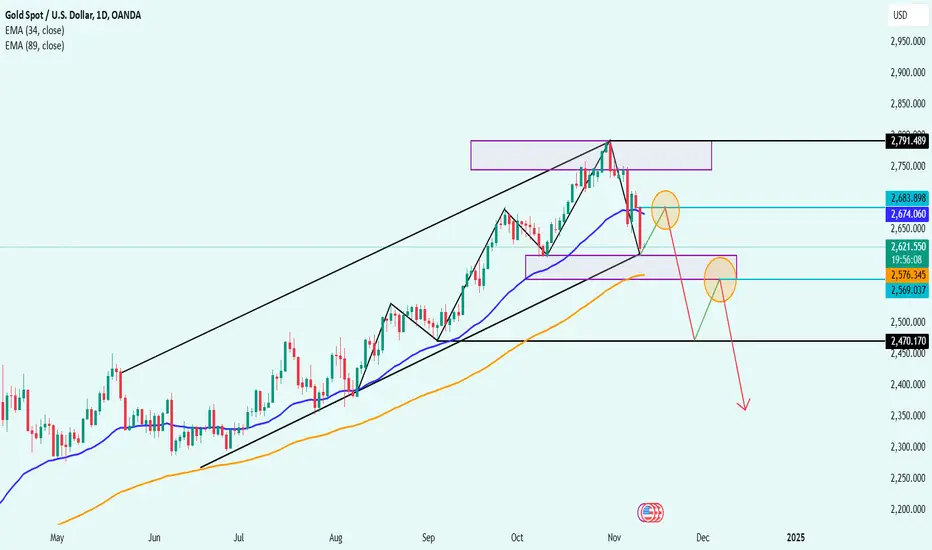
Gold Prices Today: Sharp Drop at Market OpenOn the morning of November 11, gold prices opened at $2,674 per ounce, down approximately $10 from the previous week's close. This sharp decline followed the recent election, sparking a wave of investor sell-offs and raising concerns about the future direction of the precious metal.
The decline may persist for about six weeks, but medium- to long-term demand is expected to rise. Many central banks are continuing to diversify their assets with gold to reduce dependence on the US dollar. Additionally, the Federal Reserve and other central banks may maintain accommodative monetary policies to support slowing economies, potentially creating favorable conditions for gold prices to rebound in the future.
EUR/USD: Euro Struggles Amid UncertaintyThe EUR/USD pair continued its decline for a second consecutive session, trading around 1.0720 during Monday's Asian trading hours. The pair was pressured by a stronger U.S. dollar and political uncertainty in Germany.
If Trump's fiscal policies are implemented, they could boost investment, spending, and labor demand, raising inflation risks. This might lead the Fed to adopt more restrictive monetary policies, strengthening the dollar and further pressuring EUR/USD.
Currently trading near 1.07, the pair could decline further if the Fed continues to tighten monetary policy. However, technical indicators hint at a potential mild recovery.
The near-term outlook for EUR/USD depends on signals from the Fed and ECB interest rates. While the ECB maintains its accommodative monetary policy, strong regional data or any Fed policy shifts could support a short-term rebound in EUR/USD, despite ongoing market volatility.
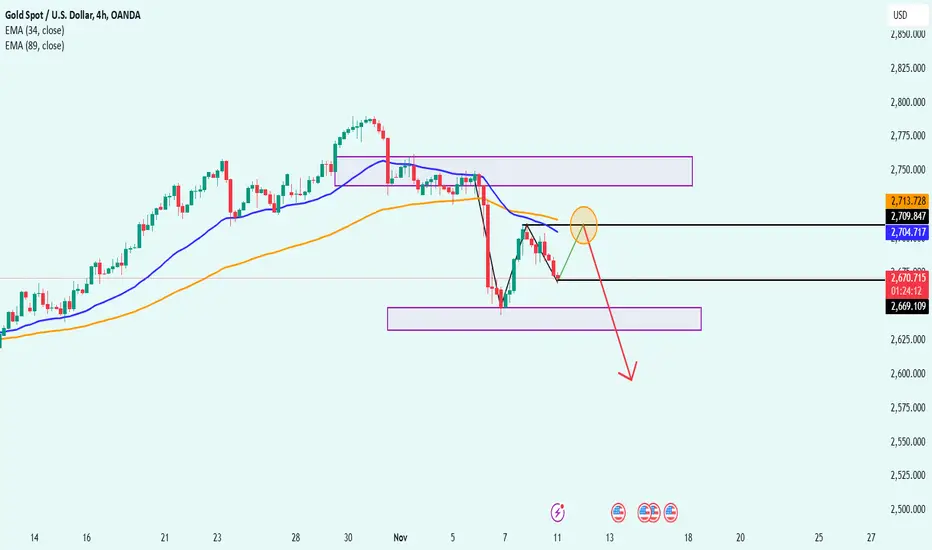
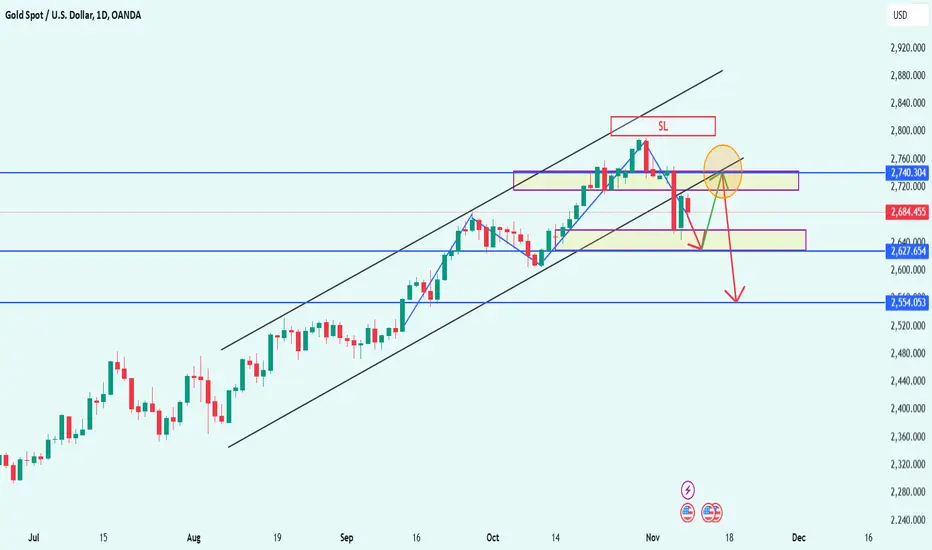
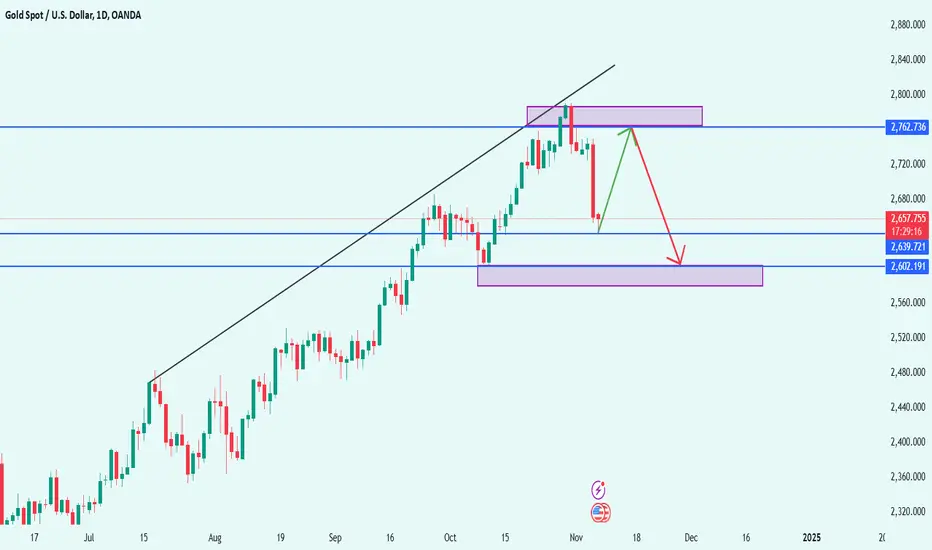
XAUUSD 10/11/24XAU Followed our newly established selling buyer last week, a clear shift to the downside. Of course, this was helped by the US election and the results. We now have the same scenario and the same bias in place. We have one area of supply that has already been tapped into. We have 2 liquid highs that are situated at that area of supply and then a higher point of supply which is untapped. Now ultimately we aim for the low as always a pullback is not necessary, but this is gold. So there is a scenario that all these points for selling will fail and we will then aim for the all time high. Our current bias is bearish if this changes during the week and we will update everybody. if it does not we will continue to sell this down to lower pricing before institute becomes interested once again.
Follow your plan and stick to your risk!

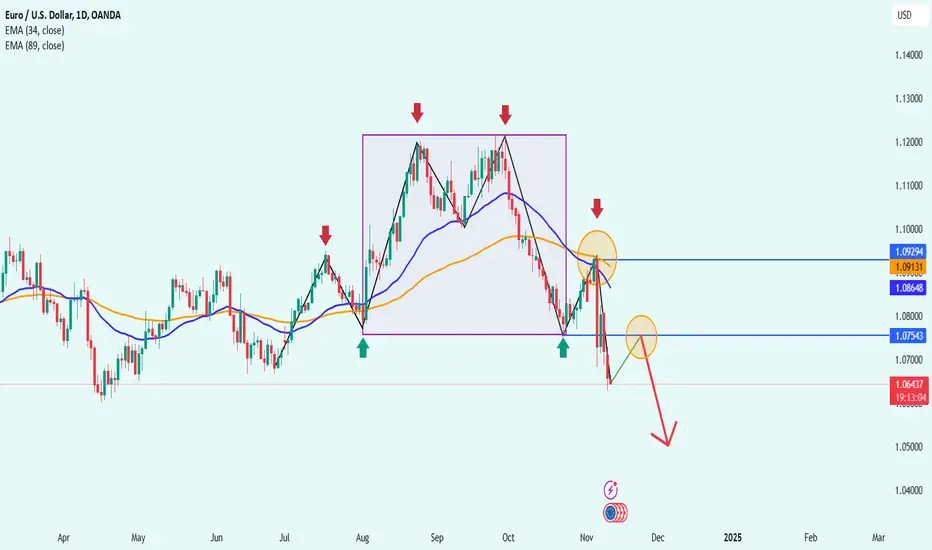
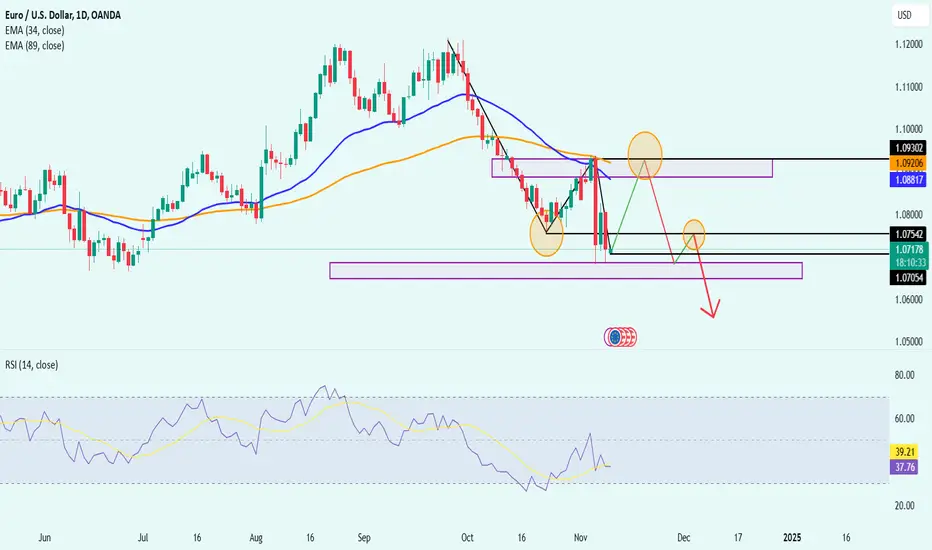
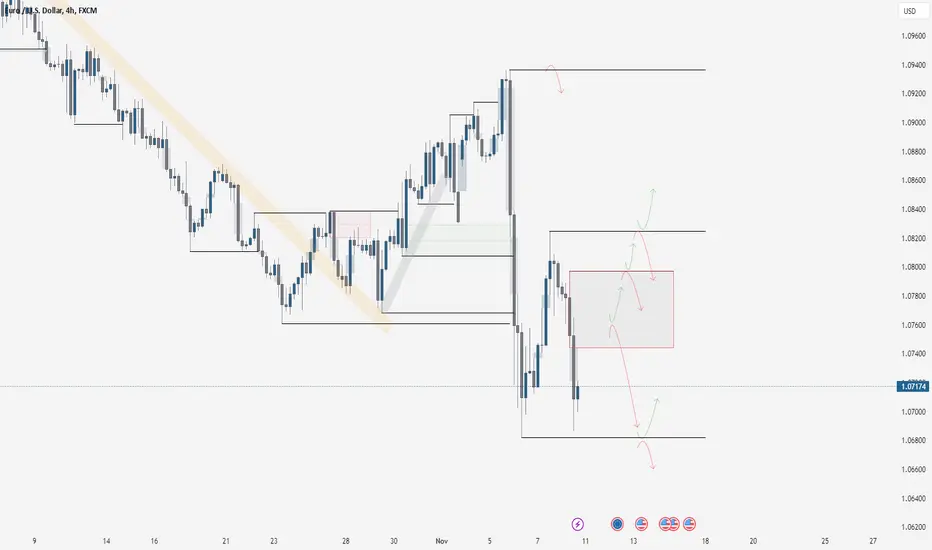
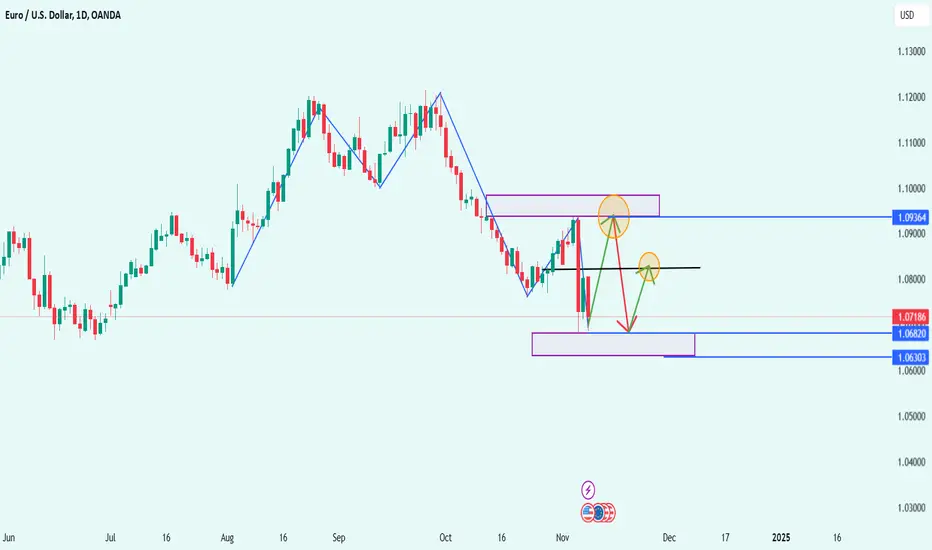
EURUSD 10/11/24Last week’s shift in the EU bias changed our view from short to long. However, as we always say, high-impact fundamentals can move the market, sometimes in line with our bias and sometimes against it. In the case of the U.S. election, the result pushed prices lower. This happened because the USD gained significant strength when the new president was elected.
Now, we're back to our more favorable sell bias. With the recent shift lower, the higher timeframe aligns with this bias again, allowing us to target last week’s lows. We have several points to watch for a bearish shift: the supply area in the middle of our current range and the two highs at the top of the range from Friday’s 4:00 AM move. If these highs are taken, we expect price to sell off and continue down to our target lows.
There's a possibility of price moving up to the major high we’ve marked, but this is unlikely given our bearish bias. If this happens, we’ll still aim for the target low. A pullback would give us an even better position to sell into that low. As it stands, we have a relatively large fundamental range, so price may fluctuate within this range for some time.
Follow your plan and stick to your risk!
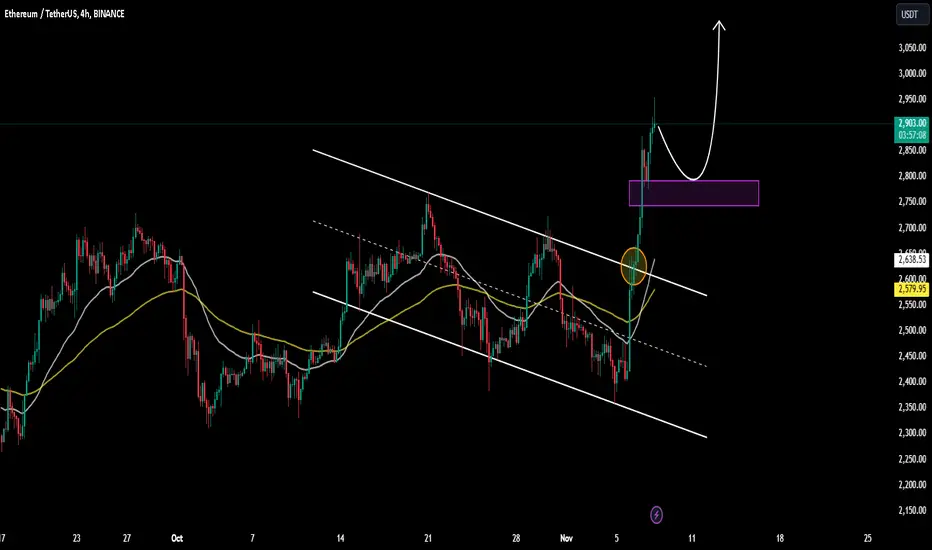
ETH Eyes $3,000: Bullish Breakout Signals More Gains AheadBINANCE:ETHUSDT has recently broken out of a descending channel, surging above the 2,900 USDT level. This breakout suggests a strong bullish momentum, with the price now targeting higher resistance levels.
The next key area to watch is the support zone around 2,800 USDT (highlighted in purple). If ETH pulls back and successfully retests this zone, it could confirm the breakout and set the stage for another upward move, possibly toward the 3,000 USDT mark or higher.
This setup indicates a bullish outlook for ETH, with the support level at 2,800 USDT acting as a potential entry point for traders looking to capitalize on the next leg up.
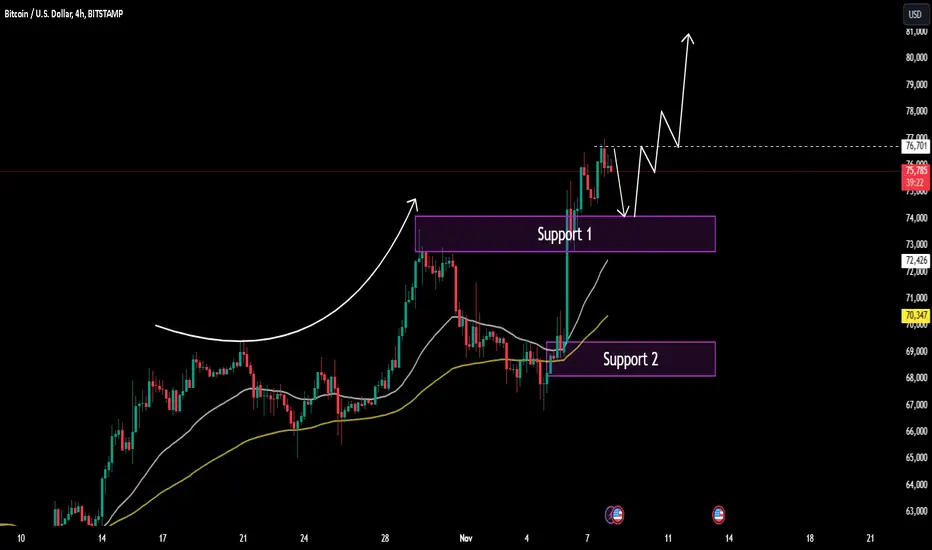
BTCUSDT Trading Strategy TodayBTCUSD is trading around 75,838 USD, showing strong upward momentum with potential for further gains. The chart highlights two critical support zones: Support 1 around 74,000 USD and Support 2 near 72,400 USD.
If BTCUSD experiences a pullback, these support levels could act as launching points for another upward move. Holding above Support 1 would strengthen the bullish outlook, targeting the resistance around 76,700 USD and potentially higher.
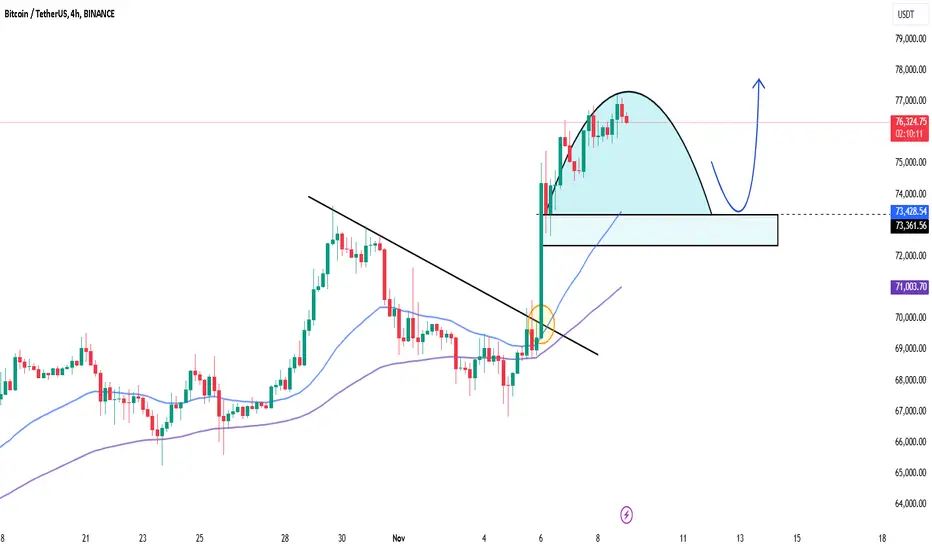
BTCUSDT: Key Support Zone for Potential ReboundBTCUSDT recently surged, reaching around 76,350 USDT, but now shows signs of a potential pullback. The chart indicates that a retracement could occur towards the support zone around 73,400 USDT (highlighted in blue).
If BTC holds above this support level, it could create a strong foundation for another upward push, potentially leading to a continuation of the bullish trend. Traders should watch for price action around this support zone, as a bounce from here may signal a resumption of the uptrend.
EUR/USD November Forecast: Fed Pressure and Market VolatilityThe EUR/USD pair is experiencing significant volatility in the forex market, currently trading around 1.0719. This volatility is influenced by both U.S. and European economic and political factors.
In November, the EUR/USD pair may face pressure from both the Federal Reserve and the European Central Bank (ECB) policies. Fed officials have hinted at maintaining higher interest rates if inflation persists, which could strengthen the USD and potentially weaken the EUR/USD pair, especially if the Fed tightens monetary policy further.
Technical analysis suggests a potential mild recovery for the EUR/USD pair, with the pair having rebounded from a recent low of 1.0517. However, resistance levels between 1.077 and 1.088 may limit further upward movement. If the pair maintains momentum and breaks key support levels, it could potentially reach higher levels. Nevertheless, U.S. election-related volatility may introduce short-term instability to the market.
Gold Prices Plummet Amid Rising Risk AversionAfter a slight uptick yesterday, global gold prices took a sharp downturn on the morning of November 9th. Spot gold declined by $24.2 to $2,685 per ounce, while gold futures fell $21.5 to $2,692 per ounce.
The surge in the US dollar following the recent political shift has put significant pressure on gold prices. As markets adapt to potential policy changes, investors are shifting towards riskier assets, leading to a sell-off in gold.
Analysts predict that gold prices may fluctuate within a support range of $2,640 to $2,700. A breach below the $2,640 level could signal a further decline toward the next support at $2,600. However, the long-term outlook for gold remains optimistic, underpinned by expectations of interest rate cuts and persistent geopolitical tensions.
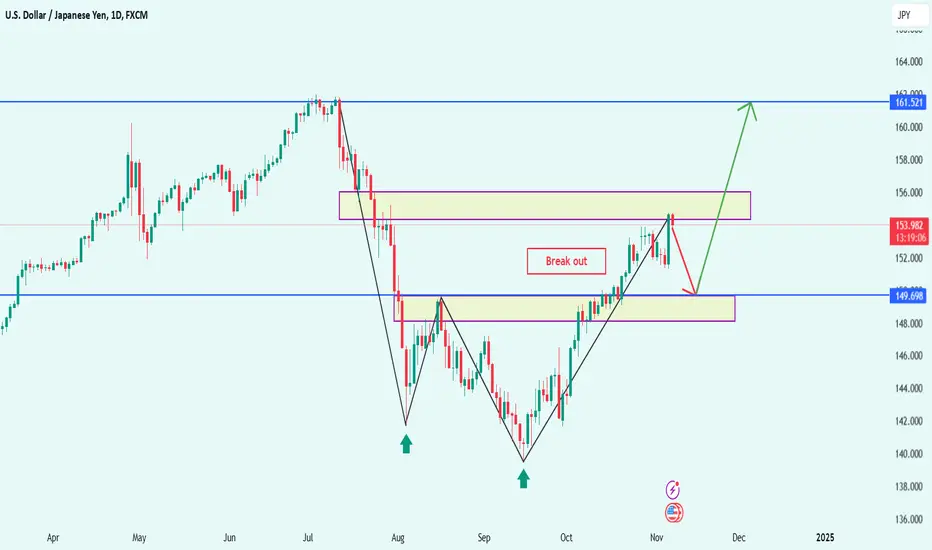
USD/JPY Rate High: Yen Under Pressure from Strong USDCurrently, USD/JPY is rising as the U.S. dollar strengthens on expectations that Trump’s policies could impact Federal Reserve interest rates, driving the pair above 150.
In the short term, USD/JPY may stay elevated, though long-term trends will depend on Fed rate decisions and the Bank of Japan’s (BOJ) response. While BOJ maintains its loose monetary stance, the Fed’s potential for high rates to control inflation continues to support the USD/JPY pair. However, if the Fed signals rate cuts or BOJ shifts its policy, USD/JPY may decline.
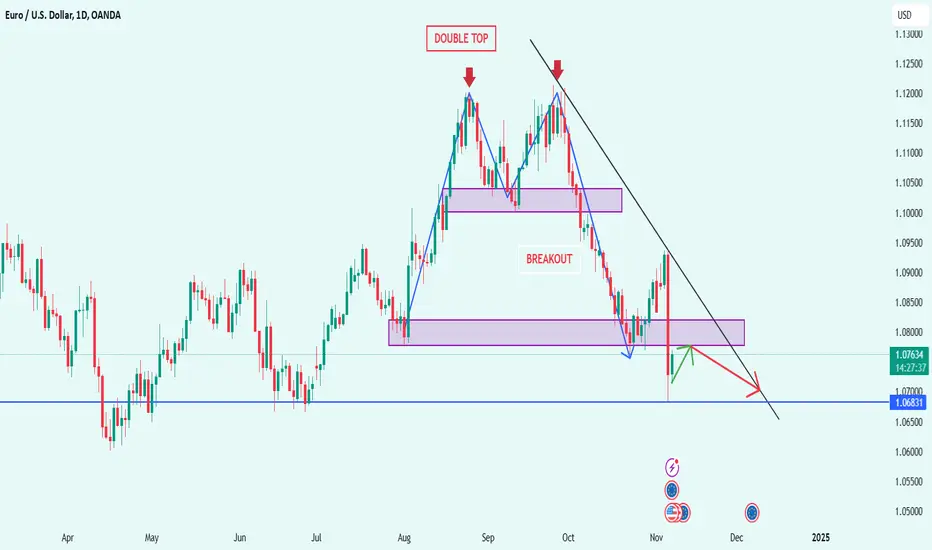
EUR/USD May Decline as USD Gains on Trump-Related TradesToday, the EUR/USD pair is under pressure due to the strength of the USD, driven by expectations of higher U.S. interest rates and recent political developments. The pair has fallen to a multi-month low, hovering between 1.0685 and 1.0680.
With increased volatility around the U.S. political environment—particularly after Donald Trump’s election win—alongside a Double Top pattern on the market chart, a short-term forecast suggests that if EUR/USD breaks below the 1.07 level, it may test support around 1.05. However, if economic indicators in the eurozone improve, the EUR/USD could have potential for a rebound within its current range. The Federal Reserve's rate decisions and any new fiscal policies could further influence the currency pair's direction in the coming days.
XRPUSDT Breaks Downtrend, Bullish Momentum BuildsXRPUSDT has successfully broken out of its downtrend and is now moving upward at a rapid pace.
Currently, XRPUSDT is up by more than 3.6% on the day, confirming a new support level as marked on the chart. With signals from the EMA 34 and 89, XRPUSDT is gaining bullish momentum fueled by positive market sentiment. The confluence of the EMA levels with this support area is shaping up to be an ideal entry point.
Consider entering a position wisely, and be sure to set your take-profit and stop-loss levels!
Global Gold Price Drops Sharply After Trump WinsAfter news of Trump’s win broke, gold prices dropped by 3% within a single day due to the strong rebound of the U.S. dollar. This decline was primarily driven by traders anticipating that Trump’s trade policies would include higher tariffs, likely keeping interest rates elevated and making gold more expensive for holders of other currencies.
According to me, gold prices began to decrease shortly after the election ended, as the U.S. dollar surged, exerting downward pressure on gold.
In the short term, gold prices may experience significant volatility as markets assess the impact of future Federal Reserve decisions and respond to global risk factors. Although fluctuations are expected, if U.S. interest rates decrease or additional geopolitical risks arise, gold prices could return to an upward trend.
ETHUSDT on a Strong Bullish Run: Breaking New GroundToday, ETHUSDT is maintaining a powerful upward trend, trading around 2840 USDT with an impressive gain of over 4.44% for the day.
After a period of consolidation within a wedge pattern, it successfully broke through the sideways trend and surged upward.
The immediate target now is the higher resistance zone around 3400 USDT, with a closer level at 3170 USDT as a potential checkpoint.
What are your thoughts on ETHUSDT's trend? Share your opinion in the comments below. Good luck!
