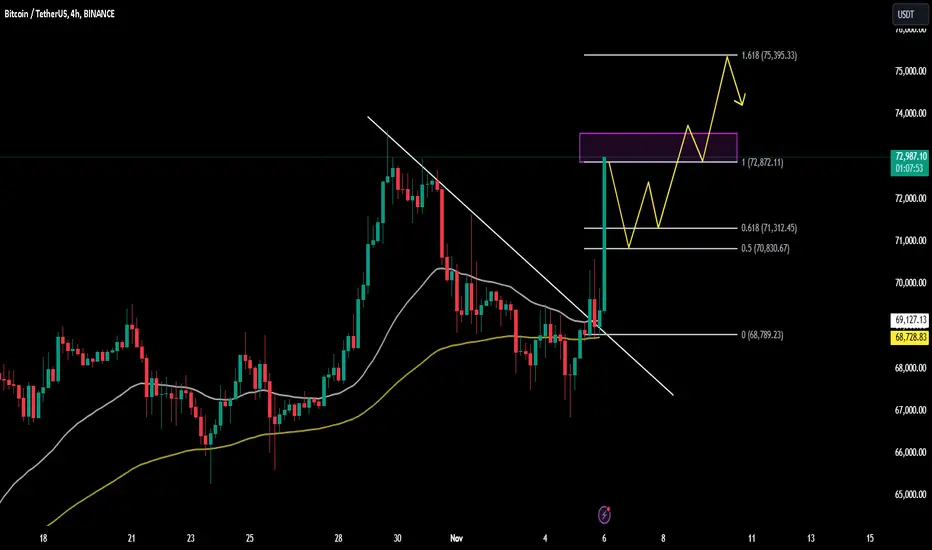
BTCUSDT Near Key Resistance – Another Rally Ahead?BTCUSDT is currently trading around a high of 72,890 USDT, with prices surging since its last breakout from the downtrend at 68,700 USDT.
The coin is gaining strong momentum due to several key factors:
Expectation of a Bitcoin Spot ETF in the U.S.: Investors anticipate that the SEC will approve a spot Bitcoin ETF soon, paving the way for institutional inflows.
Positive Sentiment Ahead of the U.S. Elections: Economic policy uncertainty has led investors to view Bitcoin as an alternative asset for value preservation.
Interest from Major Financial Institutions: Growing interest from top financial institutions is boosting confidence and demand for Bitcoin.
From a technical and indicator perspective, BTCUSDT is approaching a critical resistance level. If it successfully breaks through, another strong rally could be on the horizon!
Sell-buy
BNBUSDT todayBNBUSDT is currently trading around $561.56, and it remains within a descending channel, showing clear bearish sentiment. However, a short-term rebound may be on the horizon as the price has reached a key support zone around $550, which could trigger a temporary upward movement.
The chart indicates a potential bounce towards the resistance area around $578.63. If this level holds, it would provide a good opportunity for sellers to re-enter, possibly driving the price back down toward the channel's lower boundary.

SOLUSDT Faces Bearish Pressure Amid EMA RejectionToday, SOLUSDT is trading near $160.91, with the trend clearly tilted downwards. Price has encountered resistance around the $164.77 - $166.34 zone, where it has repeatedly failed to break above the EMA lines, signaling bearish dominance.
The rejection from these EMA levels highlights a lack of buying strength, keeping sellers in control. This trend suggests potential further declines, with the next target support level in the $148 - $149.33 range. Should this level hold, it may spark a short-term recovery. However, as long as SOLUSDT remains under the EMAs, the outlook stays bearish.

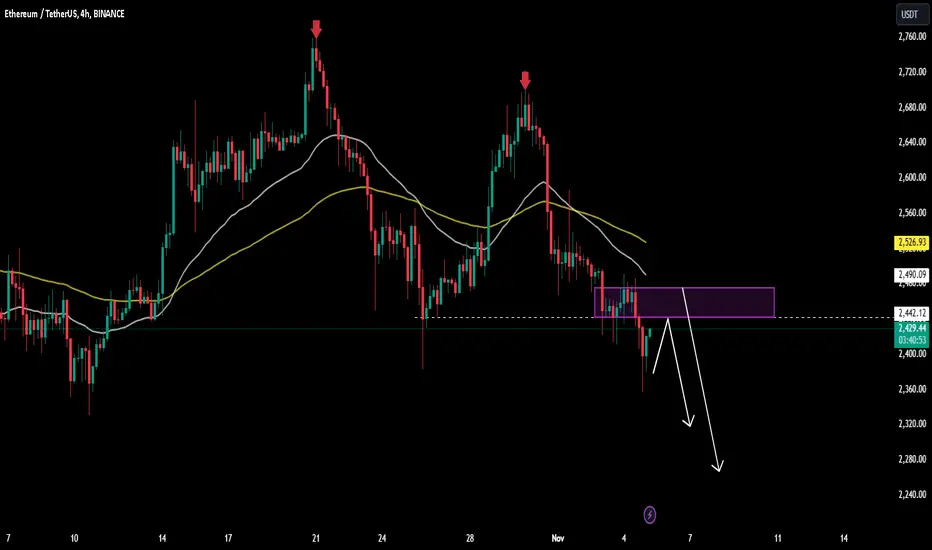
ETHUSDT: Bearish Momentum Signals Further DeclineETHUSDT is showing clear bearish momentum on the 4-hour chart, with prices trading around $2,422. The downtrend is supported by the price consistently staying below the 34 and 89 EMAs, indicating strong selling pressure.
The purple resistance zone around $2,490 has held firm, preventing any upward movement. As shown in the chart, ETH appears poised for further declines if it continues to respect this resistance level. Potential targets for the downside are near $2,360 and $2,280, aligning with recent lows.
Traders might consider shorting opportunities if ETH remains below the resistance, with stop-losses set above the $2,490 level. Keep an eye on market sentiment and technical indicators to confirm the bearish outlook.
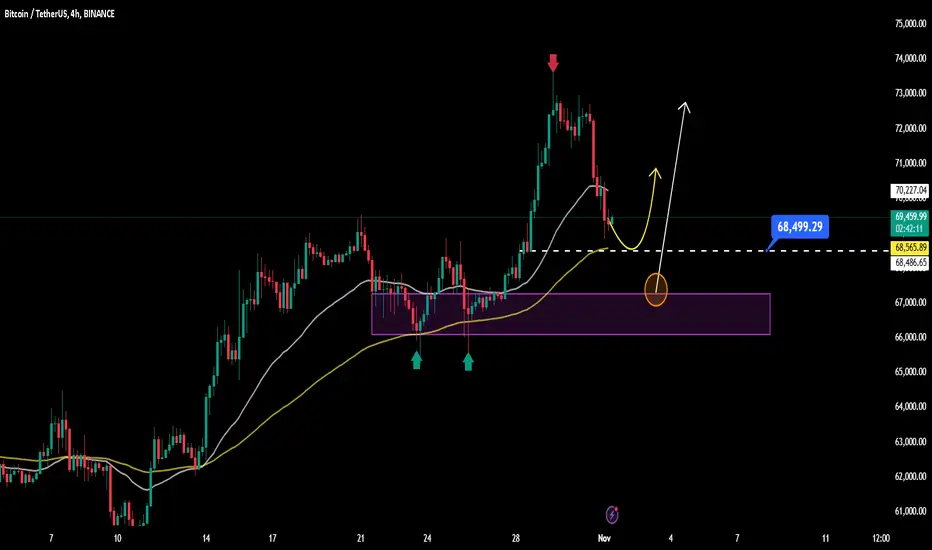
BTCUSDT Based on the chart, here’s a concise bullish trading strategy:
Key Support Zone: Watch the area around 68,500 USD, where the price is likely to retrace and rebound.
Entry Point: Consider entering a buy position if the price touches the support zone around 68,500 USD and shows signs of a bullish reversal.
Take Profit Target: Aim for 70,200 USD or higher, where the price previously reached a peak.
Stop Loss: Place a stop loss below the support level at 68,486 USD to manage risk in case of a breakdown.
This strategy anticipates that the support zone will hold, allowing the price to bounce back for the next upward wave.
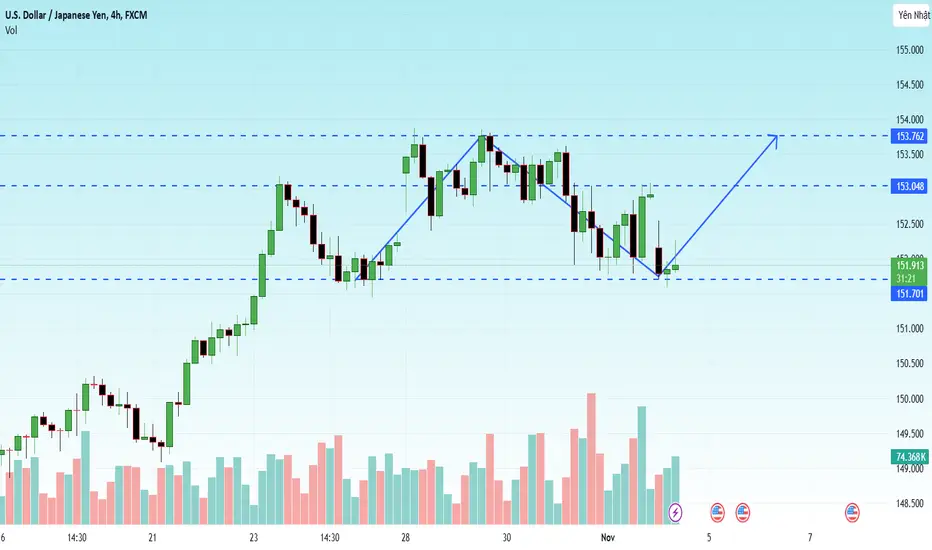
USD/JPY Decreases Slightly: Market Awaits Fed's DecisionHello everyone,
Today, the USD/JPY exchange rate is experiencing a slight decline, currently around 151,92.
This weakening is related to expectations of an interest rate adjustment by the Federal Reserve, along with caution ahead of key economic data and geopolitical conditions. I believe that the exchange rate may continue to fluctuate as new economic information is released and as further indications of upcoming monetary policy become available.
Medium-term forecasts suggest that USD/JPY could recover, but this will depend on U.S. economic data and global developments related to the safe-haven demand for the Japanese yen.
Gold Prices Rise, Promising Recovery After the ElectionHello everyone,
The price of gold has risen slightly to $2,735 per ounce in the morning trading session on Monday after a slight adjustment over the weekend due to profit-taking pressure and a strong US dollar.
The main driving force behind the increase in gold prices remains the political instability, particularly the ongoing election between former President Donald Trump and Vice President Kamala Harris, which is prompting investors to turn to gold as a safe-haven asset. Additionally, geopolitical tensions in the Middle East and prolonged inflation forecasts are also contributing factors supporting gold's upward trend.
It is expected that gold price will continue to increase in the near future. The political instability and the need for deep assets in the context of global tensions will be the main driving force of this increase. If the economic indicators from the US are unfavorable, the gold trend may be further strengthened.

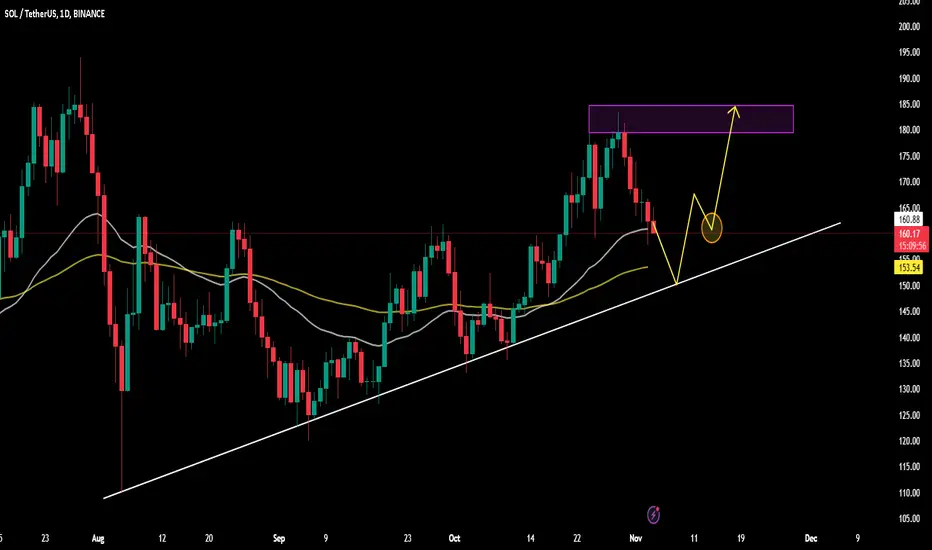
SOLUSDT Poised for Potential Upside Amid Market NewsSOLUSDT is showing positive signs based on technical factors and market news. The current support level at $153.54 is acting as a potential rebound point, aligned with a short-term upward trend.
Investor focus is on recent developments in the Solana ecosystem and new partnerships within the decentralized finance (DeFi) sector.
If the bullish momentum holds, the next target could reach the resistance level near $185, presenting a promising opportunity for further recovery.
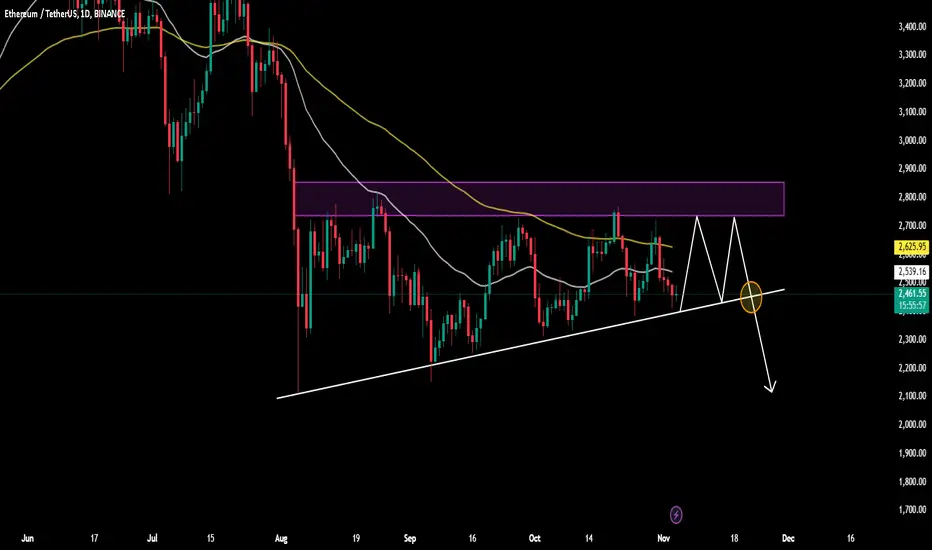
ETH Awaits Breakout at $2,456 Level ETHUSDT is currently hovering around the $2,456 mark, consolidating within a wedge pattern on the 1D chart.
As for the trend, ETHUSDT appears poised for a breakout, with potential downside movement as signals from the 34 and 89 EMA are aligning in favor of the bears.
Wishing you smooth and successful trading!
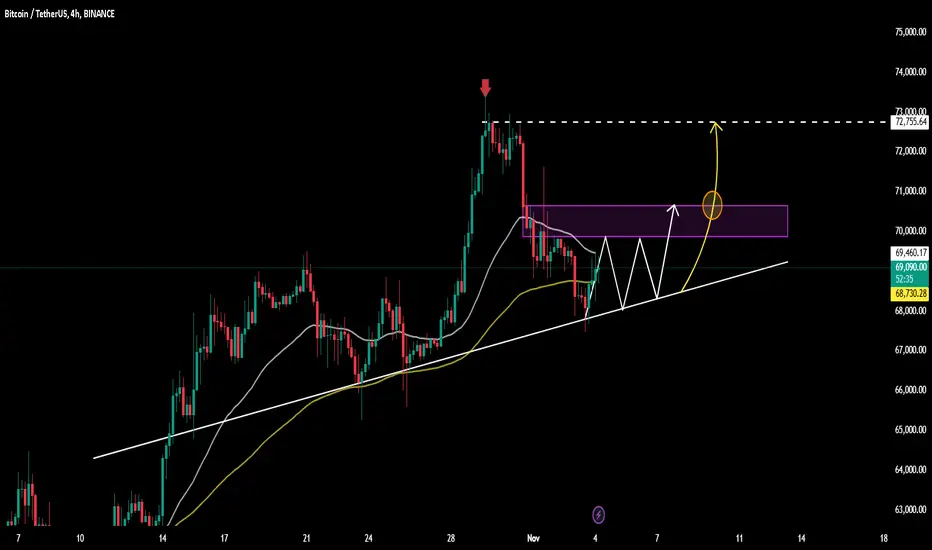
Bitcoin Shows Upward Momentum, Targets Key ResistanceBitcoin (BTCUSDT) is displaying an upward trend, currently trading around $69,078 as it nears critical resistance levels. The chart suggests BTC is consolidating within an ascending channel, with immediate resistance expected around the $70,000 mark. A break above this zone could propel BTC towards the $72,755 target, signaling stronger bullish momentum.
Analysts highlight that maintaining support above $68,730 is crucial for sustaining this upward move. Market sentiment remains cautiously optimistic, with traders closely watching for potential breakout signals in the coming sessions.
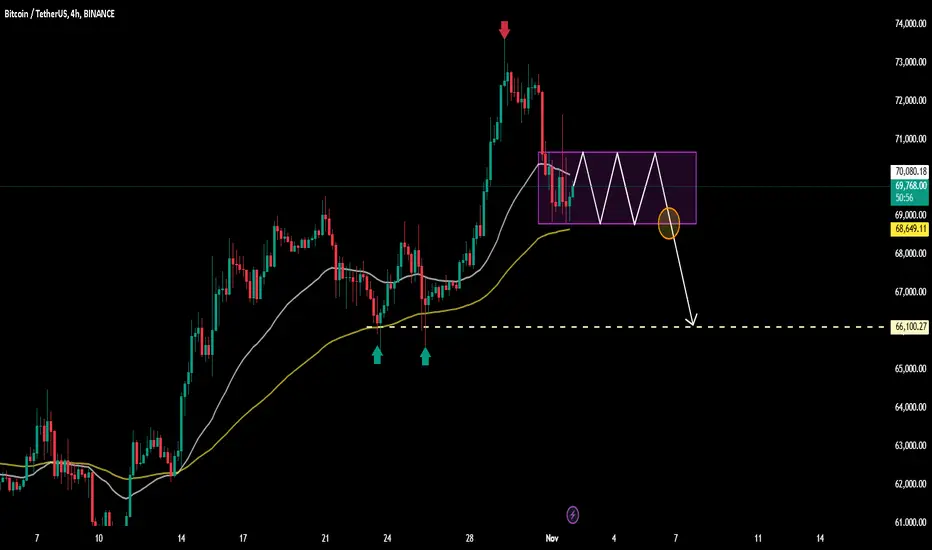
BTCUSDT Bitcoin is currently trading around $69,754 on a 4-hour chart, showing signs of consolidation within a sideways range between approximately $68,649 and $70,080. After a recent rally, the price seems to be stabilizing as it tests its moving averages.
Key Observations:
Consolidation Zone: Bitcoin is moving within a purple box range, suggesting indecision in the market as traders await the next direction.
Moving Average Support: The 50-period (yellow) and 20-period (gray) moving averages provide dynamic support levels. A break below these could indicate increased bearish momentum.
Potential Breakdown: If Bitcoin fails to sustain its position within this range, there’s a likelihood of a downward move targeting the next major support at $66,100.
What will happen to gold prices if Trump wins re-election?Hello everyone,
Today, the global gold price is trading around $2,736 per ounce, down slightly by about 0.22% compared to the previous session.
This decline is due to the stability of the U.S. economy, which makes investors feel less compelled to seek safe-haven assets. Rising government bond yields and a stronger U.S. dollar have also reduced gold's appeal. However, this may only be temporary.
From my research, I believe Trump will win re-election. He holds a fairly aggressive stance on trade and policy. This approach creates tensions, driving investors to seek safe havens like gold—something that previously pushed gold prices higher during his first term.
In summary, while gold prices are currently seeing a slight dip, their future outlook will heavily depend on Trump's policies and the economic shifts during his potential second term. Policy uncertainty could lead to higher demand for gold in the near future.
Euro Declines Slightly - What Direction for Investors?Hello everyone,
Today, the Euro/USD exchange rate is recorded at approximately 1.05 USD for each Euro. On this day, the exchange rate has seen a slight decline of about 0.09% compared to the previous trading session.
The ECB has maintained a tight monetary policy to combat inflation, but I believe the bank may adjust its policy if economic data does not show positive trends. This creates pressure on the Euro. Additionally, recent economic data from the Eurozone indicates a sluggish recovery, particularly in the manufacturing and services sectors. This has diminished investors' confidence in the recovery potential of the European economy.
In the near future, the fluctuations in the Euro exchange rate may depend on new policies from the ECB and the economic developments in Europe. If the USD strengthens, the Euro will face downward pressure in the upcoming period.

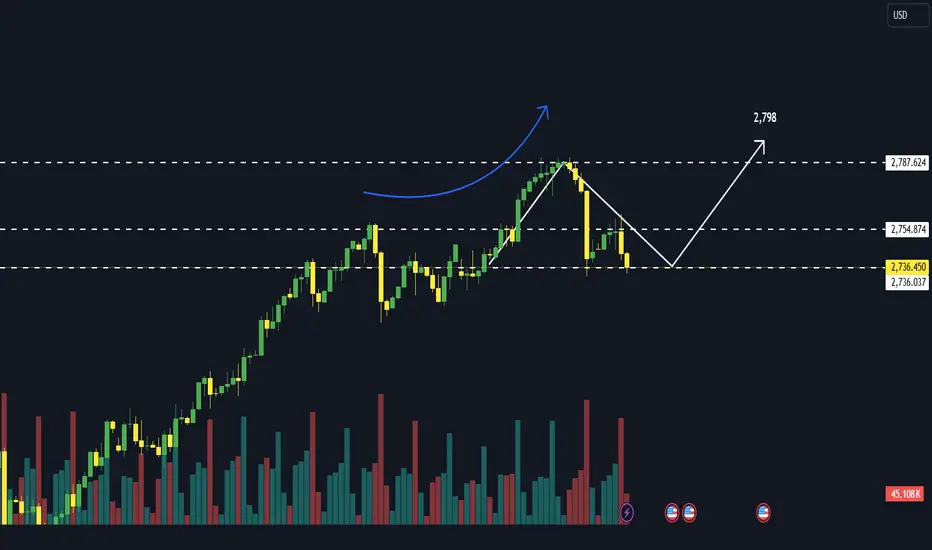
Gold Prices Drop Sharply After Peaking – Will Recovery Return?Hello everyone,
Today, November 1, 2024, the global gold price has unexpectedly reversed sharply from an all-time high and is currently trading around 2,745 USD/ounce.
The main reason for this decline is the release of U.S. economic data indicating signs of stability and recovery. This diminishes the appeal of gold as a safe-haven asset, while U.S. government bond yields rise and the U.S. dollar continues to strengthen.
In the short term, gold prices may remain under pressure if U.S. economic data continues to improve, especially if employment and inflation reports show a positive outlook. However, other risk factors such as geopolitical conflicts or global financial instability could support gold prices. If signs emerge that the Federal Reserve (Fed) will slow the pace of monetary tightening, this could provide momentum for gold prices to rise again.

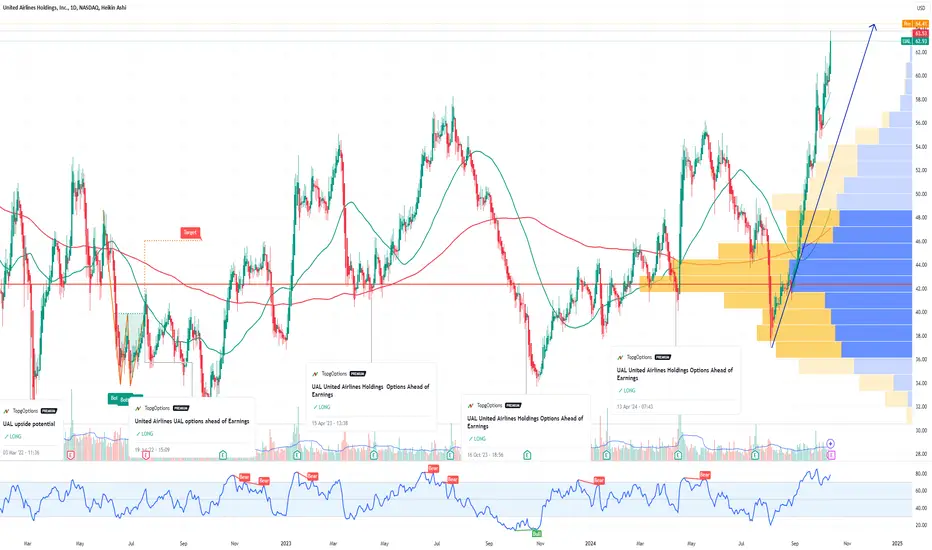
UAL United Airlines Holdings Options Ahead of EarningsIf you haven`t bought UAL before the previous earnings:
Now analyzing the options chain and the chart patterns of UAL United Airlines Holdings prior to the earnings report this week,
I would consider purchasing the 62.5usd strike price Calls with
an expiration date of 2025-1-17,
for a premium of approximately $6.40.
If these options prove to be profitable prior to the earnings release, I would sell at least half of them.
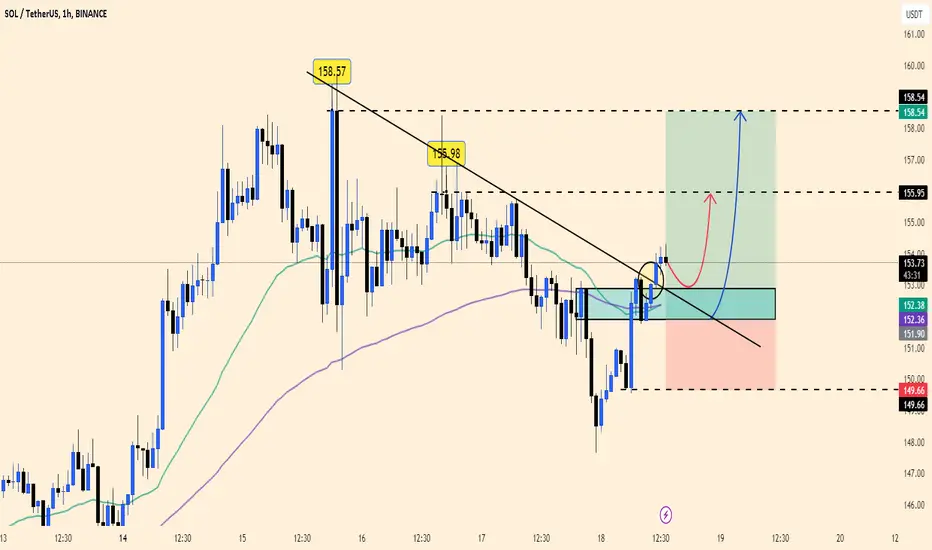
"SOLUSDT Breaks Trendline, Targets $158"Based on the SOLUSDT chart, the price has broken above the descending trendline, signaling a potential bullish move. The price is currently testing the support zone around $152, with possible targets at $155.95 and $158.54.
Buy Strategy:
Entry: Consider buying around $152 - $153.
Take Profit: First target at $155.95, second target at $158.54.
Stop Loss: Below $149.66 to limit downside risk.
News factors such as improving market sentiment towards cryptocurrencies could further support this upward trend. Keep an eye on key economic data and market developments for confirmation.
BTCUSDT: Trading today!BTCUSDT continues its upward momentum in early Friday trading, currently hovering around the $68,100 mark. The long-term trend remains in favor of buyers as the price channel holds strong.
That being said, we could still consider selling ahead of further gains if the price tests the channel's upper limit again.
What’s your take on this? Share your thoughts in the comments below!
Happy trading, everyone!
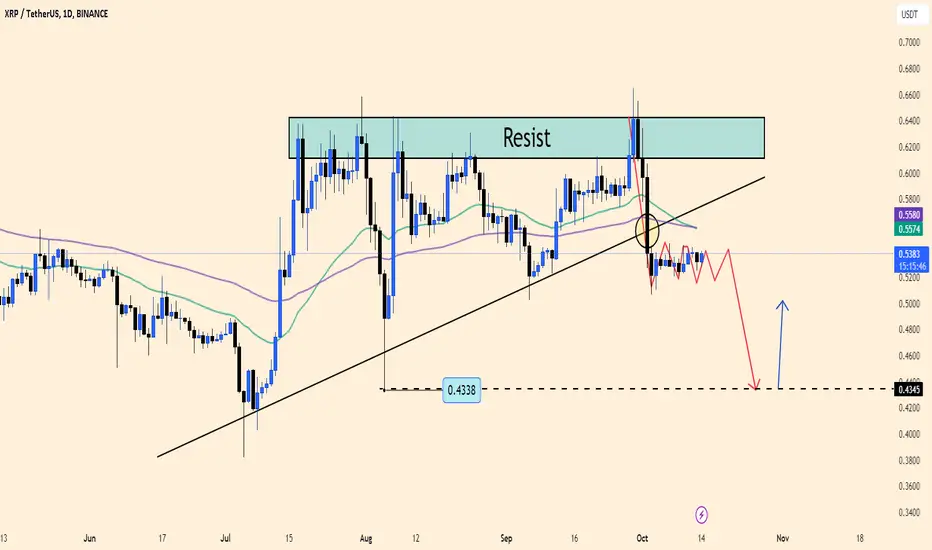
XRPUSDT : SELL ? The chart for XRP/USDT shows that the price recently tested a strong resistance zone around $0.55 to $0.64 but failed to break above it, resulting in a pullback. Currently, the price is trading near $0.5375, hovering just above a key support level.
A breakdown from this level could see the price declining towards the $0.43 zone, as indicated by the downward projection. This would represent a bearish move following the failure to sustain gains above the trendline and resistance zone. Conversely, if the price manages to bounce back from the support region, it could attempt another rally to retest the resistance, but further upside momentum would depend on breaking through this critical level.
Traders should keep an eye on these key zones: $0.4338 as support and $0.5574-$0.5580 as resistance, to gauge potential moves in the near future.
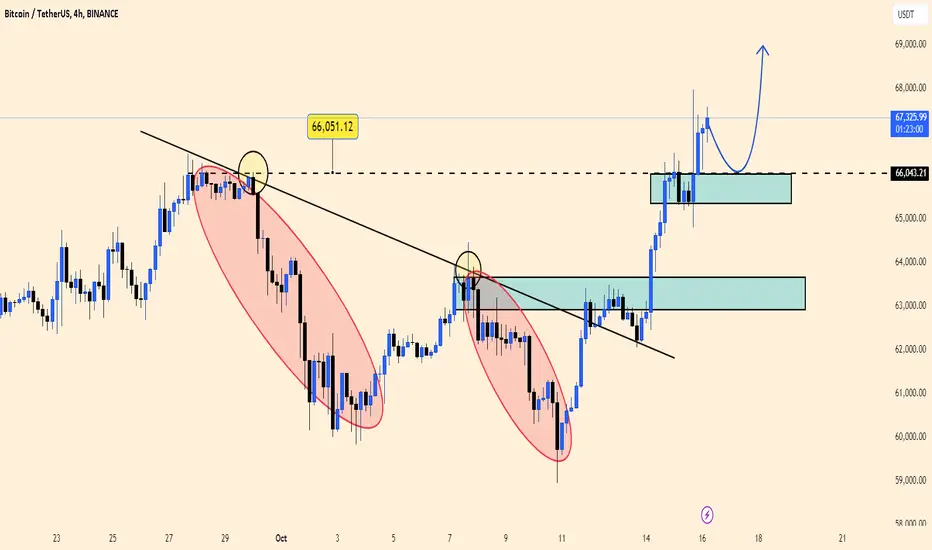
BTCUSDT trading strategy today!BTCUSDT appears to be in a consolidation phase after a recent breakout from a descending trendline that previously acted as resistance. This breakout, happening near the $66,051 level, was followed by a strong upward move, suggesting bullish momentum has strengthened.
Key levels to watch:
Support Zone ($66,000 - $66,500): After breaking out, the price has revisited this zone, and it now acts as a key support. Bulls are expected to defend this level to maintain the uptrend.
Resistance ($67,000 - $68,000): The price has met some resistance around the $67,000 area. However, with the bullish structure intact, there’s potential for another leg higher, with the next target around $68,000 or higher.
The price action shows two previous descending moves marked by ellipses, both of which were rejected around the $66,000 level before breaking out. This area continues to be a battleground, and the bulls are currently holding above it. As long as BTC stays above $66,000, further upside is likely.
Projection: There’s a potential for BTC to retest the support zone before continuing the upward move. A bounce from this zone could see BTC heading towards $68,000 in the short term, as indicated by the curved blue arrow.
Summary: BTC has successfully broken out of the downward trendline, and the current retest of support around $66,000 could be a healthy consolidation before the next upward push. If the bulls can maintain control, we could see BTC continue to climb towards $68,000 and beyond.
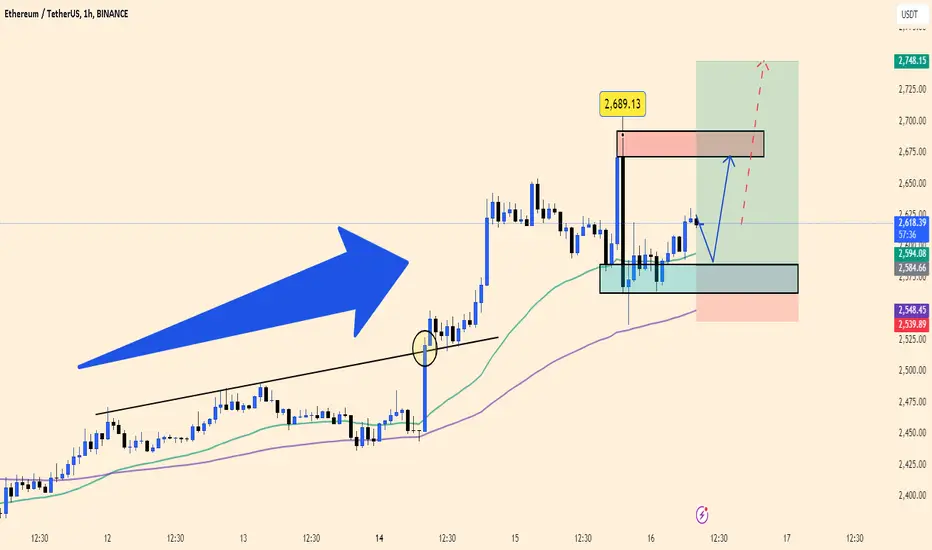
Ethereum Eyes Breakout Above Key Resistance
In this 1-hour ETH/USDT chart, Ethereum shows strong upward momentum, highlighted by the large blue arrow.
Key Points:
Clear Uptrend: Ethereum has been moving in a steady uptrend, reflected in the price action staying above the moving averages. This signals that buyers are still in control, with higher highs and higher lows forming consistently.
Support Area: The green zone, around $2,590 to $2,600, acts as a solid support level. Price may pull back here before finding enough buying interest to push higher again.
Resistance Zone: The red area, between $2,670 and $2,690, is a key resistance where the price has previously struggled to break through. If Ethereum tests this level again, it could be a critical turning point.
Potential Move: The chart hints at a possible dip back to the support zone, followed by a bounce towards resistance. If the price breaks above the $2,690 mark, it could rally further, with a target potentially around $2,748.
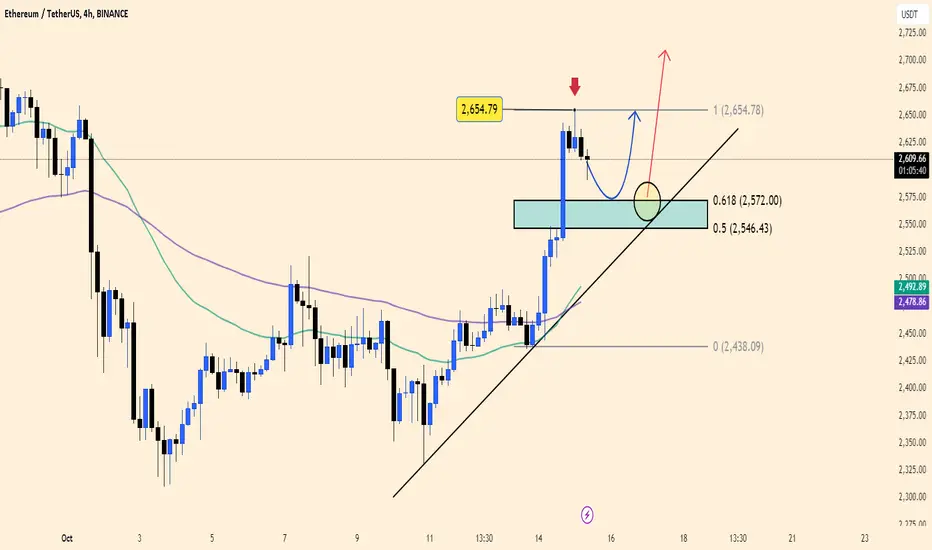
ETHUSDT : Bullish factors in playETH/USDT is currently trading around 2,604.19 USD, following a strong upward movement that encountered resistance near 2,654.79 USD.
In the coming sessions, a pullback towards the support zone between 2,546.43 USD and 2,572.00 USD is highly possible. This area is reinforced by the 0.5 and 0.618 Fibonacci retracement levels, which typically serve as critical support in a continued uptrend. If the price retraces to this zone, it could provide a strategic buying opportunity.
In the short term, I'm expecting some consolidation or a mild retracement before another potential breakout attempt above the 2,654.79 USD level. A successful break would likely push the price towards the next target of 2,725.00 USD, possibly reaching higher levels beyond that.
However, a failure to maintain support at 2,546.43 USD could suggest a deeper correction. Until that happens, the bullish momentum appears intact, and the support zone could serve as a solid foundation for the next rally.
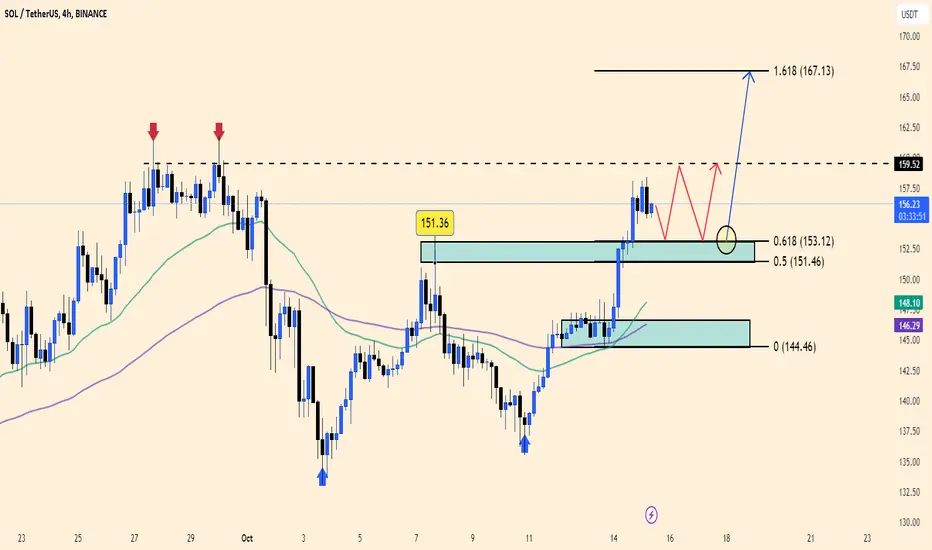
Waiting for a Buy Opportunity at SOL Support ZoneSOL/USDT is currently trading around 156.19 USD, and I’m keeping a close eye on its price action. After a solid bounce from the key support level at 151.46 USD, I expect it might consolidate for a while between the resistance at 159.52 USD and the support around 153.12 USD.
If the price pulls back to the 151.46-153.12 USD zone, I see that as a strong buying opportunity, especially since it lines up with the 0.618 Fibonacci retracement level. This level often acts as a significant support in uptrends.
In the short term, I’m anticipating some sideways movement before we get a potential breakout above 159.52 USD. If that happens, my target would be the next key level at 167.13 USD, which aligns with the 1.618 Fibonacci extension.
While there’s always the possibility of a pullback, the way the price has been moving lately makes me believe that the buyers are still in control. I’ll be watching the support zone closely for any signs of further bullish action.
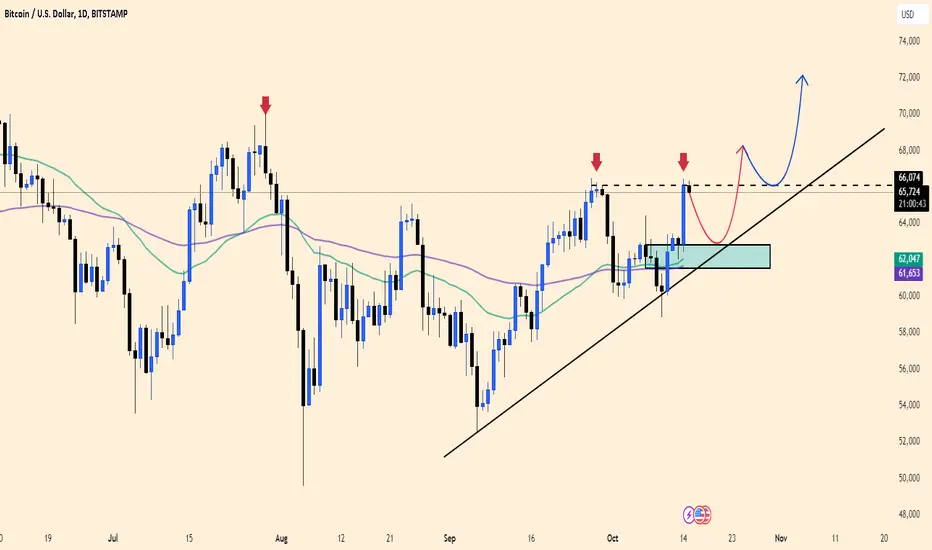
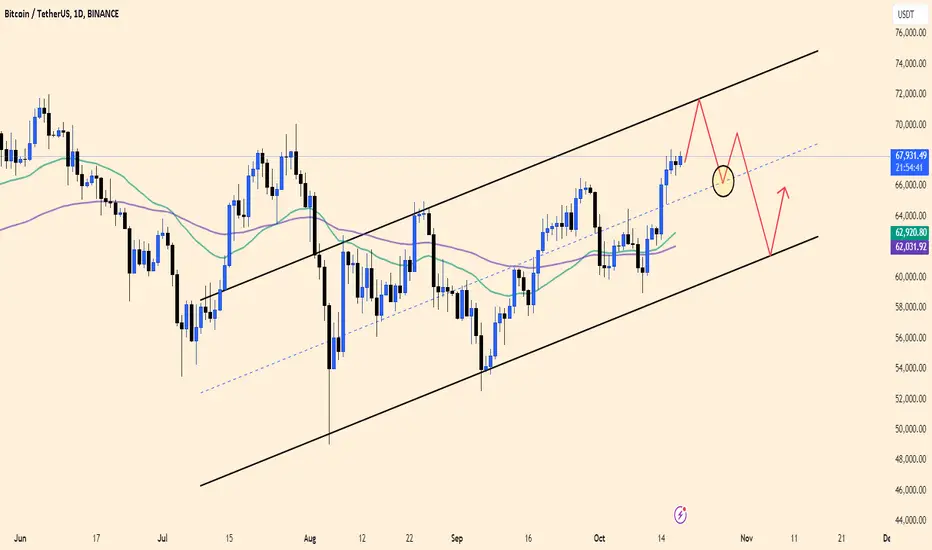
BTCUSD today.Analysis:
Resistance: Bitcoin has tested the $66,000 resistance multiple times, as indicated by the red arrows, but has yet to break through it decisively.
Support: There is a clear support zone around $61,000 – $62,000, which has acted as a base for previous price bounces.
Trend: The ascending trendline suggests that the market sentiment is still bullish, as long as the price stays above this level.
Trading Strategy:
Buy on Dip: If BTC pulls back into the support zone around $61,000 – $62,000 and holds, this provides a buying opportunity.
Target: The first target would be a retest of the $66,000 resistance. If it breaks, the next target could be $70,000.
Stop Loss: Place a stop-loss just below the $60,000 mark to protect against a deeper pullback.