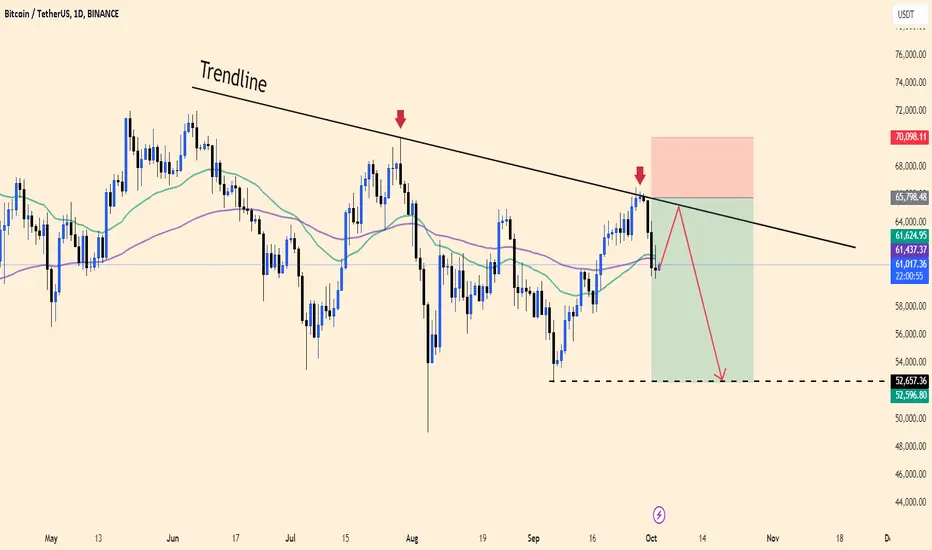
BTCUSDT Trading Strategy Today. Today’s analysis for BTCUSDT shows that the price is currently moving below a key descending trendline, indicating potential bearish pressure. The recent rejection from the trendline (highlighted by the red arrows) suggests that BTCUSDT may head lower, continuing its downward momentum.
The price is trading around $61,000, and if it fails to reclaim the trendline resistance near $61,600, we could see a deeper pullback towards the support zone around $52,600, as marked on the chart.
Strategy:
Sell Strategy: Consider short positions as long as BTCUSDT remains under the trendline resistance. A break below $61,000 could accelerate the decline toward the $52,600 support level.
Stop Loss: Set near $65,800 (above recent highs), and the target would be around $52,600.
This aligns with current market sentiment, where potential bearish trends dominate unless there is a significant reversal back above the trendline.
Sell-buy
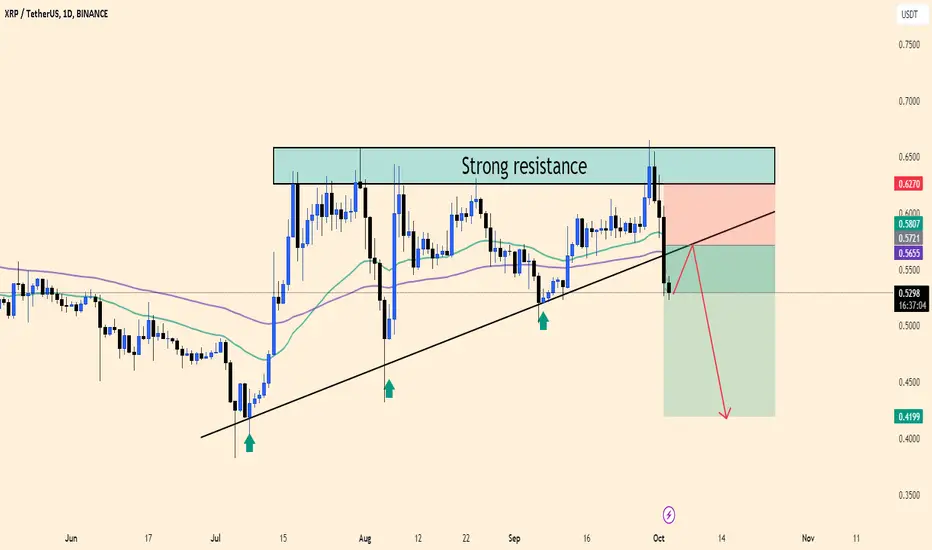
XRP Breakdown Signals Further DeclineLooking at the XRP/USDT chart, we can observe that the price recently faced rejection at a strong resistance zone around $0.6270. The market has since broken below the ascending trendline, indicating a potential shift toward a bearish sentiment.
Key Levels:
Strong Resistance: $0.6270
Current Price: $0.5287
Support Target: $0.4199
Analysis:
After failing to break through the strong resistance, XRP has begun to retreat, crossing below the trendline, which could now act as a resistance. This breakdown suggests that we might see further declines, with the next major support level resting at $0.4199.
Strategy:
Sell Opportunity: Traders could consider shorting the asset at current levels or wait for a potential retest of the broken trendline around $0.5655 - $0.5807.
Stop Loss: Above $0.6270, just beyond the resistance.
Take Profit: The primary target would be the support at $0.4199.
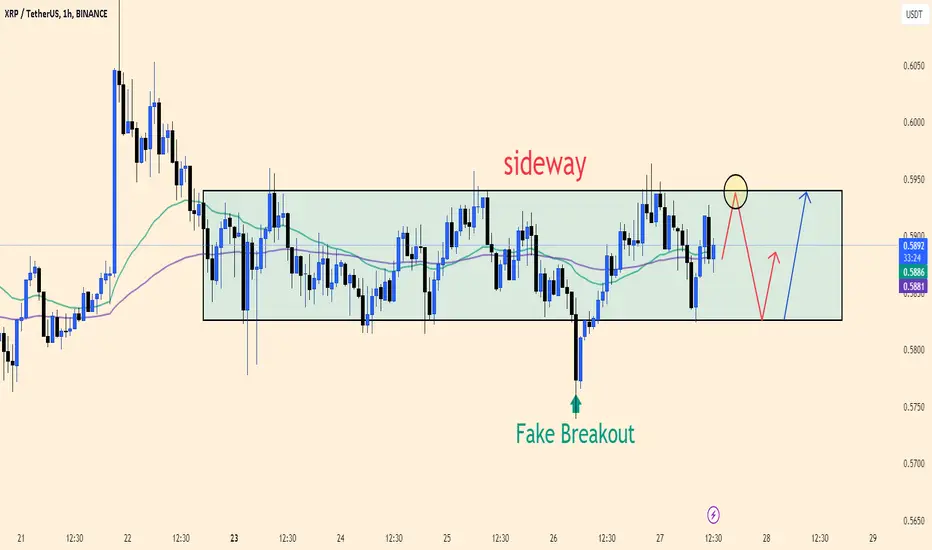
XRPUSDT The XRP/USDT chart is currently in a sideways consolidation pattern between $0.588 and $0.595, indicating a lack of strong directional movement. The price has remained within this range with a notable fake breakout below support, which quickly recovered.
Key Technical Points:
Support Zone: Around $0.588
Resistance Zone: Around $0.595
Fake Breakout: The dip below $0.588 was a false breakdown, indicating the possibility of a range-bound market in the short term.
Strategy:
If Range Holds: Consider trading within the range.
Entry: Long at $0.588 (support) or Short at $0.595 (resistance).
Targets: Aim for a profit-taking strategy of around 0.003-0.005 points from entry.
Stop Loss: Place stops below $0.586 for long positions and above $0.597 for shorts to avoid false breakouts.
Breakout Scenario:
If the price breaks and holds above $0.595, enter a long position targeting $0.600.
Conversely, a sustained drop below $0.588 could signal a short opportunity, targeting the $0.580 region.
This strategy focuses on the current sideways trend, allowing for quick reaction to potential breakout moves.
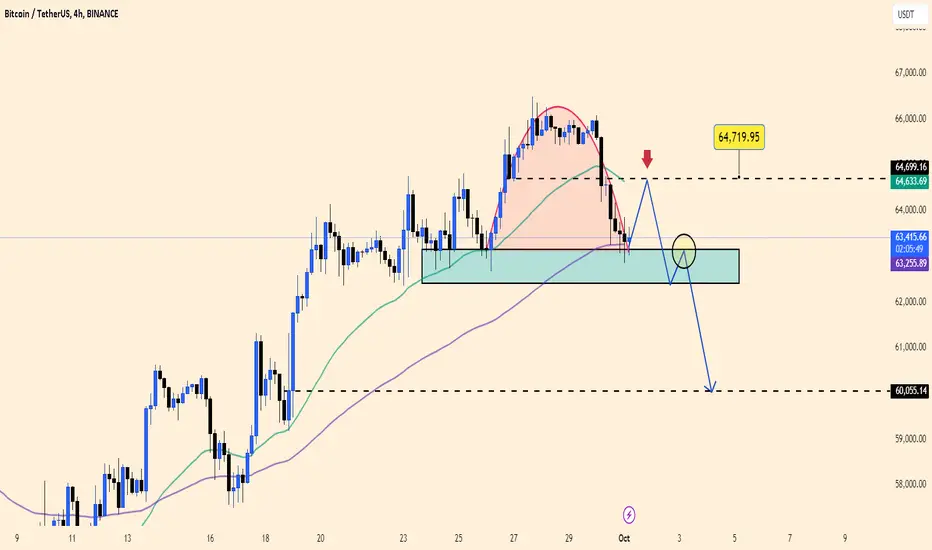
Trading strategy ! The Bitcoin market, particularly BTCUSDT, continues to face downward pressure, even as Fed Chair Powell hints at further rate cuts.
Currently, the price hovers around $63,500, and a cup-and-handle pattern seems to be forming. If this pattern plays out, BTCUSDT may see additional declines. Our short-term strategy remains focused on selling opportunities.
Happy trading, everyone!
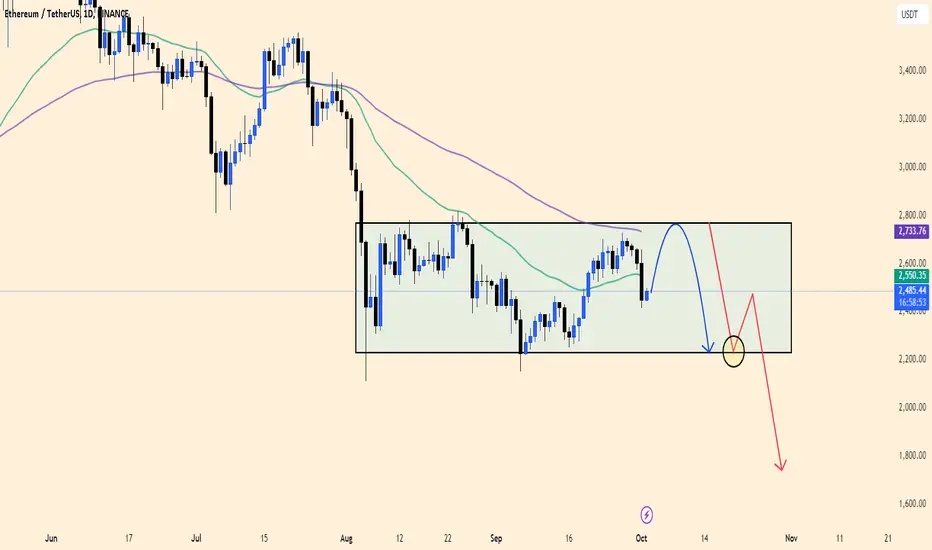
ETHUSDT Faces Key Resistance, Downtrend Ahead?The ETHUSDT chart shows Ethereum currently trading within a sideways channel, with support around 2,400 USDT and resistance near 2,750 USDT. After a slight recovery, ETH seems unable to break through this resistance level and is now turning downwards.
Combined with uncertainty in the cryptocurrency market and macroeconomic factors, ETH is likely to continue fluctuating within this range before possibly breaking the support zone. If the 2,400 USDT level is breached, a strong downtrend could push ETH to lower levels around 2,200 USDT or even further.
Trading strategy: Traders can wait for ETH to reach the resistance zone near 2,700 USDT to enter a sell position, with a target of 2,400 USDT. If the price breaks below this support, continue holding the sell position with a lower target around 2,200 USDT.
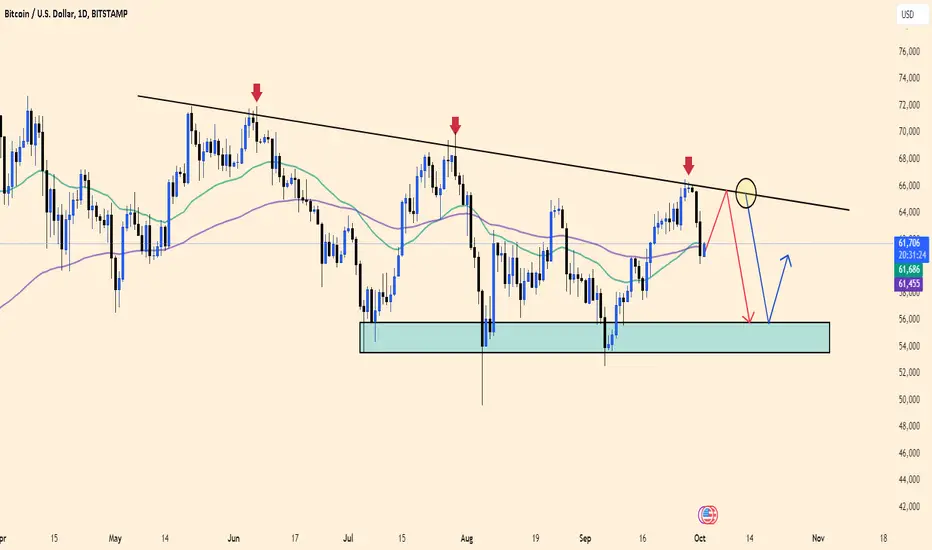
BTCUSD: Buy or Sell ?Hello everyone, let’s dive into today’s analysis of BTCUSD.
Currently, this coin is showing signs of recovery after yesterday’s dip, which aligns perfectly with my earlier prediction.
While there’s potential for a short-term rebound, the technical analysis still points to a bearish outlook for BTCUSD, with the established trendline continuing to hold strong.
As long as this trendline remains intact, sellers are still in a favorable position.
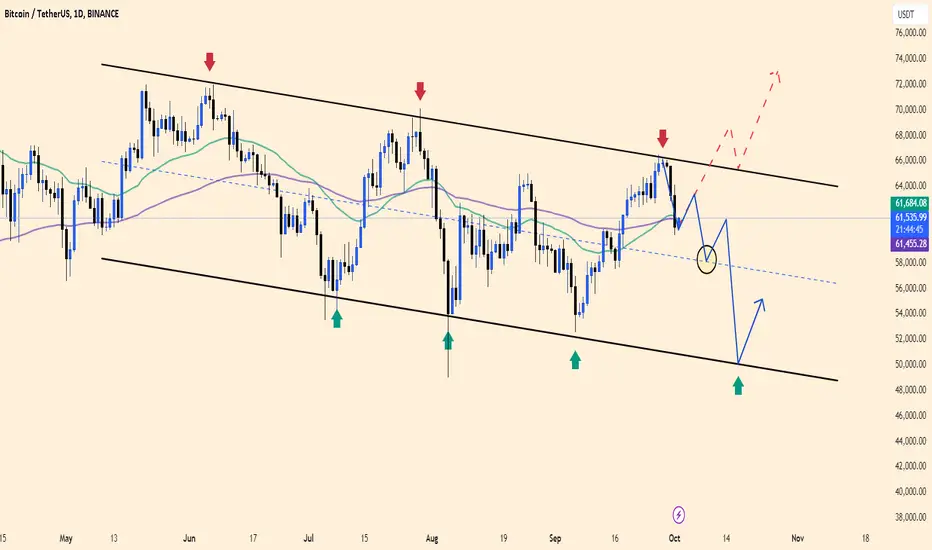
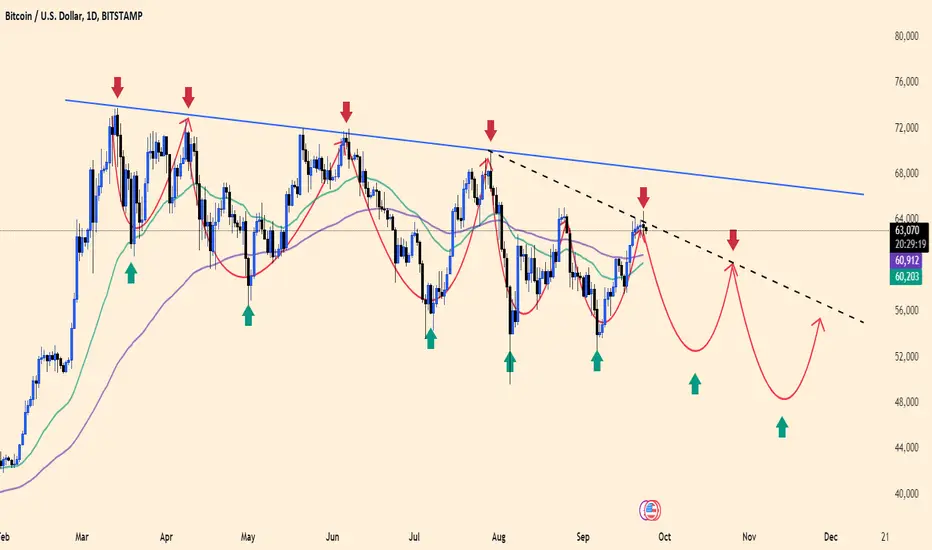
BTCUSDT: Discount in 1D channelThe chart shows that Bitcoin (BTC/USDT) is currently within a clear downward channel. With red arrows marking the highs and green arrows marking the lows, the bearish trend is still dominant. Bitcoin is experiencing a slight recovery after hitting resistance but may likely retest the support level around the $58,000 - $56,000 range. If it breaks below this support zone, there’s potential for a further drop towards $50,000.
Based on current market news, if geopolitical tensions and pressure from global financial policies persist, BTC may continue its short-term downtrend.
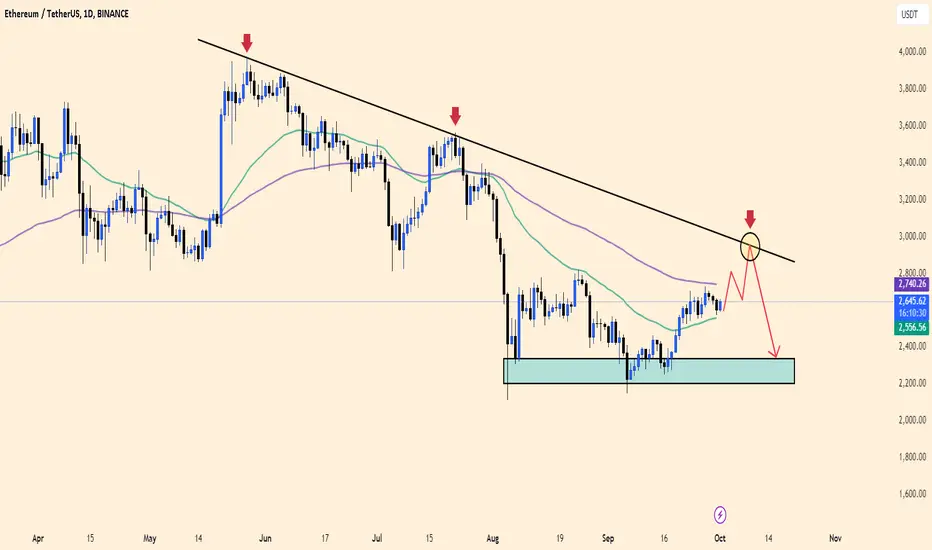
ETHUSDT Near Resistance - Expecting a Downward CorrectionETHUSDT is currently testing a descending trendline, which has acted as resistance in previous instances, as shown by the two prior rejections marked by red arrows. The price is hovering near $2,650, with a potential move towards $2,740 if short-term bullish momentum continues. However, based on the chart pattern and market behavior, there is a high likelihood of rejection near the $2,800 mark, leading to a bearish correction.
The projected scenario suggests that if ETH is rejected from the trendline, it may revisit the support zone around $2,300 - $2,200. The market remains cautious as traders await key macroeconomic data that could influence risk assets, including crypto. This trend aligns with the broader market's volatility and concerns around interest rates and global economic uncertainty.
In summary, ETHUSDT could see a short-term increase before likely encountering strong resistance, prompting a downward move towards the support range. Traders should be alert to price action near the $2,800 level for possible trend reversals.
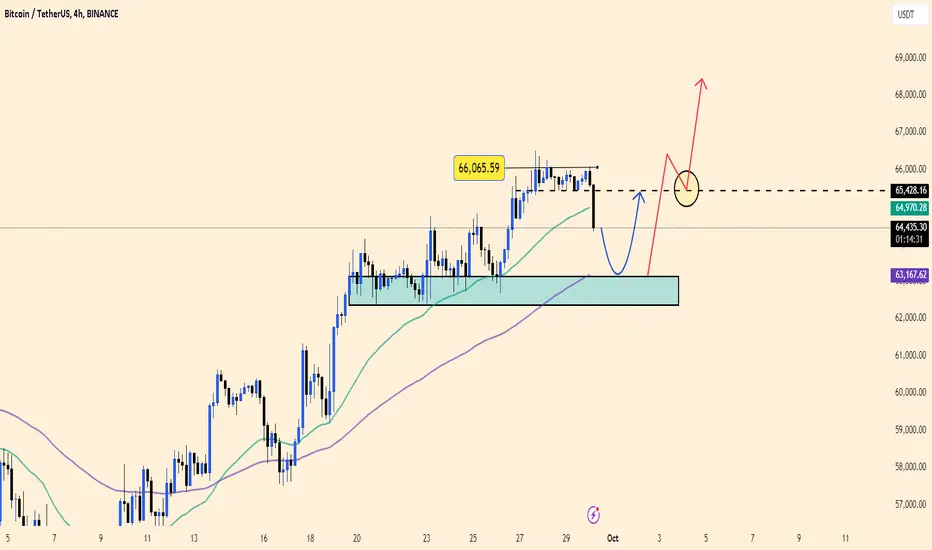
BTCUSDT trading strategy today.Bitcoin is currently priced at 64,444.91 USDT, showing a slight dip of 1.76%. It’s nearing a critical support zone between 63,000 - 64,000 USDT, which has held strong in the past. Moving averages still suggest an overall bullish trend despite the recent pullback.
-Strategy:
Entry: Look for a bounce in the 63,000 - 64,000 USDT support zone. Confirm a reversal before buying.
Take Profit: Target 66,000 USDT first, then 67,000 USDT.
Stop Loss: Set below 62,900 USDT.
If support holds, this could be a good opportunity for a bullish trade. Stay cautious and watch the market closely!
BTCUSD Bullish Trend Confirmed by Double BottomIn the current BTCUSD chart, we can clearly observe a double bottom pattern, a classic bullish reversal formation. After touching a strong support zone around the 61,000 USD level (highlighted in green), Bitcoin's price bounced back and formed a lower peak before returning to the support zone once again to create the second bottom. This indicates strong buying pressure at this price level.
After completing the double bottom pattern, the price broke above the moving averages and continues to rise, currently trading around 65,848 USD. The current trend suggests a potential test of the key resistance zone at 71,511 USD (marked by the dashed line).
Forecast:
If BTCUSD can break through this resistance zone, the price may continue its upward momentum, potentially reaching targets around 74,000 USD and higher.
However, it's important to note the possibility of a short-term correction upon hitting the 71,511 USD resistance zone before continuing the upward trend.

Today's BTCUSDT trading strategy!Hello everyone, let’s continue to analyze trends and strategies together!
Currently, BTCUSDT is hovering around the $65,000 level, gaining momentum after successfully breaking through the resistance at $64,500 in the short term.
From a technical perspective, considering the trendline and the EMA 34, 89 indicators, I believe a buying strategy remains favorable in both the short and medium term. The uptrend could be further reinforced if it manages to break through the $65,300 resistance level soon.
Wishing you all happy trading and abundant profits!
ETHUSDT should buy or sell ?Market Overview:
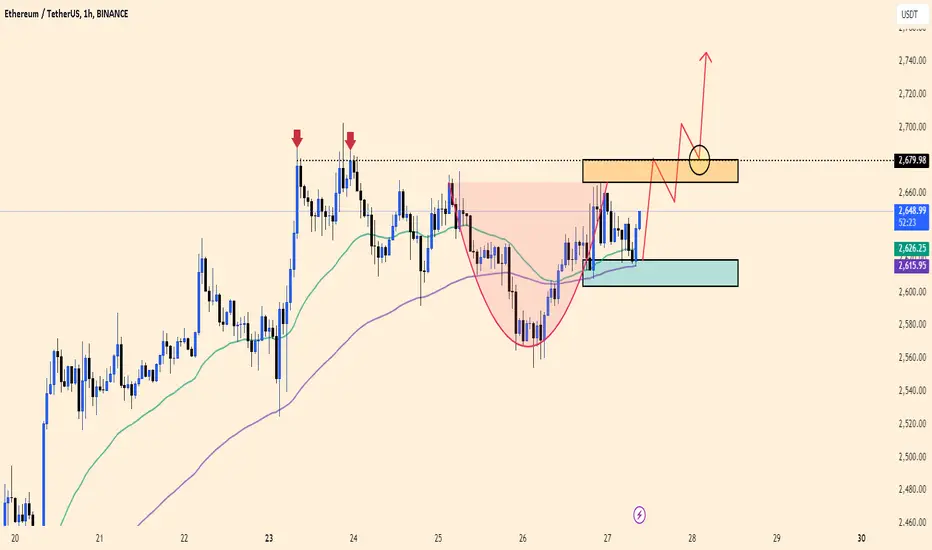
The ETH/USDT pair is showing signs of strength after breaking the resistance level at $2,644. The recent cup-and-handle pattern, highlighted in red, suggests a bullish reversal pattern. The market has tested the resistance zone around $2,679.98 multiple times (as indicated by the red arrows), implying that the market is gradually gaining momentum.
Key Technical Points:
Support Zone: The green zone around $2,615.95 - $2,626.25 represents a key support level, acting as a buffer where buying interest might emerge.
Resistance Zone: The next major resistance sits at $2,679.98, as indicated by the orange rectangle. A break above this level could trigger further upside momentum.
News Catalysts:
U.S. Bond Yields: A decline in U.S. bond yields and a weakening USD could support further upside movement in Ethereum, aligning with the technical picture.
Macro Events: Any easing from the Federal Reserve or signs of slowing inflation might also act as a tailwind for the broader crypto market, potentially boosting Ethereum prices.
Trading Strategy:
Bullish Scenario:
Entry: Consider entering a long position if the price breaks and holds above $2,679.98 (highlighted by the orange zone).
Target: Set a profit target around $2,740, where the next potential resistance could appear.
Stop Loss: Place a stop loss below the green support zone ($2,615.95), ensuring risk management in case of a market reversal.
This strategy hinges on the assumption of continued bullish momentum, reinforced by both technical patterns and favorable macroeconomic conditions.
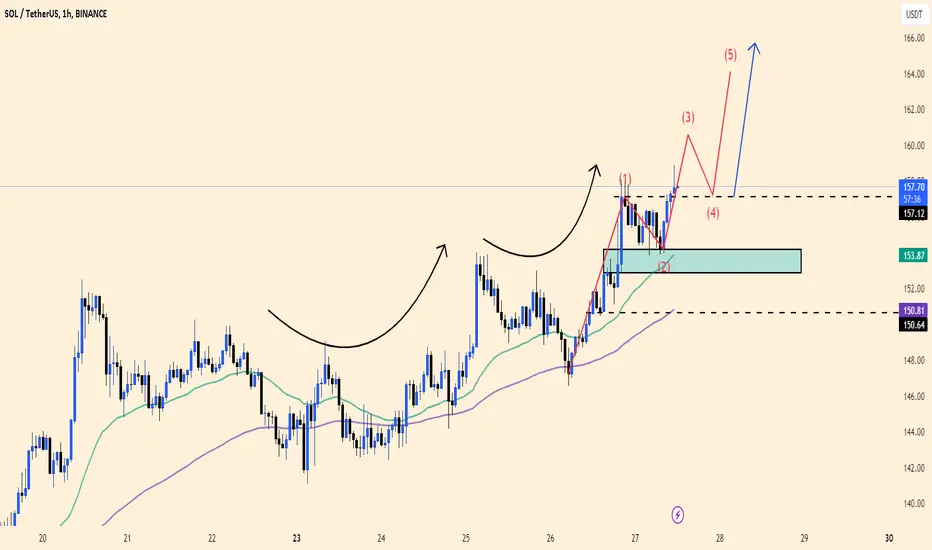
SOLUSDT: Trading strategies and trends!SOL/USDT is showing a clear bullish structure, supported by a potential 5-wave Elliott pattern. After bouncing off the key support zone at $153.65 (Wave 2), it’s likely to continue its upward momentum.
Entry: Consider buying near $153.65.
Target: First target at $160 (Wave 3), with an extension toward $165 (Wave 5).
Stop Loss: Place below $150.64 for risk management.
The uptrend is supported by strong market sentiment and positive Solana ecosystem developments, making further upside probable.
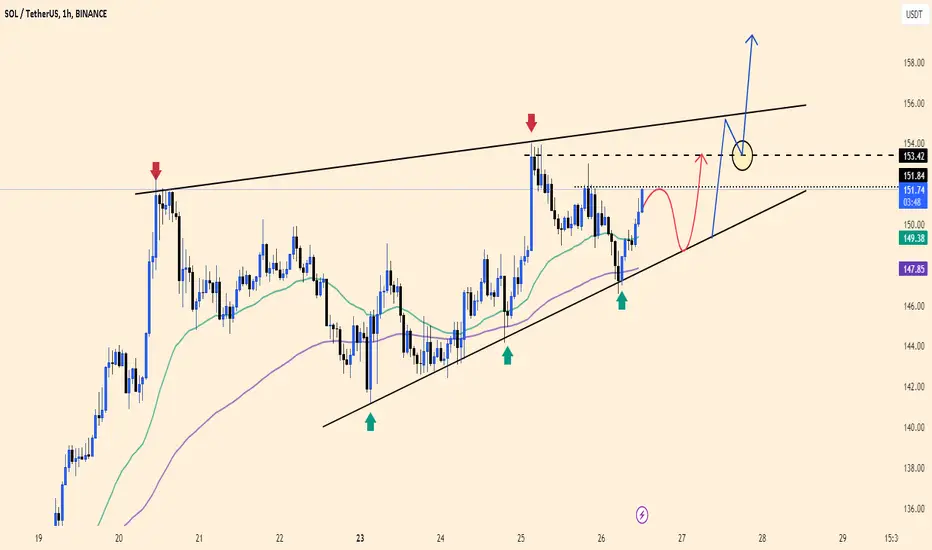
SOLUSDT today The SOLUSDT chart shows a bullish trend within an ascending wedge pattern. The price is currently approaching the resistance zone around 153.42 USD. After hitting this resistance, we might see a short-term pullback before a potential breakout occurs.
Key Insights:
The price has tested the upper resistance twice (red arrows), and a breakout above this level could signal a strong upward move.
The ascending support line (green arrows) indicates that the overall trend remains bullish.
If the price holds above 149–150 USD after a potential pullback, there is a high chance of an upward breakout toward the 158 USD level.
Prediction: If SOLUSDT can break and close above 153.42 USD, expect a bullish continuation toward 158 USD. However, if the price pulls back to retest the ascending support line, this could provide a good buying opportunity before the next upward move.
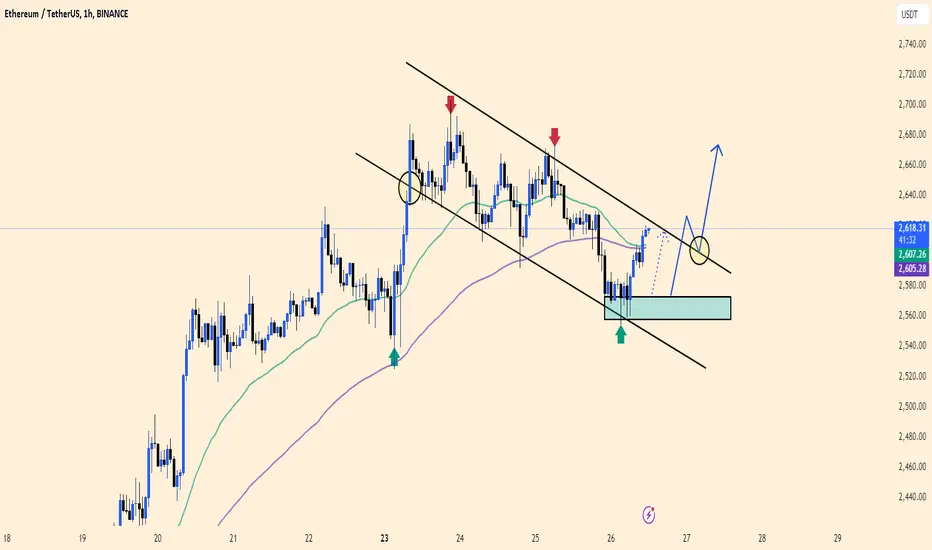
ETHUSDT ETH has experienced a downward move but found strong support around the 2,560–2,580 USD range, as shown in the chart. Despite the recent decline, the price has bounced from this support zone, signaling a potential reversal. The price is currently approaching the upper boundary of the descending channel, and if it breaks out, we could see a bullish continuation.
Fundamental Impact: Recent market conditions and news surrounding Ethereum have remained positive, including increased institutional interest and developments in Ethereum's ecosystem. This could provide bullish momentum, further supporting a breakout.
Prediction: If ETHUSDT breaks above the descending channel near 2,620 USD and holds, we could expect a rally toward 2,660 USD and potentially higher. If the breakout fails, the price may retest the lower support zone. Keep an eye on the 2,620 USD level for confirmation of the uptrend.
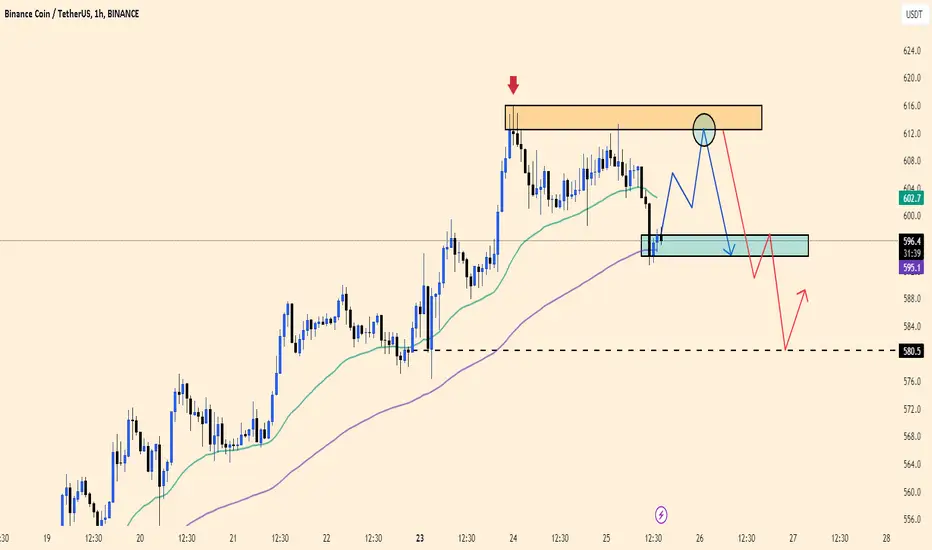
BNBUSDT today Based on the BNBUSDT chart, we observe that BNB has encountered strong resistance in the 610 - 615 USDT zone (marked in orange), where the price reversed after failing to break through. Currently, BNB is trading around 596 USDT and finding support in the 590 - 595 USDT zone (marked in blue).
Technical Analysis:
BNB may experience a short-term recovery from the 590 - 595 USDT support zone, aiming to retest the resistance zone at 610 - 615 USDT. If BNB fails to break through this resistance, the price is likely to continue its downward correction.
A more bearish scenario could unfold if BNB breaks below the current support zone, potentially leading to a sharp drop towards the 580 USDT level, which serves as the next key support.
Conclusion:
In the short term, if BNB holds above the 590 - 595 USDT support zone, the price may recover and retest the 610 - 615 USDT resistance level.
However, if the price breaks below the current support, a significant drop towards the 580 USDT level may occur.
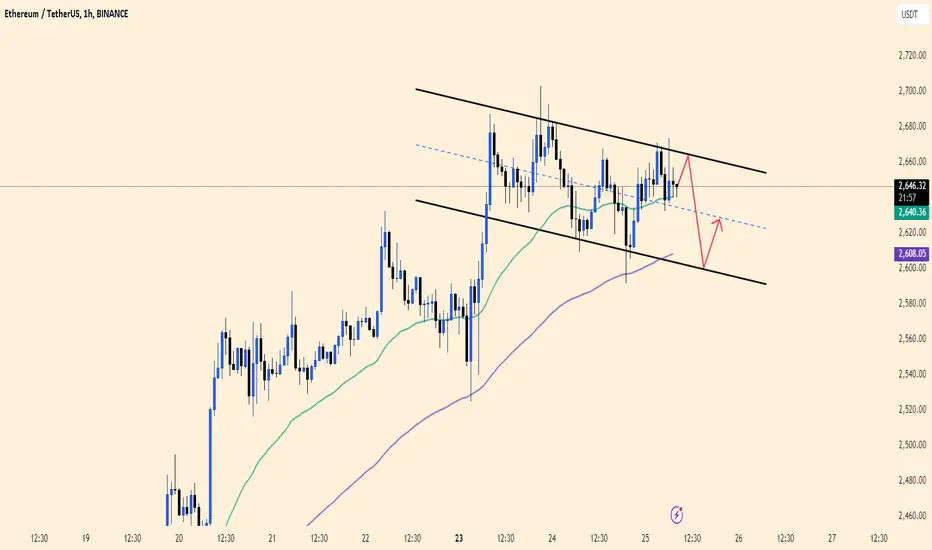
ETHUSDT : Downward correction in price channel . Based on the provided ETHUSDT chart, ETH is trading within a descending price channel, with strong resistance at the upper trendline. The price is currently hovering around 2,643 USDT and has failed to break through the upper resistance, indicating that buying pressure is insufficient to push prices higher.
Technical Analysis:
ETH has attempted to test the upper resistance of the channel but has been unsuccessful, increasing the likelihood of a short-term decline.
The 34 and 89 EMA lines are providing dynamic support for ETH, particularly around the 2,608 USDT level, which serves as a crucial support zone to watch.
If the price breaks below the lower trendline of the descending channel, a deeper drop towards lower levels around 2,580 USDT or further could be expected.
Conversely, if ETH manages to recover and break the upper resistance of the channel, the price could rise toward the higher levels around 2,680 - 2,700 USDT.
Prediction: In the short term, ETH is likely to continue its downward movement, testing lower support levels near 2,608 USDT before potentially experiencing a minor rebound.
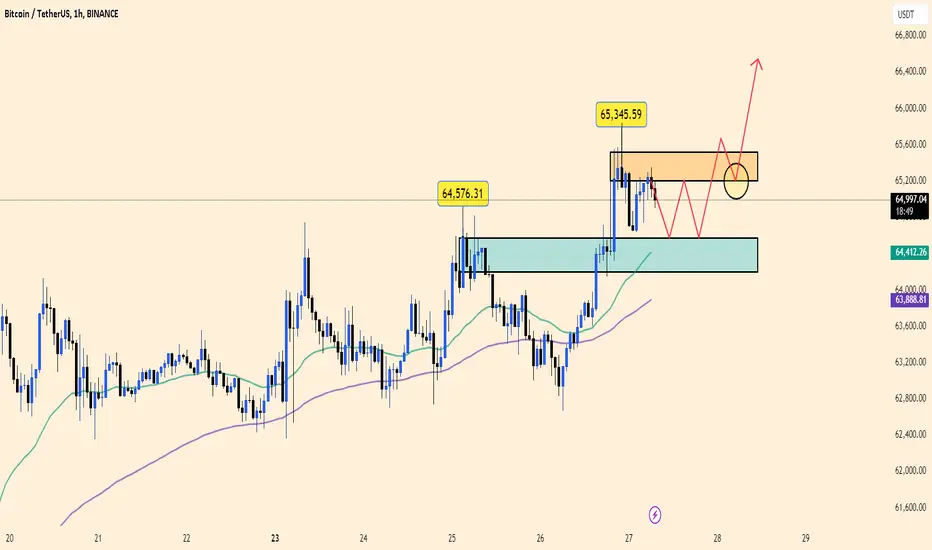
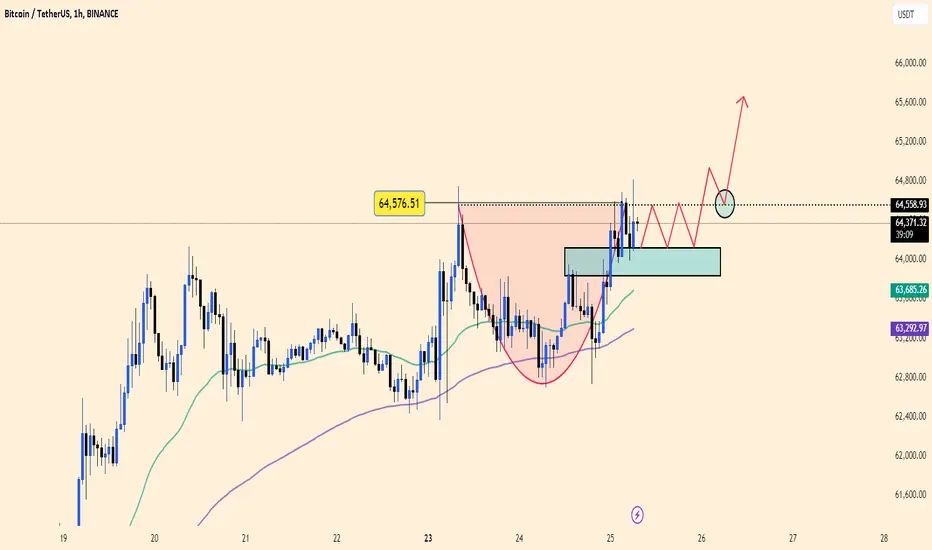
BTCUSDT: Trend and Trading StrategyBitcoin (BTC) is maintaining its upward momentum due to economic factors and market news. A weaker USD and falling U.S. bond yields are making Bitcoin more attractive to investors.
Key factors influencing BTC:
Weaker USD: A declining USD value makes Bitcoin more appealing for investors using other currencies.
Lower bond yields: Low-interest rates push investors towards assets like Bitcoin.
Regulatory news: Expectations of Bitcoin ETFs boost institutional investor interest.
Global economic uncertainty: Geopolitical tensions and recession fears drive demand for safe-haven assets like Bitcoin.
Technical analysis:
Support: $64,200 - $64,300
Resistance: $64,576.51
If Bitcoin holds above the support range, it could break through resistance and rise towards $65,200.
Trading strategy:
Wait for a breakout above $64,576.51 and enter long with a target of $65,200.
Buy near support at $64,200 - $64,300 and sell around $64,500 - $64,600.
Stop loss: Set a stop loss below $64,300 to manage risk.
Bitcoin has strong potential to break higher as the market continues to favor upward momentum.
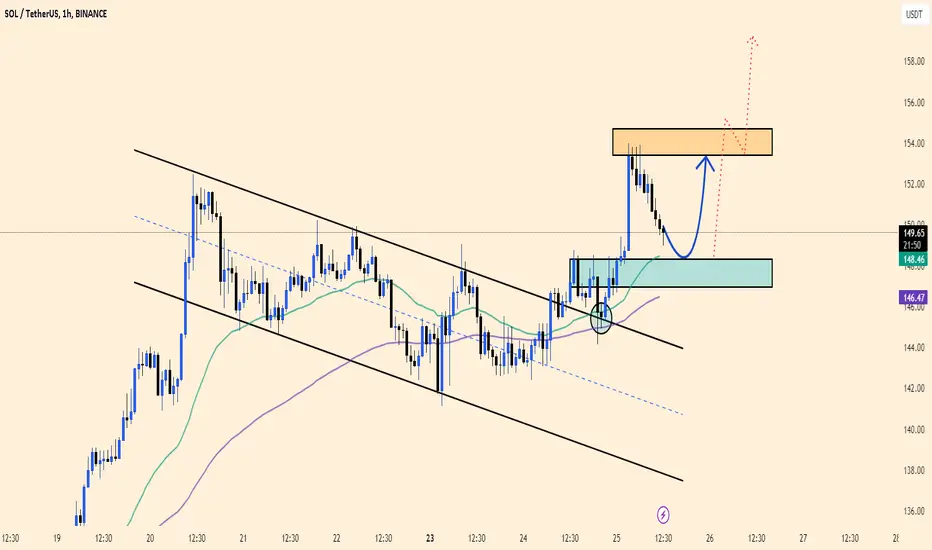
SOLUSDT Based on the current SOLUSDT chart, Solana has broken out of a descending channel and is attempting to continue its upward momentum. Here are the key highlights from the technical analysis and market impact:
Breakout from the Descending Channel:
Solana has broken through the upper resistance of the descending price channel. This indicates strong bullish momentum, and SOL is now targeting higher price levels.
Key Support and Resistance Levels:
The support zone is around 146 - 148 USDT (highlighted in green). This area may provide a foundation for further upward movement if the price pulls back slightly.
The major resistance is at 152 - 154 USDT (highlighted in orange). If SOL breaks this resistance, it could push higher with a clear bullish trend.
Short-Term Expectations:
SOLUSDT is likely to experience a slight correction towards the support level around 148 USDT before finding new buying pressure and attempting to test the resistance zone at 152 - 154 USDT.
A successful breakout above the resistance could lead to a significant upward move, with higher targets becoming viable.
Forecast: In the short term, SOLUSDT is expected to retrace slightly towards the 148 USDT area before bouncing back to test the key resistance at 152 - 154 USDT. The weakness of the US dollar and positive sentiment in the cryptocurrency market could fuel further growth for SOLUSDT.
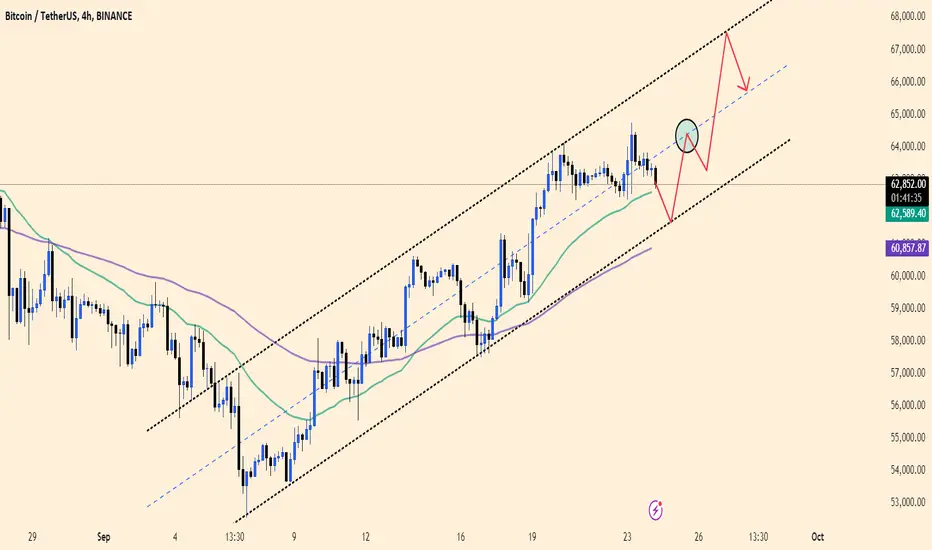
BTCUSDT Trading Strategy!BTCUSDT is undergoing its third consecutive day of price correction, currently trading around $62,800.
Despite the dip, BTCUSDT remains within a parallel ascending channel. If the lower limit holds, this could be a great opportunity to buy as the price touches that support level.
Happy trading, everyone! Don’t forget to like and leave a comment on this post
BTCUSDT : The trend of reduction . Hello, warriors! Do you think BTCUSDT will continue to drop, or are we about to see a rebound?
Currently, BTCUSDT is hovering around $63,122, and based on the 1D chart, the downtrend shows no signs of stopping, with repeated wave patterns.
Given the current economic situation and chart data, I believe the selling strategy remains the right move. What about you? What’s your prediction? Share your thoughts!
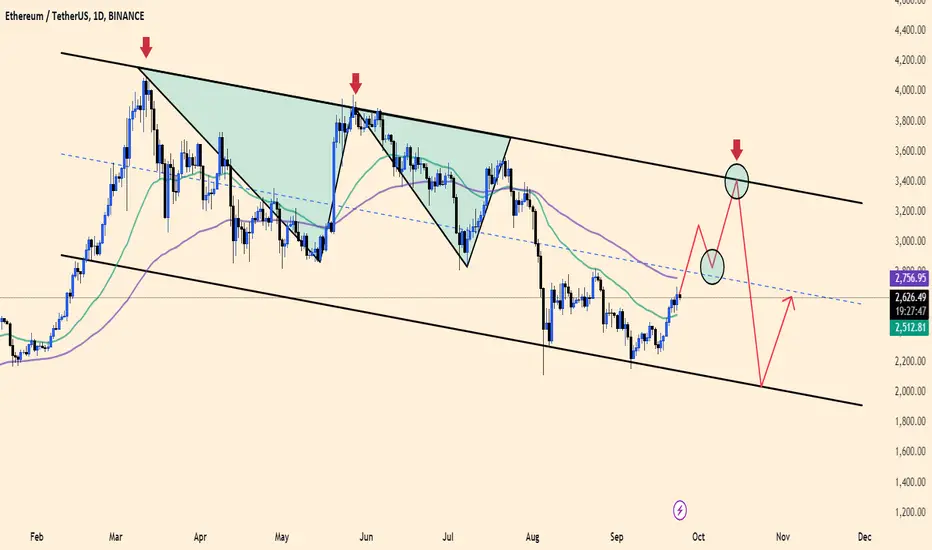
ETHUSDT : Pricing momentum lasts"ETHUSDT is currently on a prolonged downtrend, confined within a descending price channel. My strategy continues to prioritize selling in the long term, although ETHUSDT may experience some upward corrections along the way.
If the upper boundary of the price channel remains intact, it could be a good opportunity to consider selling this coin based on the targets and strategy outlined on the chart.
What about you? Do you think ETHUSDT has the potential to break out of this channel and reverse its trend?
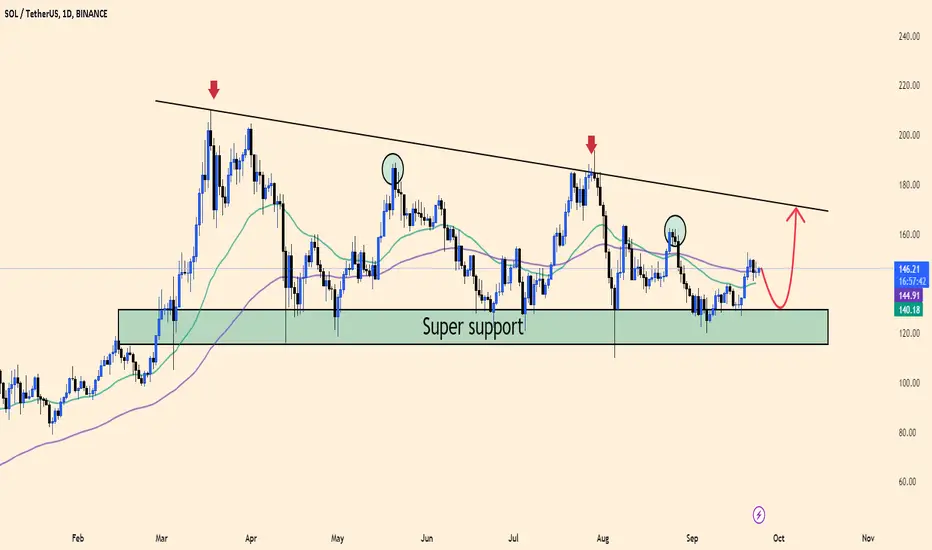
SOLUSDT: Increase while the price is still decreasing?Currently, SOLUSDT is trading within a descending channel, with significant selling pressure keeping it in check. From the chart, we can clearly see the strong support zone (super support) between $120-$130, which has been a key level where SOLUSDT has bounced multiple times in the past.
At this point, it’s likely that SOLUSDT may continue to correct and test this support zone again before making a stronger move upward. The resistance around $180 has yet to be broken, indicating that the longer-term downtrend remains intact. If SOLUSDT fails to break the descending channel, we could see further downside movement towards the support zone before a potential rally.
Forecast: SOLUSDT is likely to experience a slight pullback towards the support zone before possibly gaining momentum for a bullish rebound.
Market sentiment and macroeconomic news will continue to influence this trend, especially as the cryptocurrency market faces ongoing volatility. Stay alert for any developments that might shake up the charts!