Gold Trading Strategy XAUUSD August 14, 2025Gold Trading Strategy XAUUSD August 14, 2025:
Gold prices continued to rise in the European session on August 13, 2025 as mild US inflation data raised expectations of a Federal Reserve rate cut in September, while a weaker US dollar also boosted demand for gold.
Fundamental news: The US labor market report earlier this month initially weighed on the greenback, but the latest US CPI data added pressure as it did not show a clear acceleration in inflation due to tariffs in July. The inflation data reinforced the possibility that the Fed will take a more dovish stance in September, which is what the market is expecting.
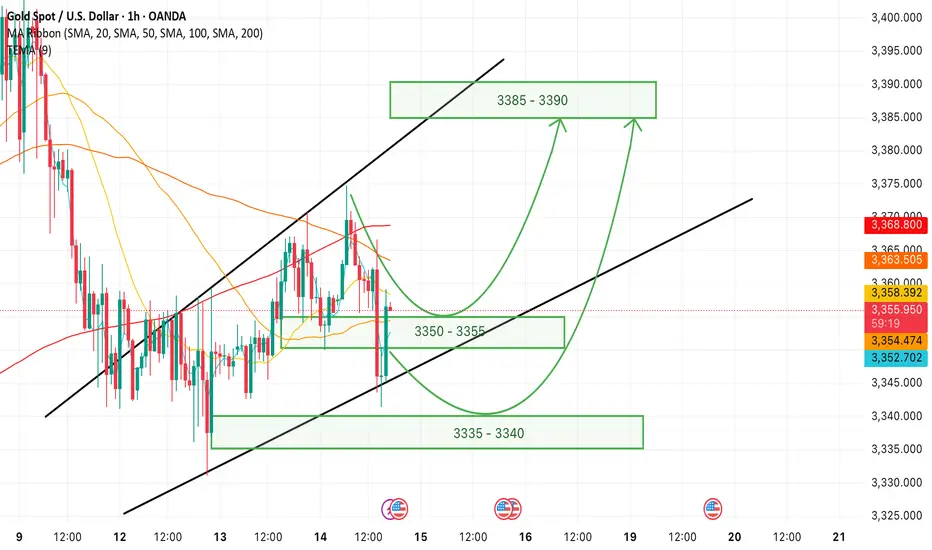
Technical analysis: After a deep correction to the 3330 area, gold prices showed signs of increasing again. On the H1 frame, an upward price channel has been formed, but the current MA lines are still moving sideways, not showing a clear trend. The 3350 - 3355 area will be the important area to decide whether this uptrend channel can hold or not. RSI on H1 and H4 timeframes has entered the buy zone, this is a very good condition for us to trade. We will trade at the support zones and large liquidity zones of gold prices.
Important price zones today: 3350 - 3355, 3335 - 3340.
Today's trading trend: BUY.
Recommended orders:
Plan 1: BUY XAUUSD zone 3350 - 3352
SL 3347
TP 3355 - 3365 - 3375 - 3390.
Plan 2: BUY XAUUSD zone 3335 - 3337
SL 3332
TP 3340 - 3350 - 3370 - 3390.
Plan 3: SELL XAUUSD zone 3388 - 3390
SL 3393
TP 3385 - 3375 - 3365 - 3355 (small volume).
Wish you a safe, successful and profitable trading day.🥰🥰🥰🥰🥰
SELL-GOLD
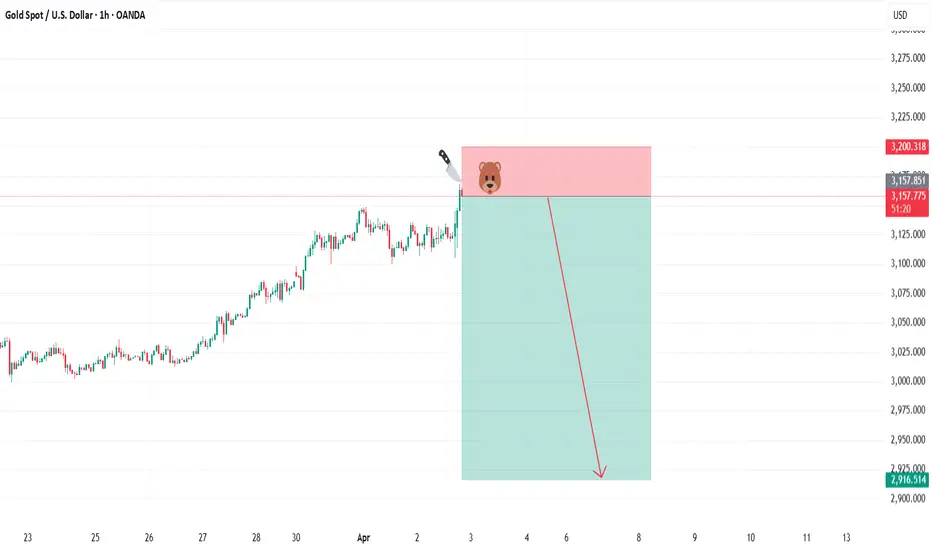
SELL GOLDIn todays session we are looking for selling opportunity in this most waited for pair GOLD. It has been extremely bullish. Our entries are at 3160 stops above 3200 and targets as low as 2916. Use proper risk management and wait for confluence.
BEARS INCOMING
XAUUSD H4 Analysis - Bullish or BearishPair Name = Gold
Timeframe = H4
Analysis = technical + fundamentals
Please see the Above chart To see The Gold Next Moves.
We are currently in new Price Ranges. But we are also using our previous analysis and data to Follow the exact Path.
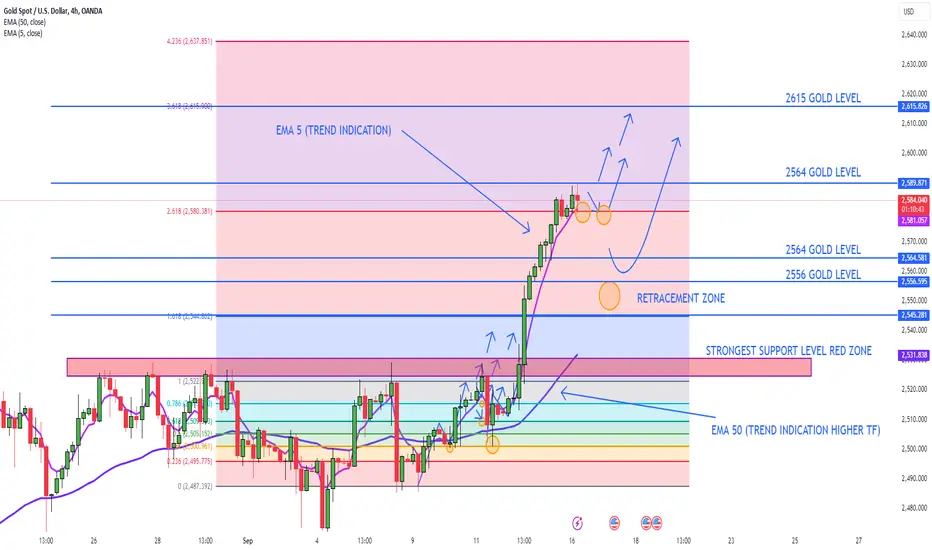
Currently We Can see between two strong support and Resistance levels. As we can see at chart 2590 Gold Price level and 2663 Gold Price level.
EMA 5 is indicating the trend of the market. EMA Cross over can range between 2577 to 2580. That indicates if Price breaks this level. Then we will see a small retesting period.
This kind market allow us to buy the dip and cash another next trend move.
Strongest retesting zone exists between the price level 2545 to 2556 price level.
EMA 5 Crossing levels:-
2580 To 2577
Retracement Zone:-
2545 To 2555
Bullish Gold Levels:-
2590
2615
Bearish Gold Levels:-
2564
2556
2545
2530
Stay tune we Will update again when market will give up another good direction move. With Different different time frame we check the market to get the Accuracte analysis according market next move.Happy trading.
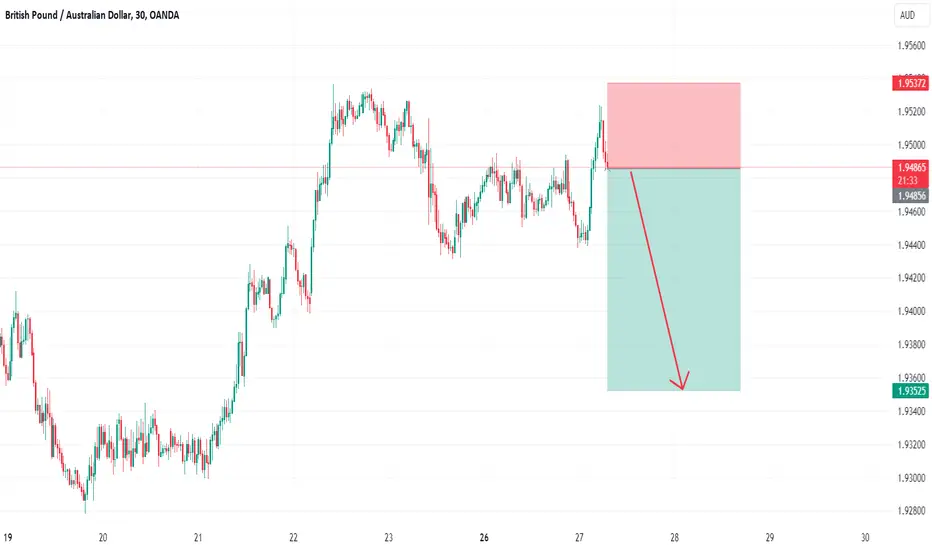
SELL GBPAUDIn todays session we are monitoring GBPAUD for sells. Our first entry is at 1.94866 current price, our targets are 1.93525 and stops above 1.95372. Use proper risk management.
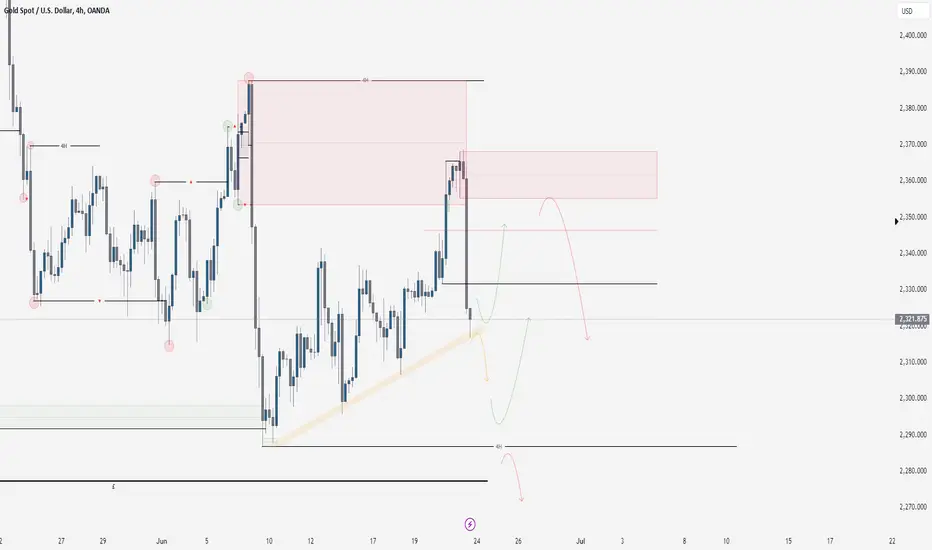
XAUUSD 23/6/24Gold this week has a similar outlook to last week. We have an extreme POI (Point of Interest) within the market, a higher time frame order block, and a fair amount of liquidity below the structural lows established last week during our pullback.
If you are up to date with last week's markup that we posted on TradingView, you would see that it has played out almost perfectly as expected. Following this, if we pull higher into the area of supply before dropping, we would expect a longer-term sell move. Conversely, if we sell off sooner, we will expect a bullish move later in the week.
If this fails, we expect the 4-hour low to be closed out completely and the price to move bearish. The main points to focus on this week are selling away from the area of supply and capturing the liquidity that sits below the lows.
Trade safe stick to your rules!
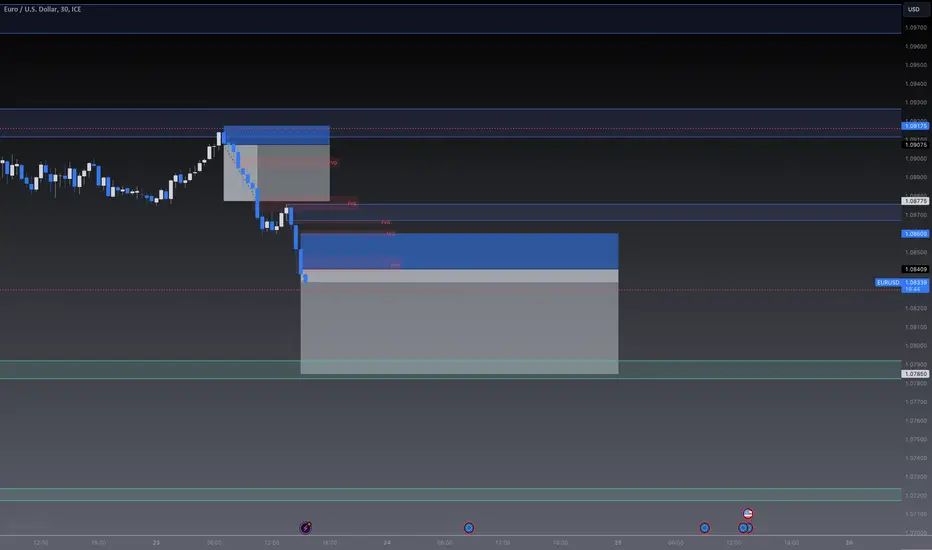
EURUSD Round 2Selling EURUSD again in NY session.
We have seen the big push down through out today, targeting the 4Hr OB around 1.07850
I think EU will continue to fall, we also have PMI tomorrow which might push price even further
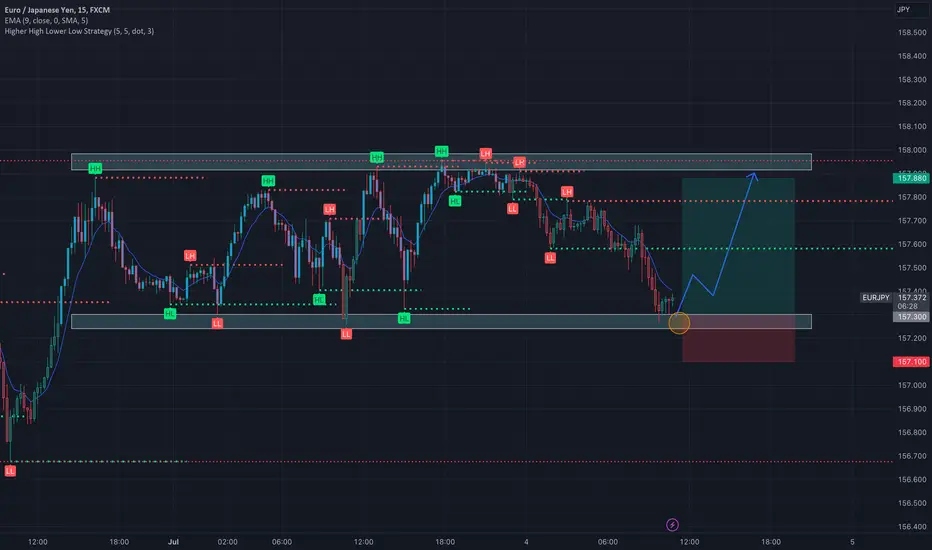
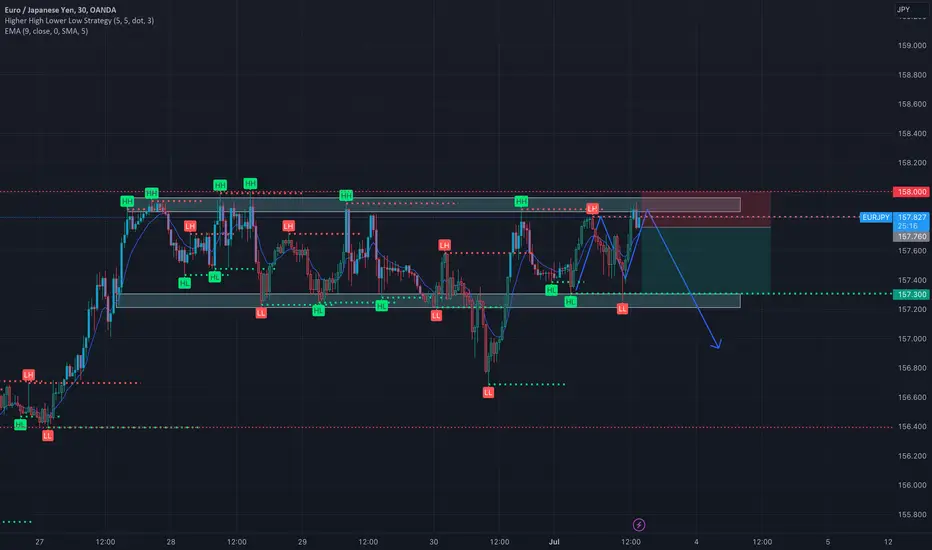
EJ TradesSupport forming on 15m chart, with the Yen weakening, theres little prevention against depreciation.
Id expect the EUR to rise against the Yen, I am placing a buy order at the bottom of support targeting the rejection to resistance.
We have sen over recent month's the dollar slowly eating away at the Yen, from this im predicting the EUR will follow.
EURJPY ShortSelling EJ, Looks like a rejection of that strong resistance level ive mapped on my chart. With the Yen weakening, Im looking to short.
News today 2:45 PMI and 3:00 PMI to watch.
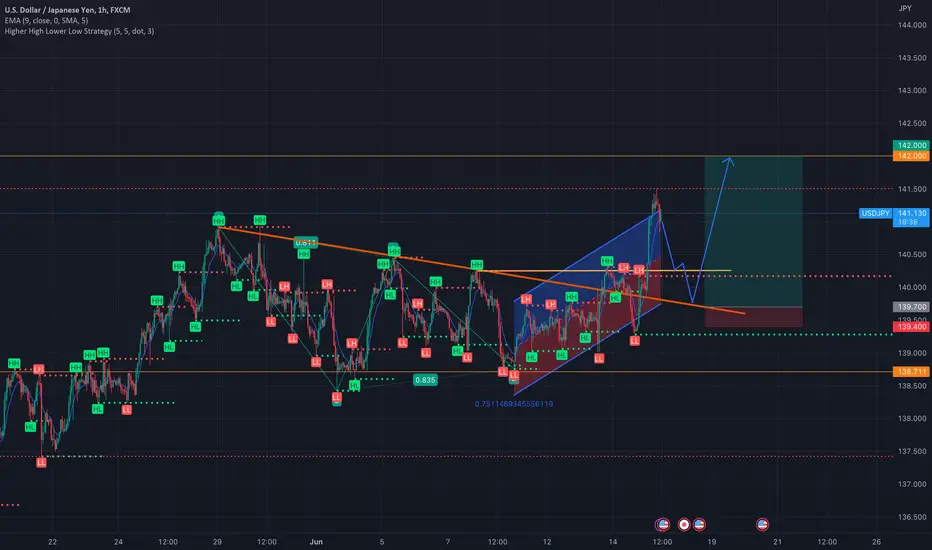
USDJPY Will Go Higher?Resistance broke at 140.880, Im watching news also as we have had recent strength in the Dollar, this could push UJ to break the next resistance zone around 141.4. Patience waiting for the right entry.
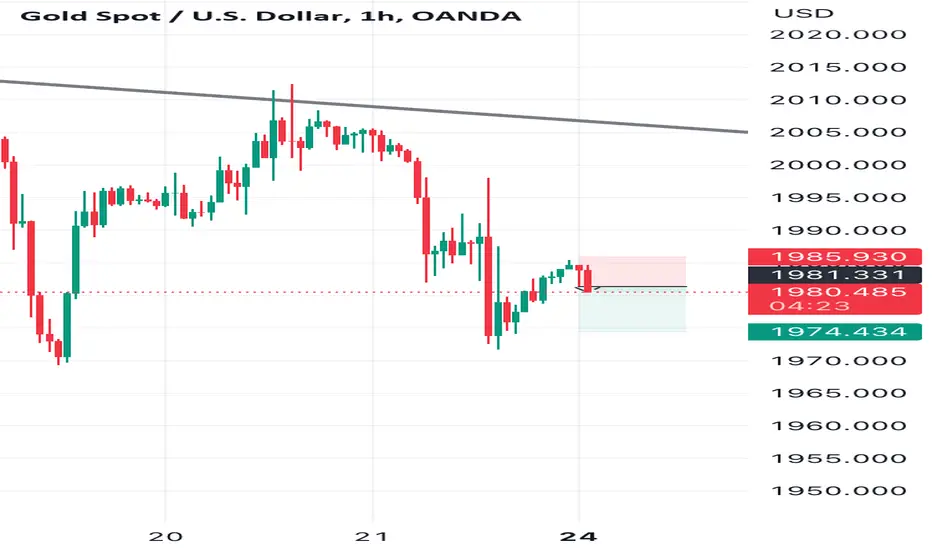
Xauusd sellReversal candle pattern playing out. Last resistance is 1974. Price can make a triple tap so I’m doing a 1:15 which happens to be at the support.
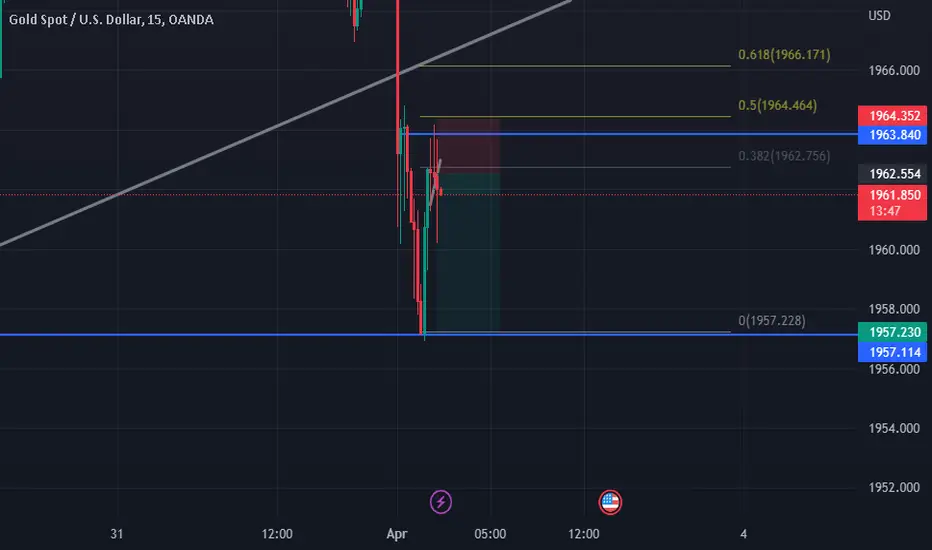
Gold Sell!price went up and made a triple top at 164. lower tf shows head and shoulders and it just retested the neckline of the head and shoulders sell now!
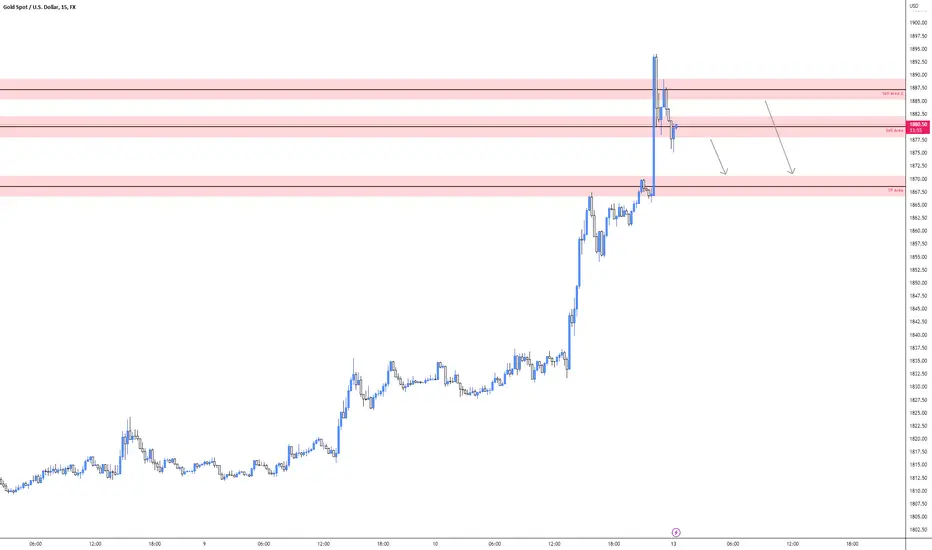
XAUUSD - SELL OPPORTUNITYSelling Gold to TP Area. Sell 2 Last position for sell entry.
Price target: 1868.50
Trade Safe
#XAU USD sell trade1:3 R Sell trade on Xauusd possible continuation downtrend and expecting target below 1815. thanks.
Lets try scalp 19.1.23Lets try scalp for SELL gold in Asia seasson. Recover some loss from today sells. Tomorrow will better chart, I missed today buy oportunity in night.

Rising wedge Gold sell setupGold has been exremely bullish in the past, the rsi is at overbought on the daily timeframe which is in line with the rising flag. Wait for a breakout and ride it down 🤑

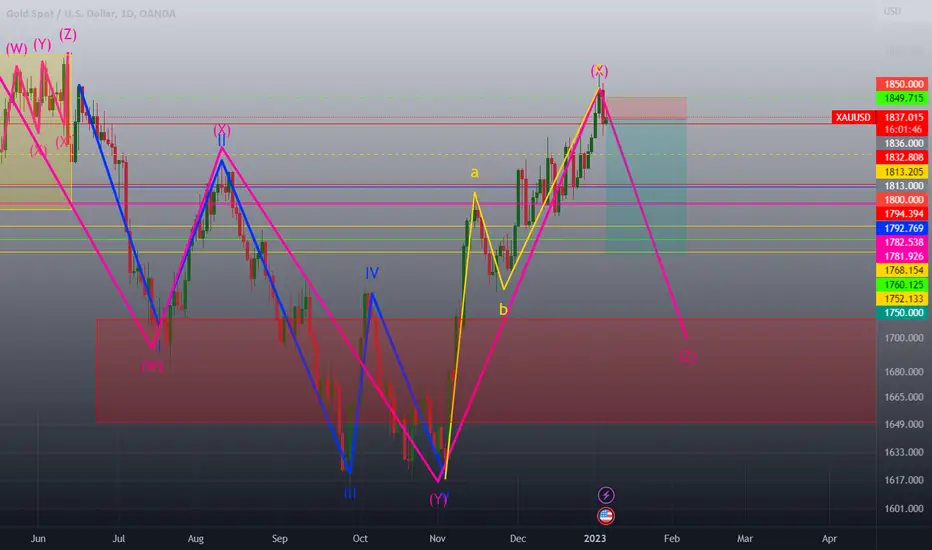
Sell #XAUUSD in case2 with Truncated zigzagThis idea is the second view in the Elliott wave ( Let's see another idea to compare in related ideas links)
TP 1 1746
TP2 1700 (sweet spot)
TP3 1660 ( truncated tp)
invalid for Truncate
SL 1839
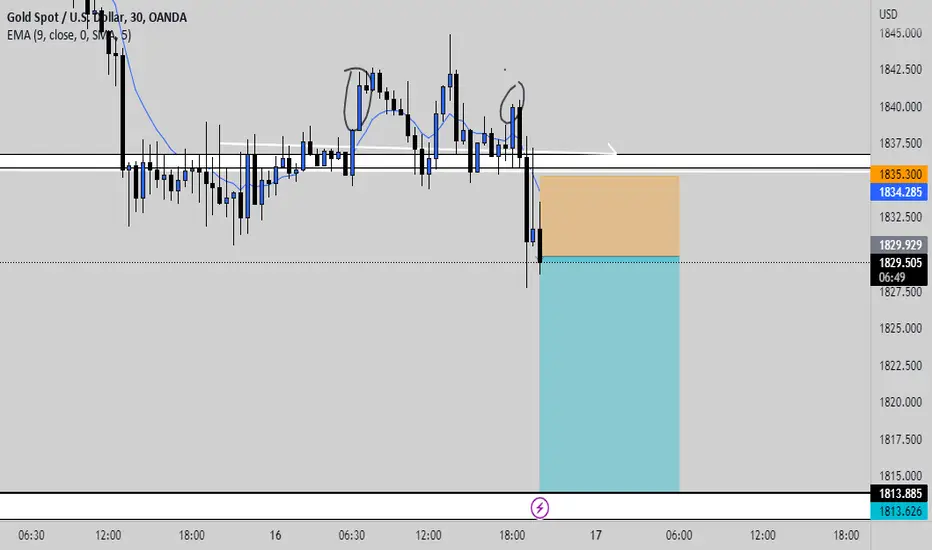
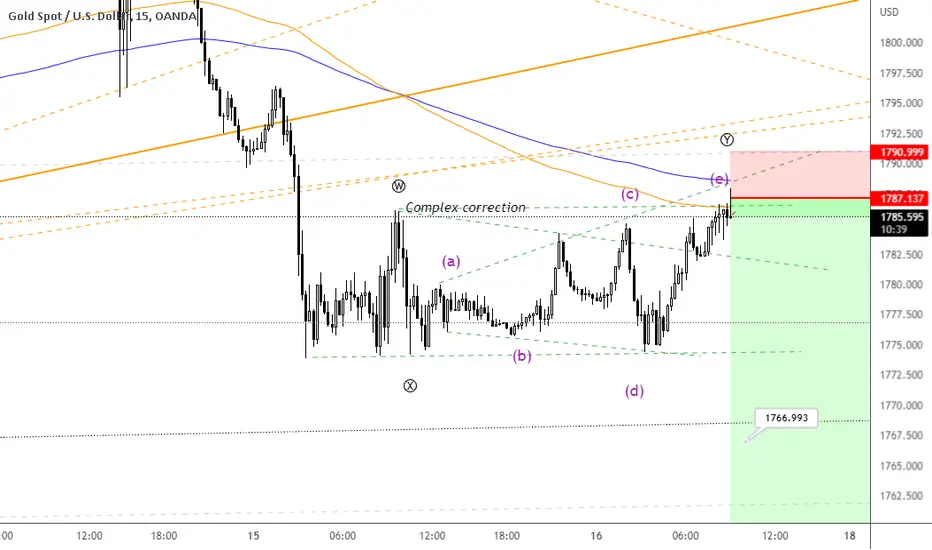
Sell Gold in short term Complex correction on TF 15
bet on a short position with tight stop loss.
Entry 1785-1789 zone
Stoploss 1791
Gold back at it with a rising wedge flag Hello traders!
Gold has formed a nice rising wedge pattern after rejecting the light resistance around 1758.00. The pattern has been broken and looks good for intraday trade. It could possibly retest the trendline around 1758. If you are willing to discuss am open to hear your thougt in the comment section.

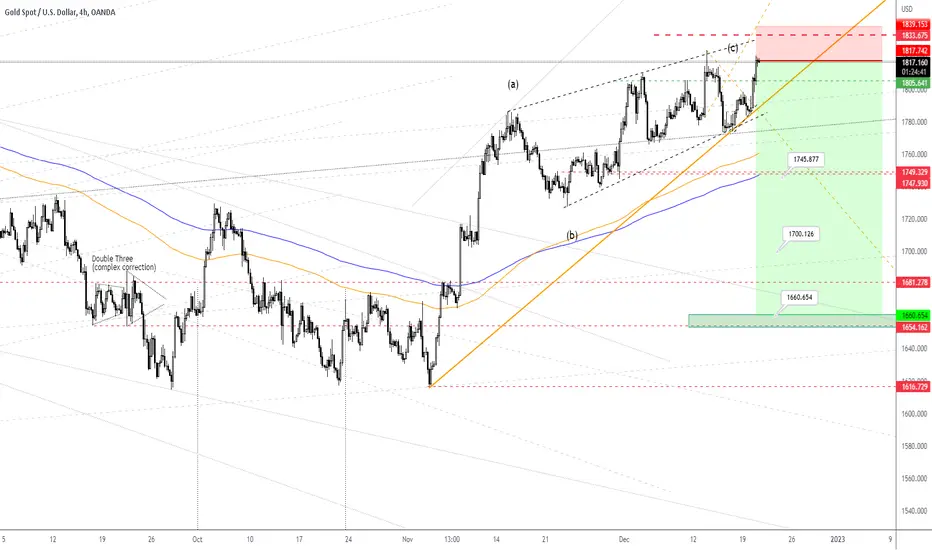
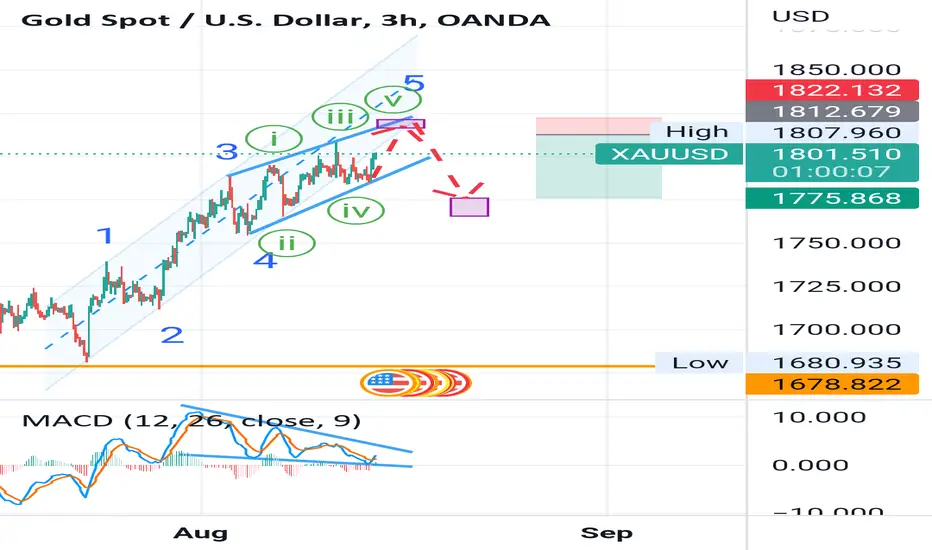
Good Sell position in goldHi
We are in 5th wave of ending diagonal in Elliott wave analysis. A good sell position is ready to catch profit. I predict that flat or regtangular correction can be occurred.
Have a good trade
Yours
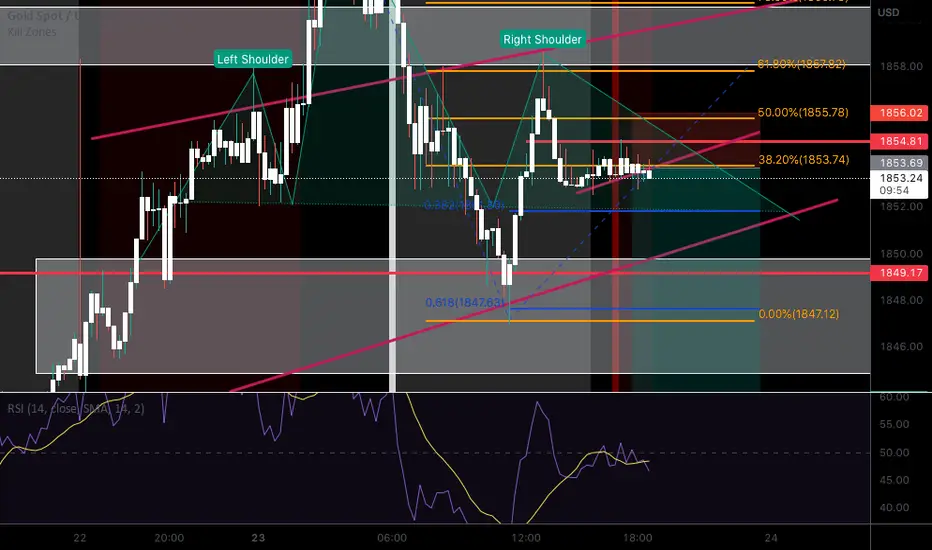
sell goldresistance at 1854 created double top. seems to have retraced to .618 retracement. right shoulder of h&s pattern seem to be forming. rsi divergence on 15m tf.
SHORT ON XAU/USD GOLDPrice has been falling on gold as the dollar has been getting stronger.
Moving average cross of the 50 and 8 period moving average on the higher time frame, along with price respecting an bouncing off 8 period moving average.
I expect gold to fall at least $10 from 1931 to 1921 for a gain of 100 pips
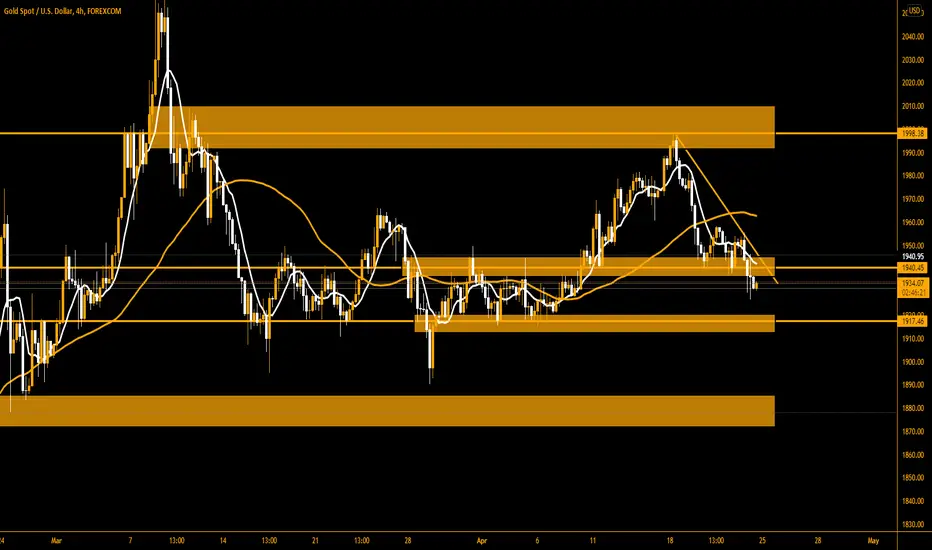
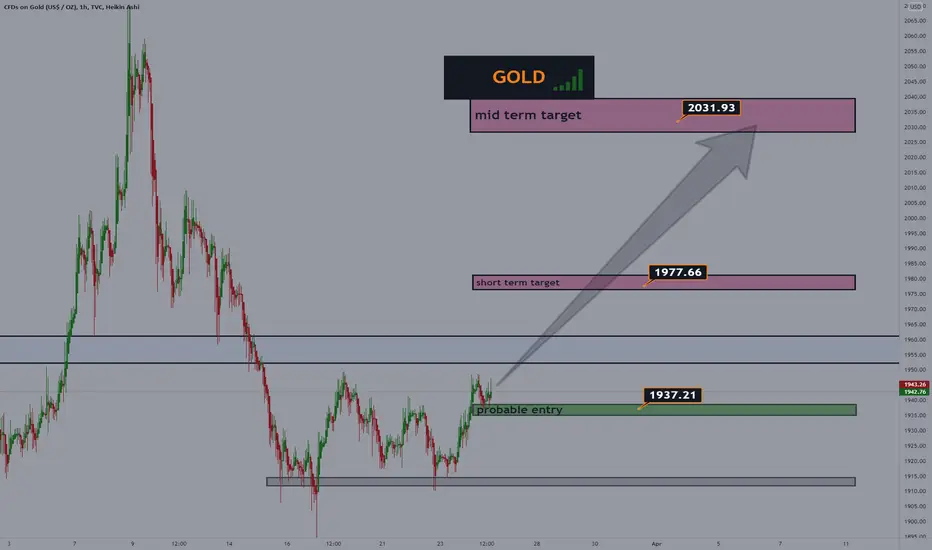
Mid term forecast of XAU/USD GOLDZEYAN here!!!!
I'm looking at the market as a bull, and as far as I can tell, in the medium term, it's more bullish than bearish
This is a general idea of how I view the market; I use various entry techniques; please do not take this information at face value; conduct your own research.
Please let me know in the comments if you want me to analyse your charts.
like for more!!!!!!!!!
This is not financial advice; please conduct your own research and use this information as confirmation in addition to your own analysis.