USDJPY SELLTreat for everyone.. I hope you like my analysis. Don't forget to drop a like and leave a comment.
Follow for more accurate signals. Testimony: check my profile for old analyses.
PM me for a surprise
thankyou
Sell-signals

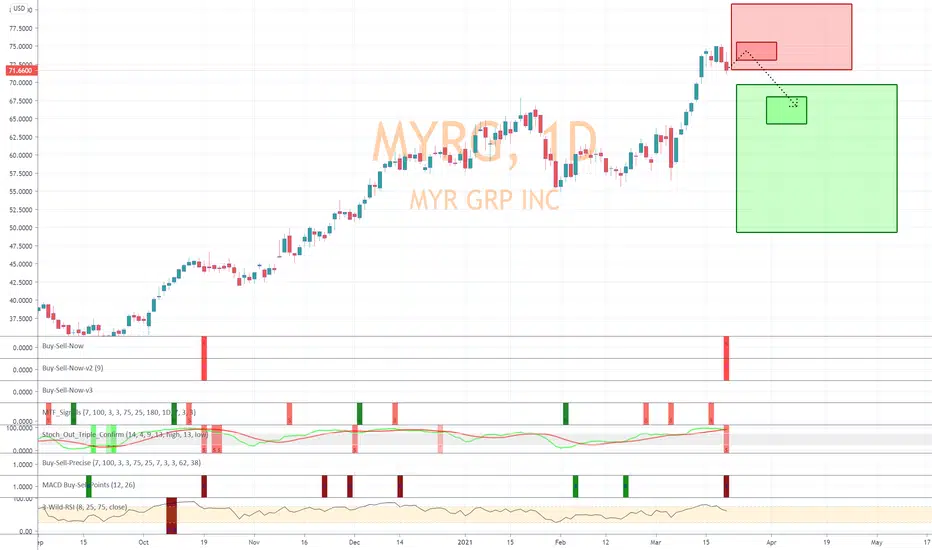
MYRG joins list of my near-term shortsI have changed up how to best display projected movement. In the case of MYRG, 5 of my algorithms signaled a SELL on March 19, 2021. Equities nearly always obey the signal and move down, but sometimes it may continue to move up first.
I have placed two red boxes and two green boxes on the chart. The larger red box depicts all of the historical movement, from a percentage standpoint, that this stock has moved on the Daily chart after a SELL signal occurred. Therefore, this box represents 100% of previous movement upward before the stock finally moved downward. The smaller red box represents 50% of all historical movement upward, before the stock moved downward. The smaller box is more of a precise target for the potential top in this instance.
The green boxes represent the same thing. In this instance, the smaller green box would be my projected target for the final bottom.
The black dotted arrow represents median historical movement. Medians are a good metric, but they are just one of many I use when forecasting future movement.
As always, the stock could decline the very next bar after the signal without looking back (therefore the red boxes would not come into play) or the stock may never decline (and the green boxes may never come into play).
All statistics and the full analysis are available for free as always at the site below.
EURCAD TP1 HIT FOR +60 PIPS! LAST WEEKS RECAP FRIDAYSo our final trade placed on early friday morning was the EURCAD pair. We've watched this position for weeks lining up and we knew it was going to be a big one. We secured huge capital gains in this trade and was very confident that the trade would play into our favour. The pair fell nicely into profits within the first 20 minutes of entering and continued to fall deeper and deeper. Around 3 hours later and our first Take profit target was reached for a total of +65 Pips. We then allowed TP2 to run further until eventually we manually closed out and secured a further +80 Pips before the market closure on friday.
This week we have had wining trades and loosing trades but all together we are up roughly +245 Pips for a total of 3 days trading. Last week was a massive week for us here at forexinsihgtsuk and we are now back on the grind this morning looking to continue analysing the markets for the best setups.
We stay humble and we move forward.
Happy Monday traders. Good luck!

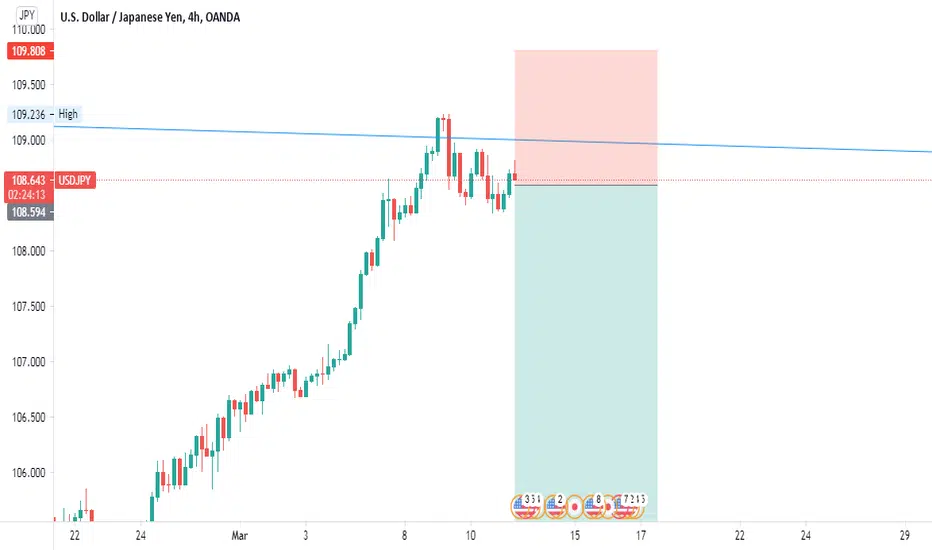
USDJPY SHORT(SELL)PRICE WAS IN A HIGH BULLISH MOMENTUM
WHEN IT APPROACHED THE WEEKLY TREND LINE ,IT REJECTED AND FORMED A DOJI CANDLE STICK FOLLOWED BY A LONG RED CANDLE STICK,SIGNALING A CHANGE IN MOMENTUM.
Your Suggestions Are Welcomed
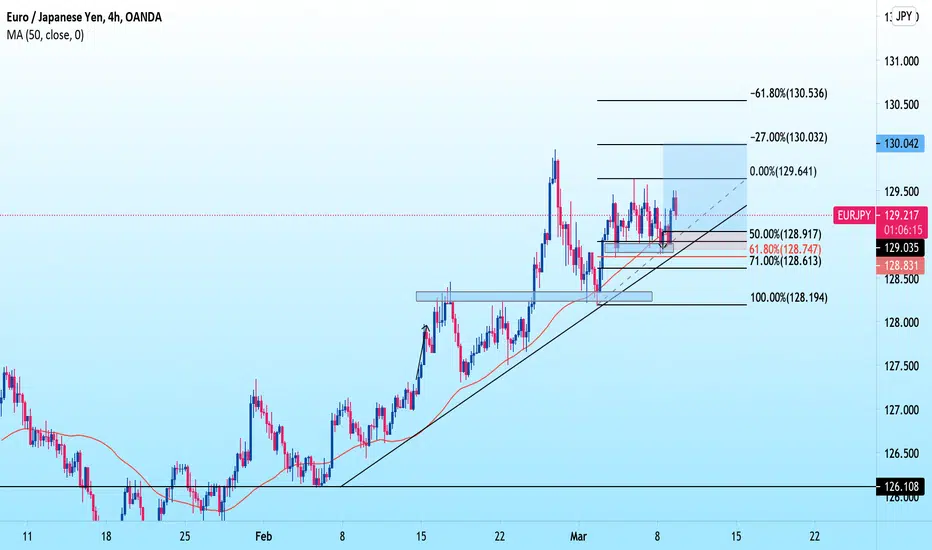
EURJPY CLOSED MANUALLY FOR +40 PIPS PROFIT!Good morning traders. As we spoke on our last analysis post. We entered a few positions first thing Monday morning and one of those positions was EURJPY. We've been chasing this pair for a while now and profited massively last week on it. We entered another position yesterday and profited a further +40 PIPS which was a big gain. We currently have one more position running from yesterday and we are currently looking for further setups to enter today.
Have a great Tuesday and we will update you on further positions later.


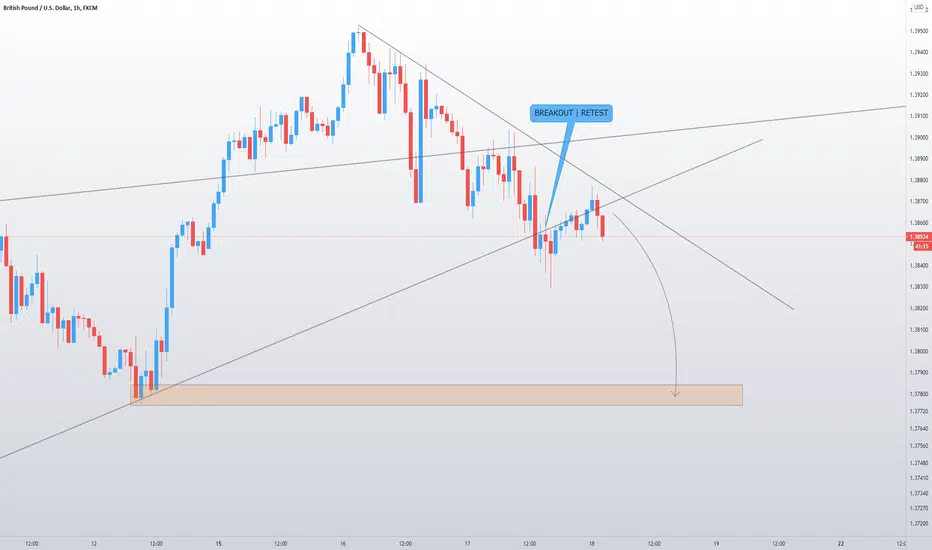
GBPUSD SIGNAL - SHORTI can see price to start fall from weekly key level (resistance) i assume it will go back up soon to complete the retesting the weekly resistance level before we see bearish. this is my personal view.
Trade at your own risk
If you liked our ideas, please support us with your likes 👍 and comments.

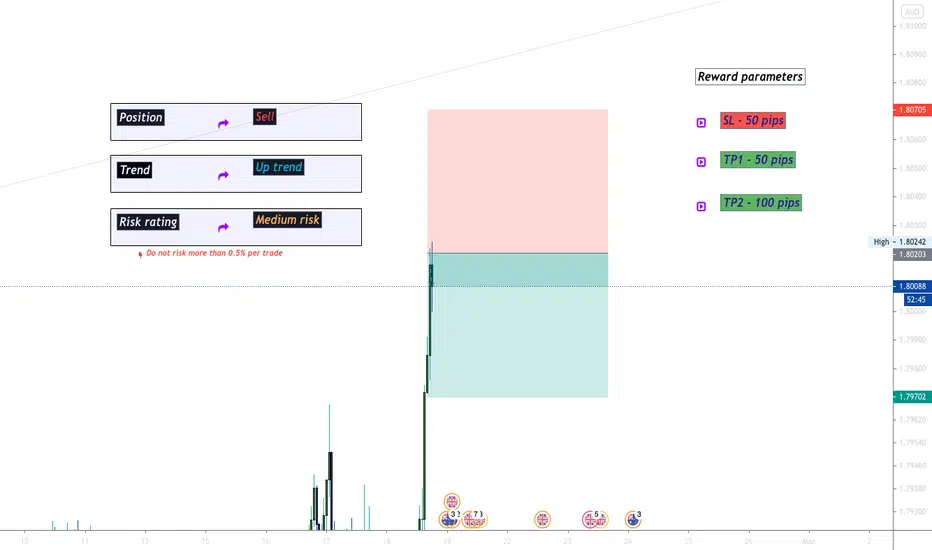
GBPAUD Sell area medium riskGBPAUD Sell area medium risk
great kay lvl for sell position, RSI overbuy
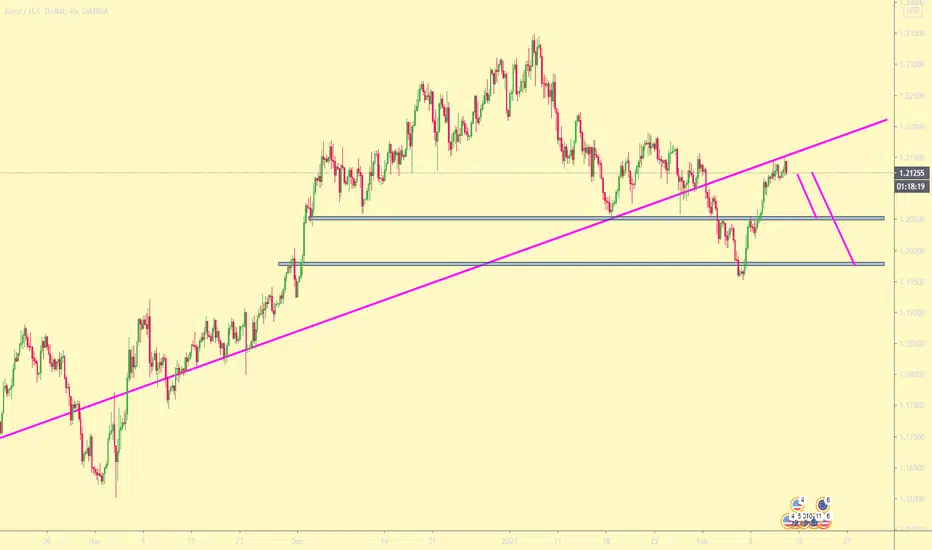
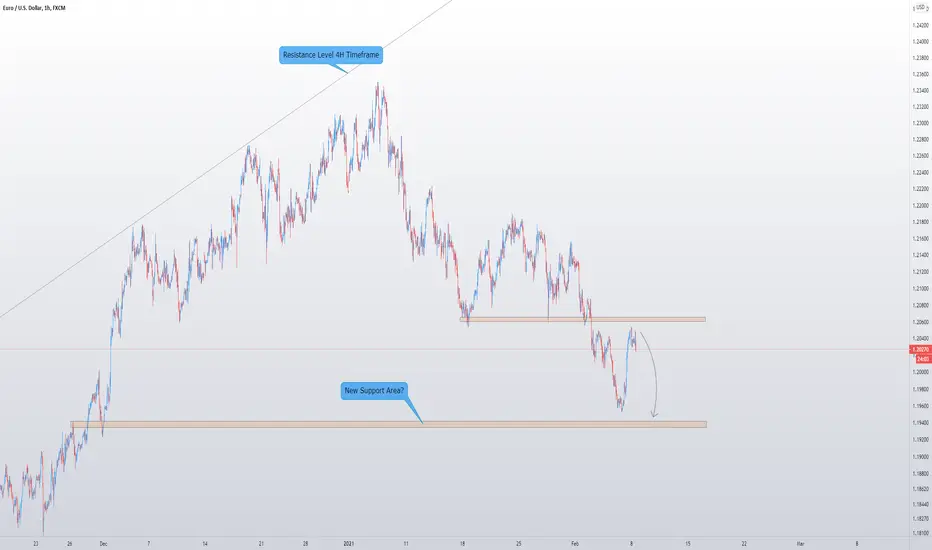
GBPUSD SIGNAL - SHORTBased on my analysis and theory, I am expecting price will start to fall.
Trade at your own risk
If you liked our ideas, please support us with your likes 👍 and comments.
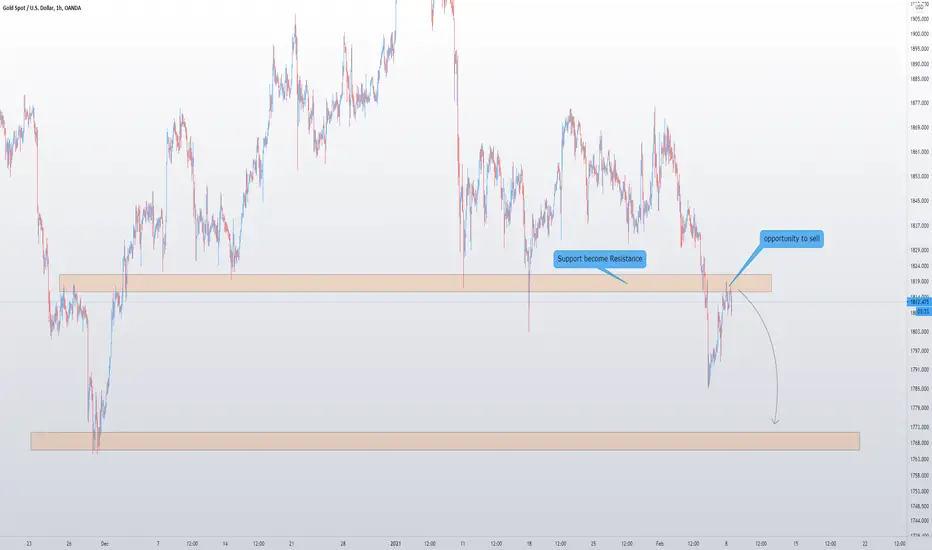
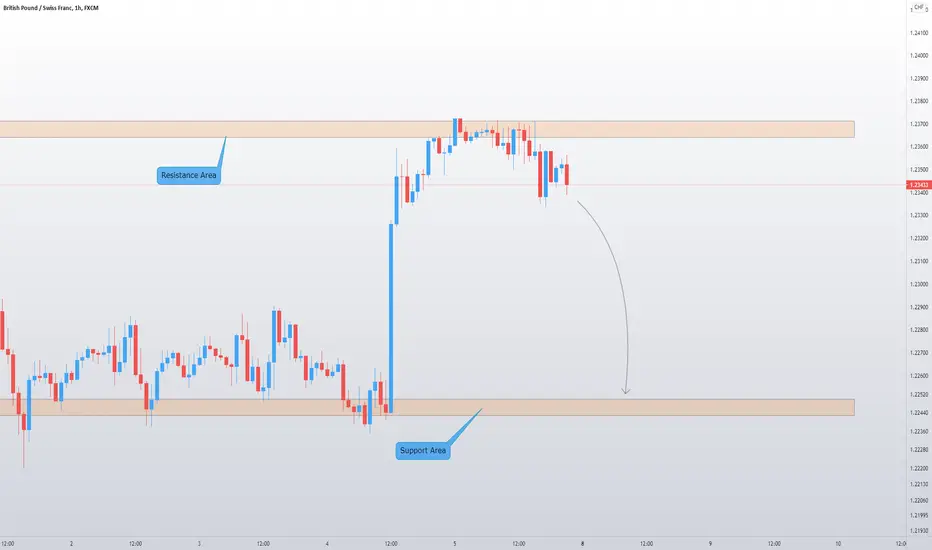
GBPCHF SIGNAL - RESISTANCE LEVELIs Resistance level strong enough to keep price to fall? We will see how this one play this week. This might be good opportunity.

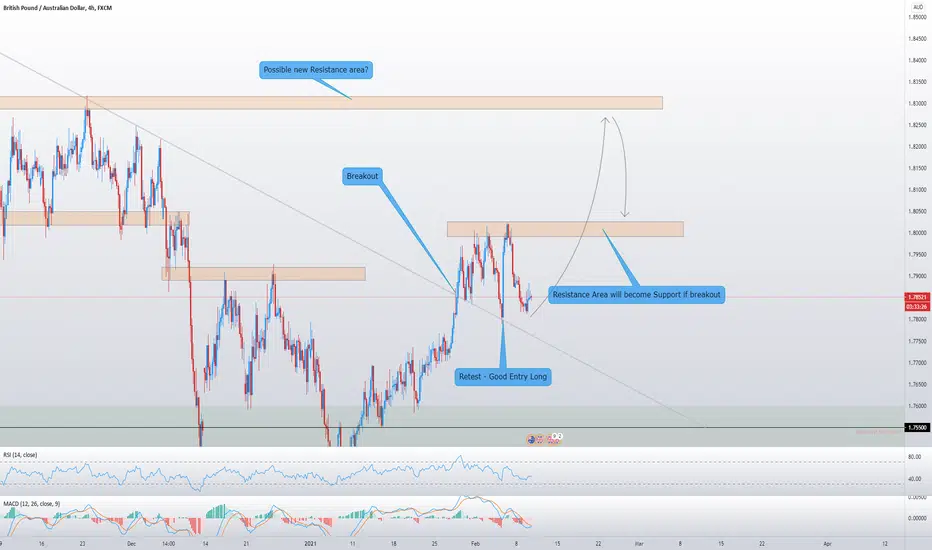
GBPAUD - BREAKOUT KEY LEVELSThis is my personal view, If the BXY price is still showing strong uptrend then i assume GBPAUD price will start to climb up.
Trade at your own risk.

DON'T MISS THIS OPPERTUNITY - EURUSDWe will be looking to Sell EURUSD!
The first indicator we used was the Fibonacci Retracement. We can see price has reached the 'Golden Zone' after a Bullish finish to the first week of February.
However, the Stochastic indicator is also pointing towards a sell off. You will notice the market has been extremely overbought.
Lastly, you will notice price broke the descending trend on Friday afternoon, I believe we will see price retrace back to the trend before the market move Bullish.

GBPCHF - SHORTI assume GBP is very weaken this week and should see the price to fall to the support area. this is personal view.
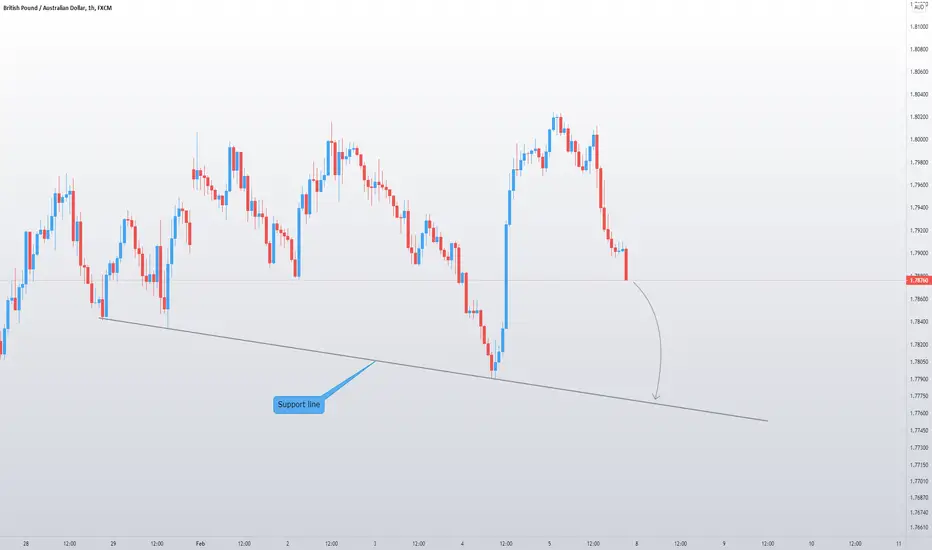
GBPAUD - SHORTI can see the price will continue fall to the support line, I would wait for the price action before entry short

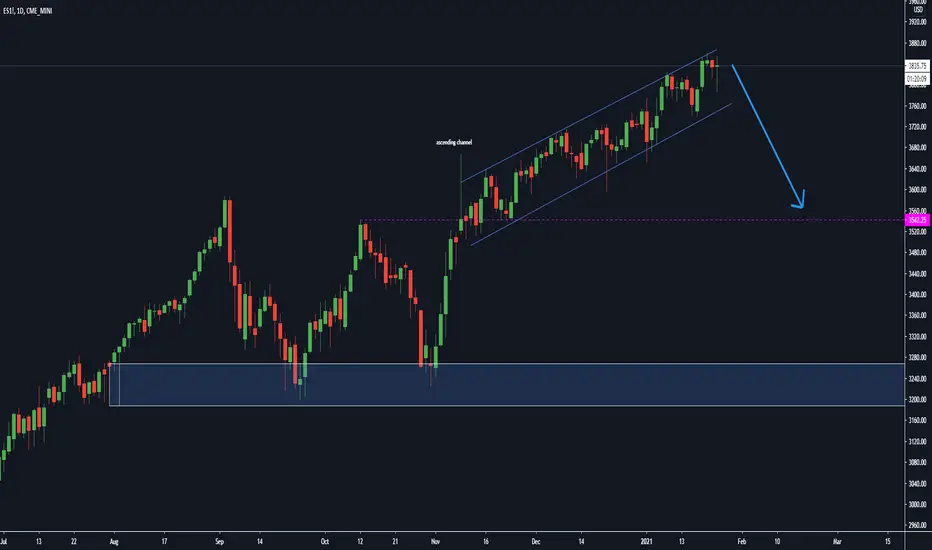
SP500 DROP INCOMING?I'm expecting a move lower on the Sp500. It is long overdue but I am not going to try and trade the top, I believe the rally up into new all time highs AFTER the strong drop in price will offer up the biggest risk reward. So right now waiting for the drop. Stay tuned :)
NZDCHF - SHORT - RESISTANCE LEVELI can see price will fall from resistance level and possible go down to 200ma moving average level. This is personal view.

CADCHF sell! Going down!! Sell at the break!Hello Traders, here is the full analysis for this pair
Watch strong price action at the current levels for SELL GOOD LUCK! Great SELL opportunity in CADCHF ..
I still did my best and this is the most likely count for me at the moment.
