USDCAD SELL, just as I predicted ! Good Luck tradersWatch strong price action at the current levels for SELL. GOOD LUCK! Great sell opportunity in USDCAD..
Sell-signals

British Pound / Australian Dollar 4H ( Sell Setup )Hello Good Day to every traders around the world. Here is my analysis for GBPAUD in 4H chart. Previously, i predicted that this chart is valid for buy setup but unfortunately it fails. It creates a new turning point there and now we are more into sell mode. Due to GOLD rise, AUD will rise too. I've posted my targeted TP and SL with the long position box. Thank you for viewing my analysis on British Pound / Australian Dollar setup and do like if you think it's worth to view and follow.

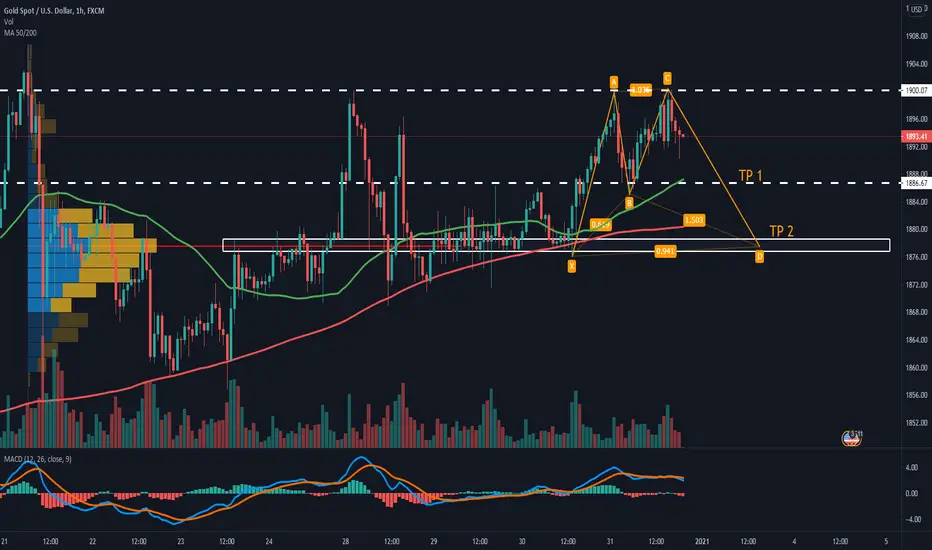
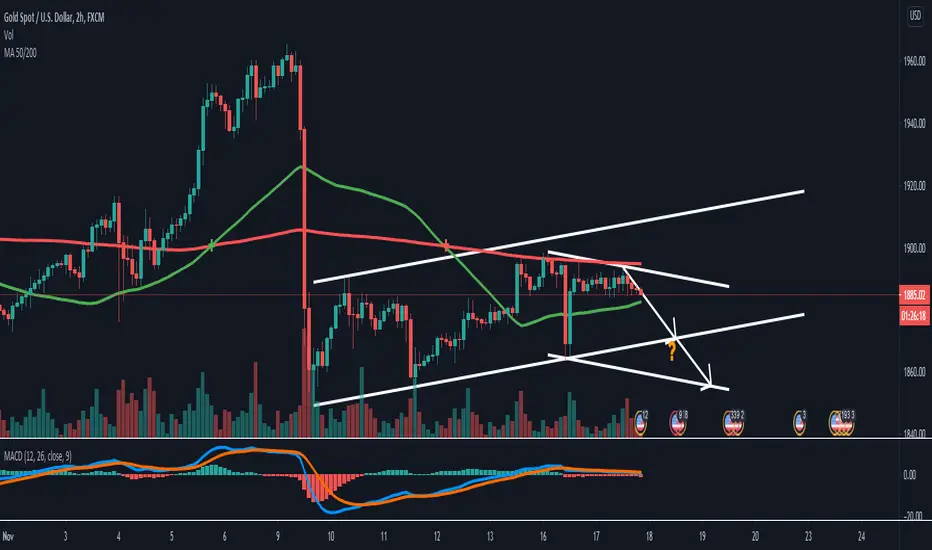
Xau/Usd 1h Xau/Usd in time frame 1h sell. Target one is 1886.67 and target two is 1878.00 . Don't forget to look the economic calendar.
.
.
.
.
THANK YOU
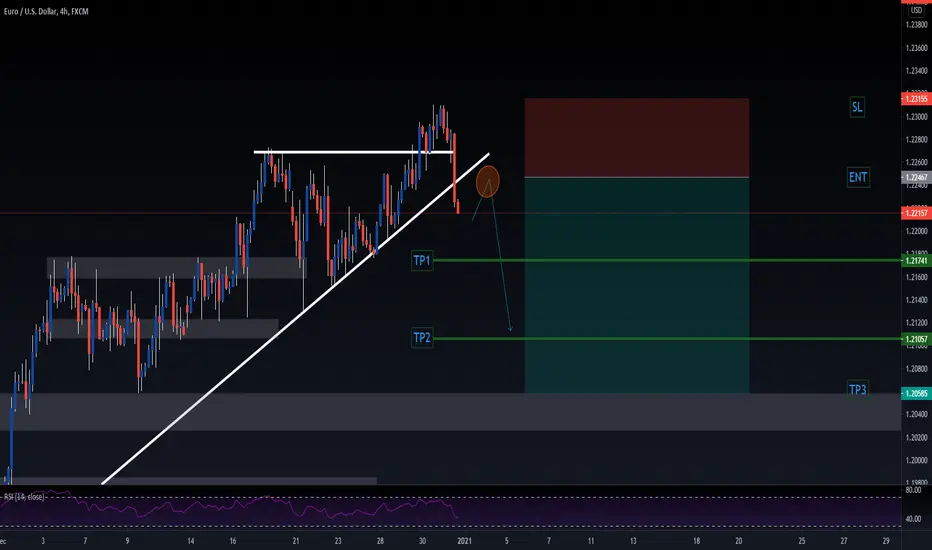
EUR/USD SIGNAL (Short term sell)TOPDOWN ANALYSIS: Shows bullish trend being broken (with large 4H candle break below trendline)
ACTION PLAN: 1.) Wait for pullback/ retracement to 1.22467 price level
2.) Look for a wick rejection and an bearish engulfing = enter with a 1:3 Risk reward
MAGIC IF: 1.) If price pulls back above trendline and consolidates = wait for another bearish break and retest
1.2) If price pulls back above trendline and shows large bullish momentum candles (large body but small wick) wait for a break and retest above previous structure highs (then look to enter a buy)
2.) If price continues down without retesting = Don't enter (because of possible entry at exhaustion) but wait for at least four bearish trend confirmation LL, LH, LL, LH
Reasons/ Confluences:
.Price has not yet reached monthly High and has broken bullish trendline structure
.USD News event strengthening the dollar
.Large 4H candle close below trendline
TIPS:
.Enter a sell position with a sell stop
.Once price has moved to 1:1 risk reward, move stop-loss to break even and possible exit (if candles show exhaustion)
.Never enter a trade hastily (there will always be more opportunities)

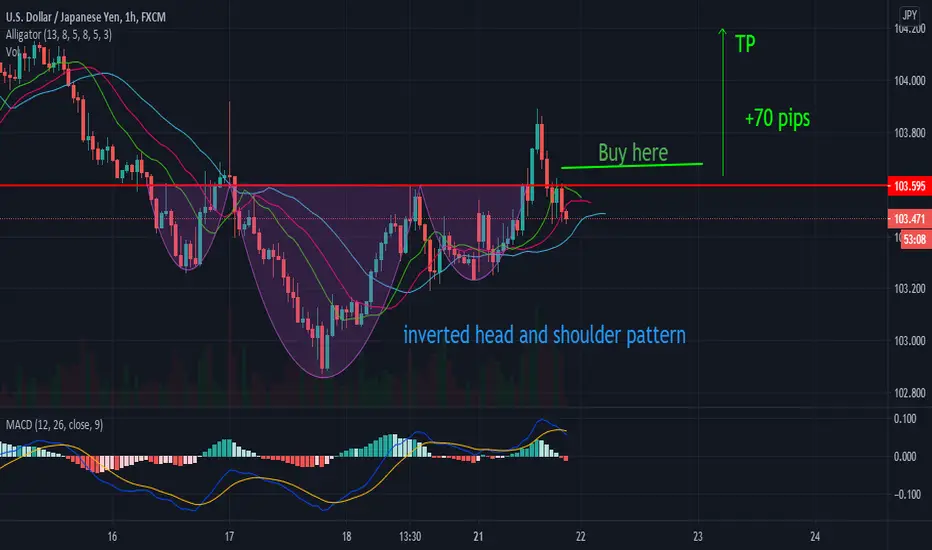
USDJPY, Buy signalUSDJPY created head and shoulder pattern MACD and Alligater saws bullish trend. now you can set pending buy stop order according to chartt drawing
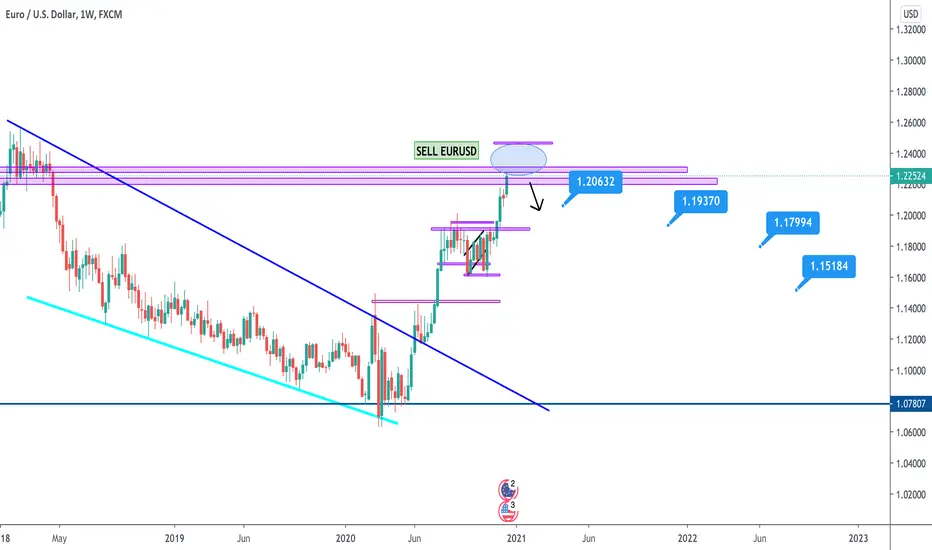
EURUSD SELLBlue circle is sell zone...
different numbers show places to take partial profits or full profits..
keeping g things simple looking for an easy bounce off resistance.
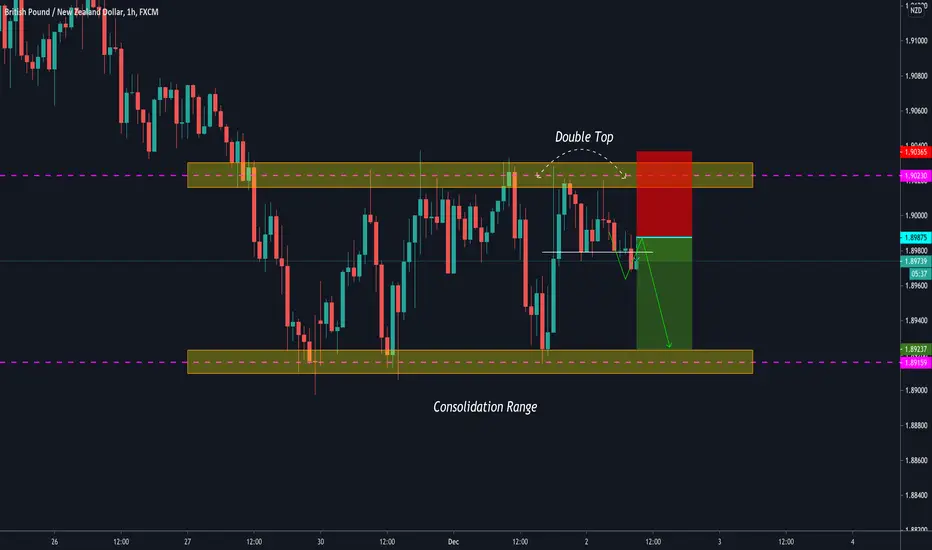
GBPNZD: Scalp Short
GBPNZD is trading in a local horizontal consolidation range.
The price has recently reached its resistance and formed a double top formation.
I shorted after the breakout of its neckline.
Goal - 1.8925
Scalp trades are very risky,
don't risk more than 0.5%
AUDUSD good time to SELLThe price moves in a stable uptrend despite pullbacks and corrections. Movement is regulated by the support line and the resistance line of September 2020.
Last time, the price just fell from resistance to support, having touched it with a candle shadow.
After that it rose, again failed to break through the resistance at 0.735 and began to fall again.
The resistance line is not the longest on the chart - it appeared in September this year. However, as you can see, the price came back even after a breakout.
Now I am waiting for the price to fall towards the support line. You can open a sell deal. I will never tire of reminding you of the importance of SL - set it above the resistance line in the area of - 0.738.
Traders, if you like this idea or have your own opinion about it, write in the comments. I will be glad👩💻

Xau/Usd SELLXauUsd SELL. Target one is 1870.00 and target two is 1855.00. Don't forget to look the economic calendar.
.
.
.
.
THANK YOU
Eur/Usd sell Eur/Usd sell. The focusremains on the US presidential election, as a winner has not been announced. A few states are still counting votes. US President Trump is already disputing some results. Don't forget to look the economic calendar.
.
.
.
.
THANK YOU
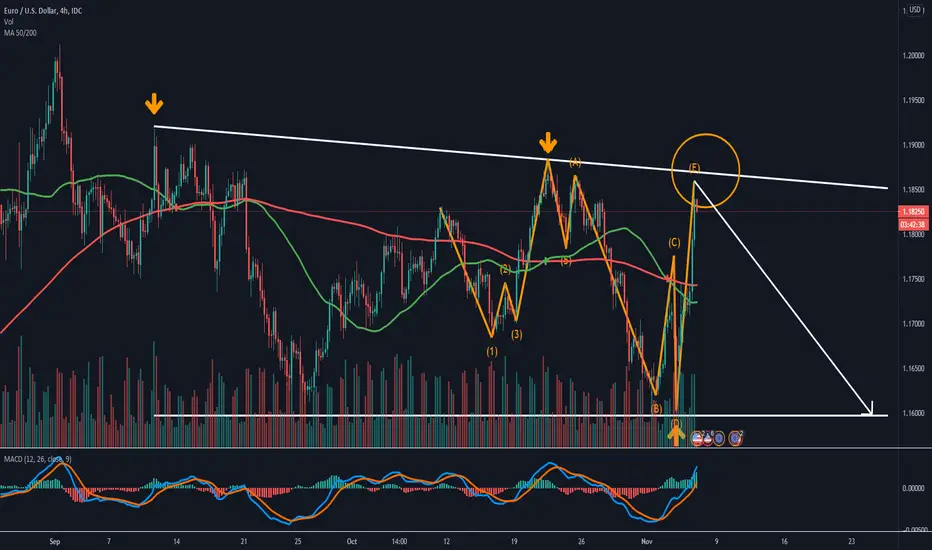
Eur/Usd sell Eur/Usd in time frame 30m is SELL.
US economy grew at a faster than expected pace in the three months to September.
EUR / USD is selling in the short term, and is expected to go very low.
Target is 1.1600. Don't forget to look the economic calendar.
.
.
.
.
THANK YOU

EURNZD- Shorts upon head and shoulders confirmationWe can see we have created a double top, but what also looks like a head an shoulders formation, although it is not the cleanest if we can break this neckline then it will confirm this head and shoulders pattern. However I will only be looking at taking shorts upon a confirmed lower low then on the retracement of a lower high.

AUDUSD- SELL LIMIT SET, EYES PEELEDAs we can see, price has broken out of this ascending trendline, creating a lower high and a lower low, I have set a sell limit at 0.71308 as this is an area of interest, with the 50 fib level, structure level and 50 EMA all in alignment.


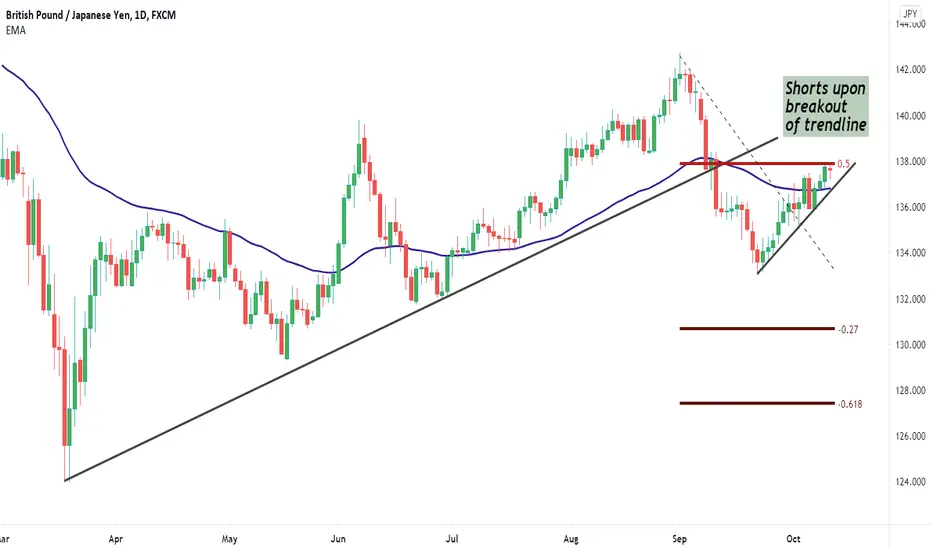
GBPJPY- Shorts setting up upon confirmationHere we have GBPJPY on the daily timeframe, a nice breakout of this longer term ascending trendline, creating a lower low, we also have a little correction happening where price is now interacting with the 50 fib level, If we can get a breakout of this short term ascending trendline I would look to short this pair.
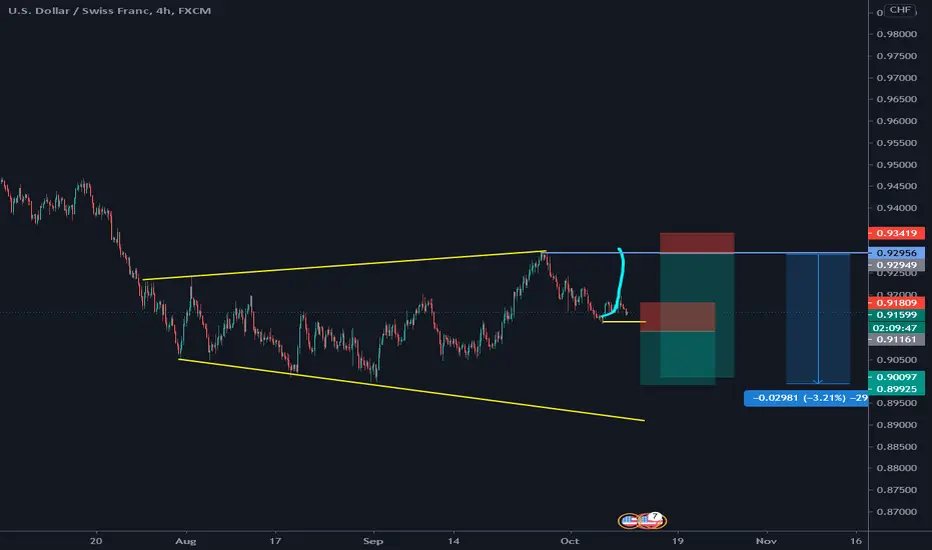


USDCHF Sell signal Corrective wave with sell signal after breaking out of the Raising wedge.
TPs are provided as well as stoploss
Money management First

GBPUSD SHORTI believe the GBPUSD will go for a short because I can see a downtrend.
It will hit the 1.28 zones then bounce down to the 1.26 zones.
