Che_Trader Swing Strategy - 2017 to 2020 Results vs BTC holdThis is my main strategy and the one that is being executed through BOT live since several months ago.
I was due a post with the general results and a year to year analysis compared to the performance of hold BTC.
All trades include 0.15% fees+slippage.
|*****************************************************************************************************************************************************************************
| General stats from 2017 to 2020 are in the bottom, These are:
| (**All data include 0.15% fees+slippage what is more than double the normal fees**)
|
| - 32899% Gains (compound)
|- 146 transactions
|- 18.44% Max drawdown
|*****************************************************************************************************************************************************************************
The year-by-year analysis is very interesting:
|*****************************************************************************************************************************************************************************
|2017 Hold result
|
|+1260
|%
|
|
|
| CheTrader Swing Strategy 2017 results:
|
| - +1096 % Gains
|- 38 transactions
|- 14.47% max drawdown
|
|
|The 2017 profits are very similar, a bit smaller, so you can expect the bot run well in next bull run.
|This is something you'd expect, but it's hard to get in a swing bot.
|*****************************************************************************************************************************************************************************
|*****************************************************************************************************************************************************************************
|2018 Hold Result
|
|-72%
|
|
|
| CheTrader Swing Strategy 2018 results:
|
| - +395.4% Gains
|- 42 transactions
|- 16% max drawdown
|
| In 2018 we earned almost 395% in usd. This means that if we would have run the bot during 2017-2018 we would keep the 2017 earnings, and even more, we would multiply them by X4
|
|This is very significant.
|
|A sensible example, if at the end of 2017 we had 1 BTC valued at $13300, to hold that BTC until the end of 2018 would be worth about $3700.
|But if we had run the swing strategy it would be $13300+395% that is,
|$65835 which in addition, to the BTC worth only $3700 gives us a final result of 17.8 BTC
*****************************************************************************************************************************************************************************
|*****************************************************************************************************************************************************************************
|2019 Hold Result
|
|+95%
|
|
|
| CheTrader Swing Strategy 2019 results:
|
| - +322% Gains
|- 40 transactions
|- 18.44% max drawdown
|
| 2019 was a great year for the bot, winning more than three times the performance of BTC, in an irregular year, with many moments of chop.
|*****************************************************************************************************************************************************************************
| *****************************************************************************************************************************************************************************
|To get access, you can send me a PM here or at a link in the tradingview profile.
|*****************************************************************************************************************************************************************************
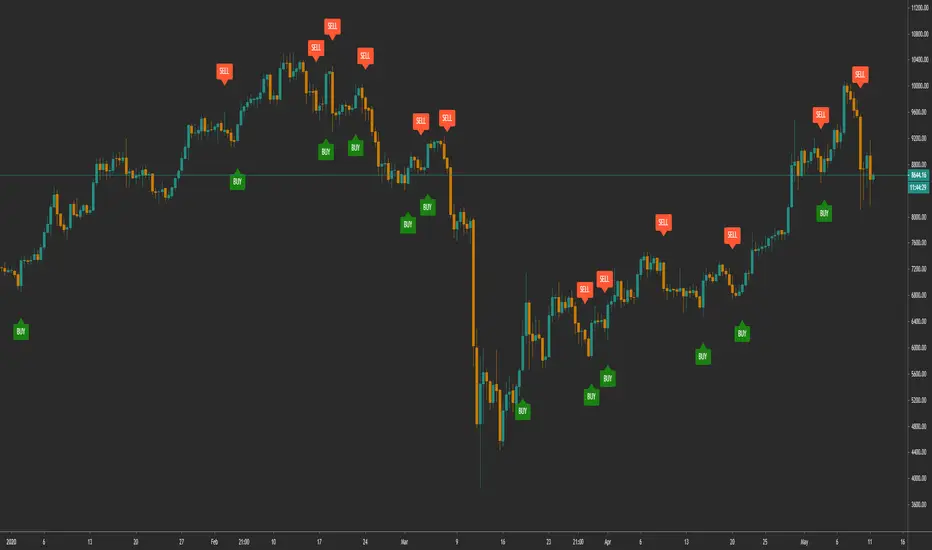
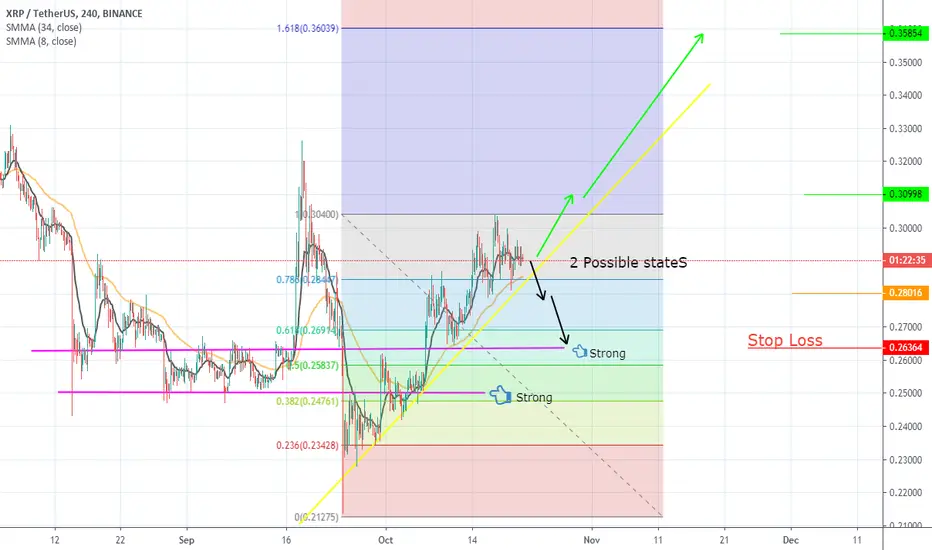
Sell-signals
Shark pattern AudUsdHi friends .
You can draw a trend line in 1h & when price breaks your
T L you can short position .

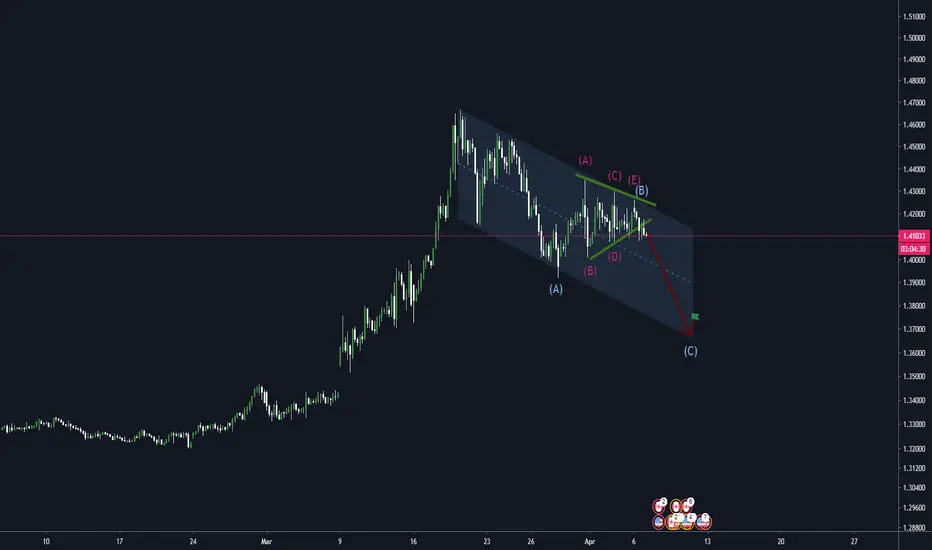
New update #usdcadHi traders .The price is on a downtrend channel
According to elliott wave count, price is forming wave C
Only enter this position if this analysis is consistent with your strategy
Thank you
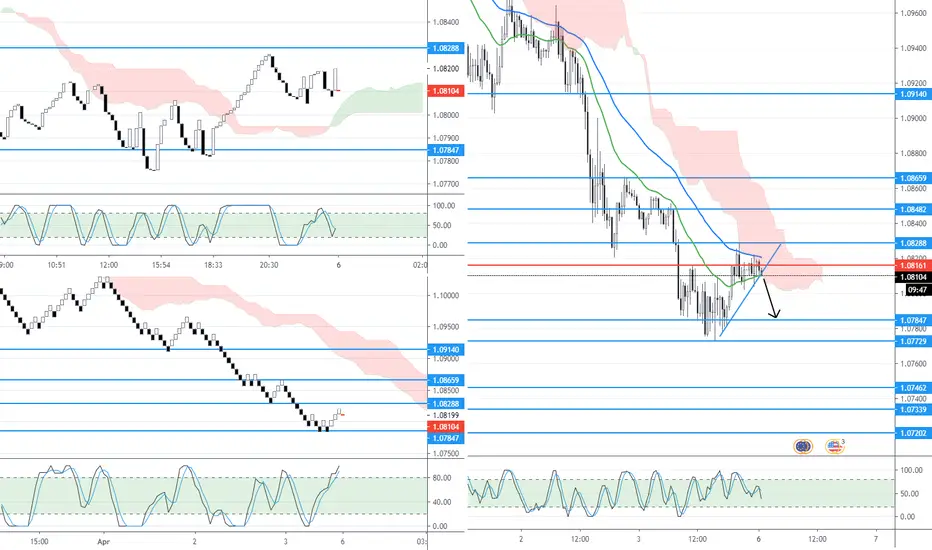
EUR|USD - Short OpportunityThere is an opportunity to short the EUR|USD on the break of the rising trendline supporting the contraction.
- Short entries should be initiated below 1.08094
- Stop Losses should be above the last swing of the corrective higher high 1.08288
- Target Point A : 1.07847 followed by Target Point B : 1.07729
All remaining target supports are marked bellow 1.07729 by consecutive horizontal lines (blue.)
EUR/USD - Short OpportunitySmall risk, decent reward - short opportunity on the EURUSD; SL: Above 1.08659

XAUUSD Pendant ShortPendant Short towards downtrend resumption. SL above last swing high on 1H chart.

CADCHF SELL (MEDIUM TERM) WA2 (15) The pair has broken the market structure and is suggesting more lower highs to be formed. Based on the longer-term view, we can see that the pair is trending down. This suggests to us a good chance the correction on the shorter term may be over.

EUR USD Short as price falls under 14 EMA DailyI am looking to short FX:EURUSD after it finds its support around 1.09880
After this, I expect price to fail under the Red 14 EMA shown as FX:EURUSD is in a bearish trend
If price goes above the 14 EMA, it will then test the 50 EMA (shown in blue) which I would expect it to fail and remain bearish
Your entry point would be executed once you saw the evidence of price failing under the 14 EMA with wicks
I have drawn out what I am expecting this move to do for you
This trade is for educational purposes only, and not a recommendation to take this trade based on my charting


AUDCAD SELL - 4 hrhere on our 4 hr we can see clear breakout to the downside.
this has now completed a full retest and should now see bears come into play

BTC Short to 7995I am looking at a short on BITSTAMP:BTCUSD to 7995
This would be a small move if it plays out
If BITTREX:BTCUSD finds support on this level, I would be looking further at more of a bullish move
This is not a recommendation to take this trade based on my charting. Chart is for educational purposes only

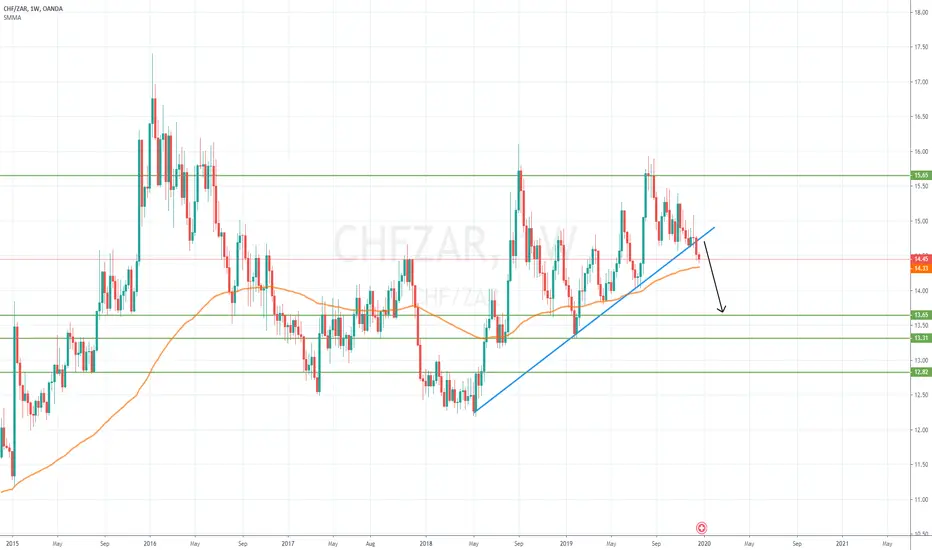
CHFZAR ShortGoing Short After Breaking the trendline and confirmed (the breakout) By the MACD in the weekly frame
Tp1: 13.65
Tp2: 13.31
Tp3: 12.82

BTCUSD Stop-lossStop-loss signal at 7889.7$.
Timeframe - 1 day.
I'd like to add something.
This is automated system of signals. It works with Historical Data, wich I take from www.investing.com
10/11 I saw the price on Tradingveiw site, it was 9250.0$, it's level for buy signal. For this reason I decided to open order. However, when I downloaded Historical Data from investing I saw that maximum price was 9156.90$ in that day, it's not level for buy signal. Unfortunately, I believed to Tradingveiw price chart and bought.
Despite this, I taken one more lesson from market.
In future I will be more careful with Historical Data from Tradingveiw.
Where do you take Historical Data?
__________________________________________________________________________
You can use the signals independently or like indicator of trends together with other indicators in your trading strategy.
Know that the success of your strategy that based on those signals depends from your money management and the additional conditions that you make in these strategies.
You use these signals inside your strategies at your own risk.
The chart shows the last trades on the product + the last signal.
I have several strategies for different products, and I want to show you proof of it works on history, and you will be able to see it, when returns to that profile.
Therefore, subscribe and watch for that profile.
The signals rare but useful.

Mid-Term Gold ShortAs shown in the chart, we are stuck inside of an " Andrews Pitchfork" on the 4H and D time frames. We are looking for gold to drift up to resistance and have a powerful drop down into 1450-1430. From here, this may be our floor before pushing up to new highs which would be over a 1000 pip trade. If you don't want to miss the train on this trade, especially if it drops before hitting 1497-1500 levels, You can scale in to your trade by placing 20-25% of your trade here, and keep adding another 20-25% every 25 pips to get a better averaged entry. Looking to hold this one out to around November 1-4

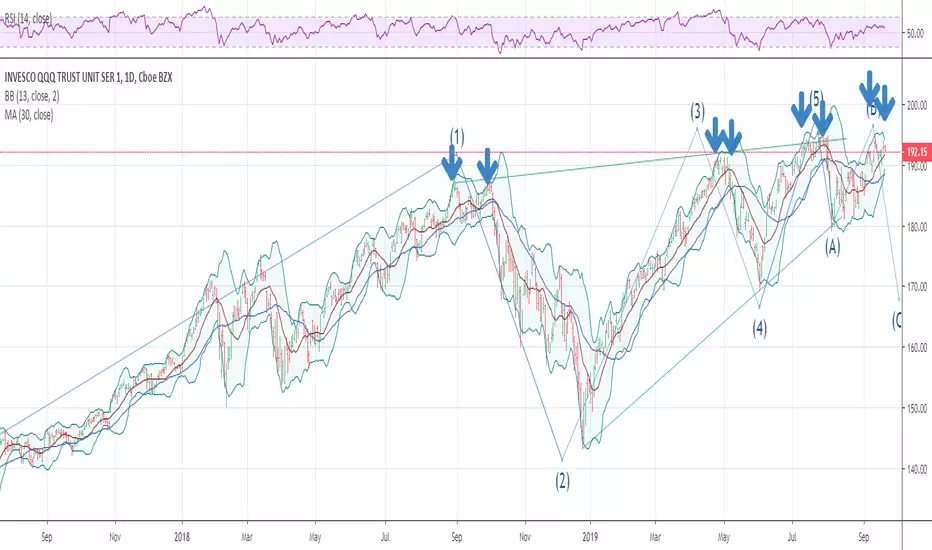
SMALL double TOP HAS formed at each sell signal in the QQQOver the last 18 months when this has happened the failure was a very good sell signal phase we are into the 3 to 5 spirals in time for a I.T. TOP

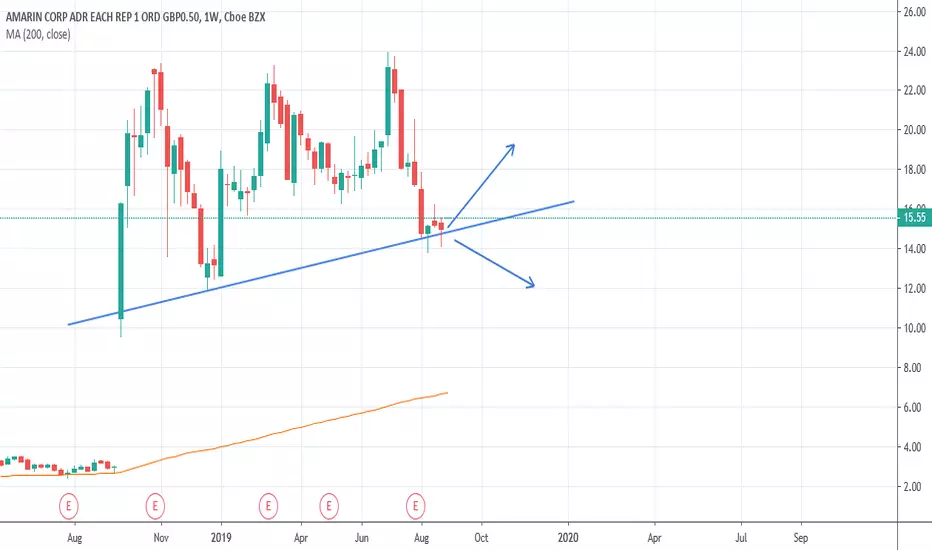
AMRN buyer and seller get readyAMRN price touched weekly strong support level and also has possibility go to short. wait for abc pattern for long and wait for breakout for short. I also watching this one .