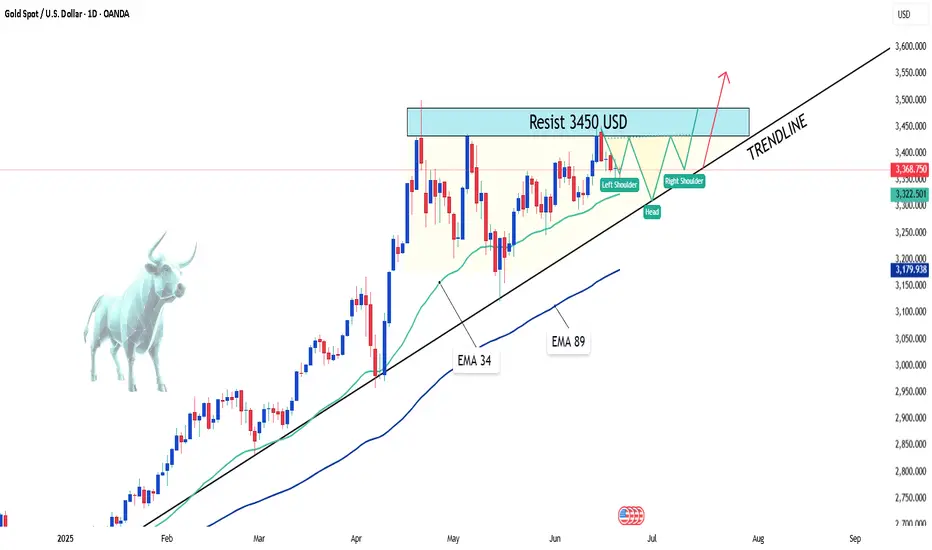
"XAUUSD – Hidden Strength Within the Accumulation Zone"Hello everyone, how are you currently evaluating XAUUSD?
Yesterday, gold remained relatively stable without major volatility, yet continued to be supported by a favorable macro environment. Escalating tensions between Israel and Iran have sustained safe-haven demand. While the U.S. has yet to make a direct military move, President Trump’s emergency meeting and firm stance have increased market caution, which in turn boosted interest in gold.
At the time of writing, gold is trading around $3,368, and the long-term trend still favors the bulls. But why do I say that?
From both a technical and macro perspective, gold is in a healthy accumulation phase. Although it hasn’t broken above the record high, XAUUSD remains safely above key support zones — especially above the EMA 34 — which continues to affirm its bullish structure.
EMA 34 remains a strong dynamic support, with a clear separation from EMA 89, reinforcing the momentum. Even if we see short-term pullbacks in the next few sessions, they are more likely technical retests rather than signs of reversal.
Adding to that, the rising trendline, higher support levels, and bullish candlestick patterns all strengthen the case for continued upward movement. These combined factors paint a positive technical outlook for gold in the medium to long term.
From my perspective, I remain confident in gold’s long-term uptrend. What about you? Feel free to share your thoughts!
SELL
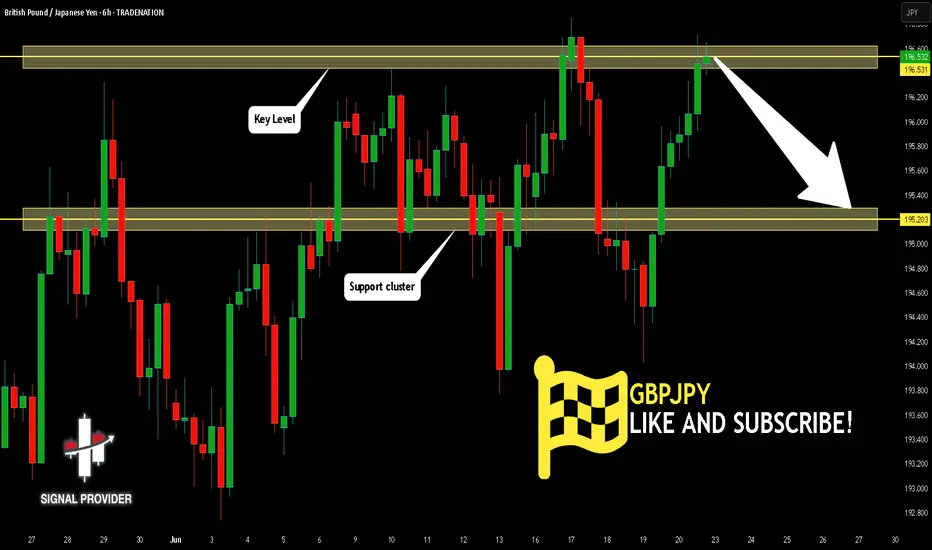
GBPJPY Will Go Lower! Short!
Here is our detailed technical review for GBPJPY.
Time Frame: 6h
Current Trend: Bearish
Sentiment: Overbought (based on 7-period RSI)
Forecast: Bearish
The market is approaching a significant resistance area 196.531.
Due to the fact that we see a positive bearish reaction from the underlined area, I strongly believe that sellers will manage to push the price all the way down to 195.203 level.
P.S
Overbought describes a period of time where there has been a significant and consistent upward move in price over a period of time without much pullback.
Disclosure: I am part of Trade Nation's Influencer program and receive a monthly fee for using their TradingView charts in my analysis.
Like and subscribe and comment my ideas if you enjoy them!
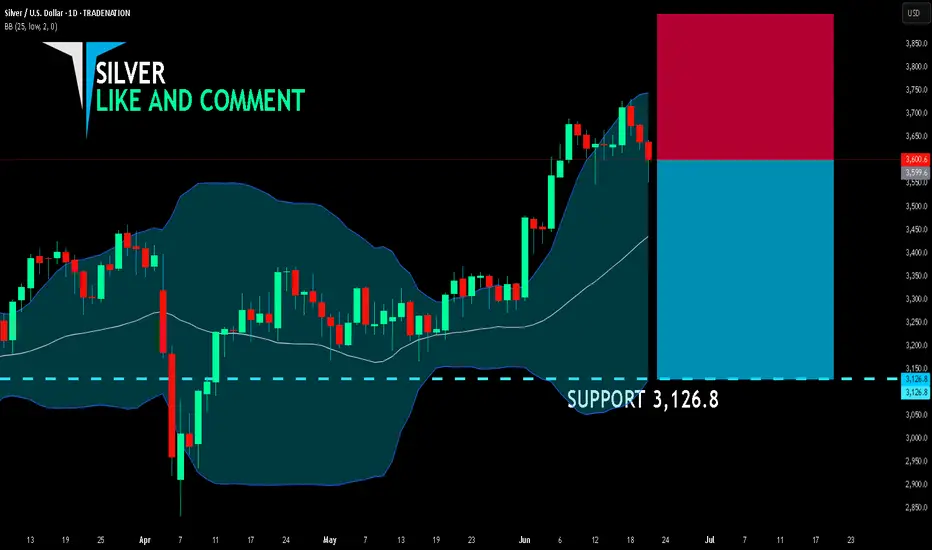
SILVER SELLERS WILL DOMINATE THE MARKET|SHORT
SILVER SIGNAL
Trade Direction: short
Entry Level: 3,599.6
Target Level: 3,126.8
Stop Loss: 3,914.2
RISK PROFILE
Risk level: medium
Suggested risk: 1%
Timeframe: 1D
Disclosure: I am part of Trade Nation's Influencer program and receive a monthly fee for using their TradingView charts in my analysis.
✅LIKE AND COMMENT MY IDEAS✅
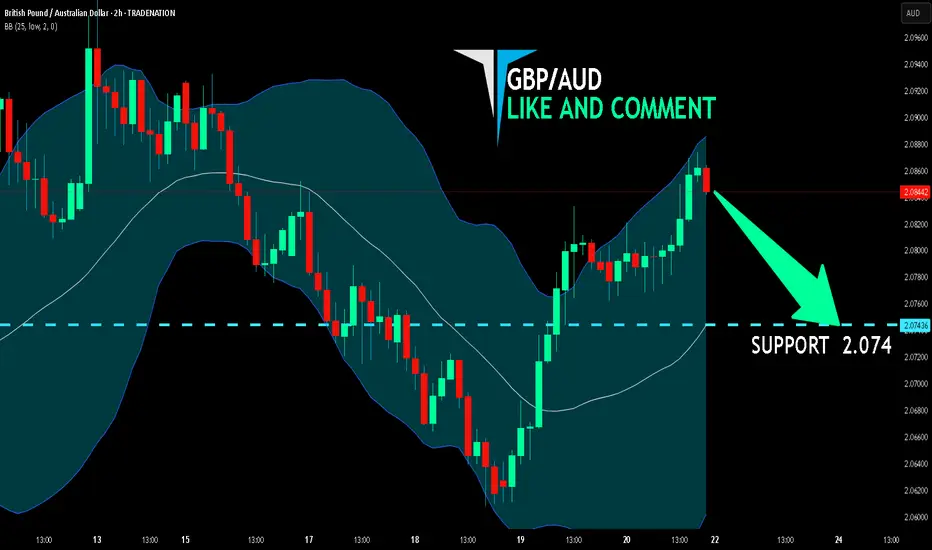
GBP/AUD BEARISH BIAS RIGHT NOW| SHORT
Hello, Friends!
GBP/AUD pair is in the downtrend because previous week’s candle is red, while the price is obviously rising on the 2H timeframe. And after the retest of the resistance line above I believe we will see a move down towards the target below at 2.074 because the pair is overbought due to its proximity to the upper BB band and a bearish correction is likely.
Disclosure: I am part of Trade Nation's Influencer program and receive a monthly fee for using their TradingView charts in my analysis.
✅LIKE AND COMMENT MY IDEAS✅
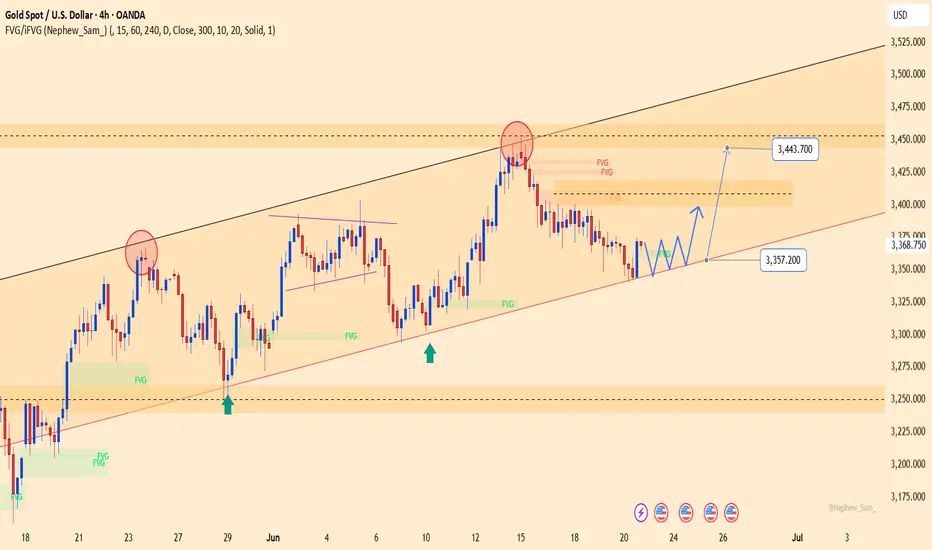
XAUUSD – Weak consolidation near 3,357, eyes on 3,443 retestYesterday, gold traded within the 3,344 to 3,371 USD range and closed at 3,368.75 USD (+0.72%). Despite the slight rebound, price action remains weakly consolidative within a broad ascending channel, repeatedly rejected at the 3,443 USD resistance area — where multiple FVGs (Fair Value Gaps) remain unfilled.
On the H4 chart, price is holding above the key confluence support at 3,357 USD, which aligns with the medium-term ascending trendline. If this level holds, a technical bounce back toward 3,443 USD is likely.
However, it's worth noting that recent upward moves have lost momentum near the upper FVG zones. Traders should wait for a clear confirmation signal — particularly a strong bullish candle at the current support — before considering entry.
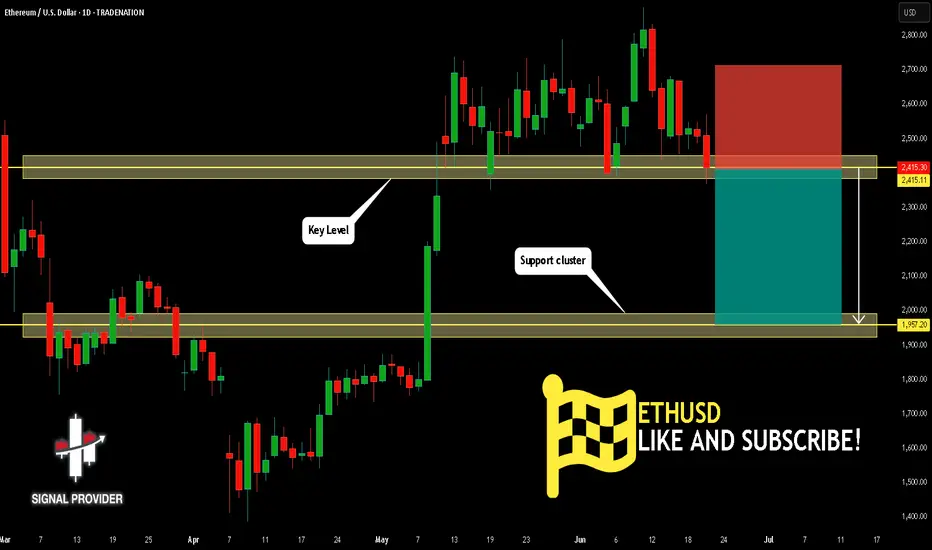
ETHUSD Will Go Down! Sell!
Take a look at our analysis for ETHUSD.
Time Frame: 1D
Current Trend: Bearish
Sentiment: Overbought (based on 7-period RSI)
Forecast: Bearish
The market is on a crucial zone of supply 2,415.11.
The above-mentioned technicals clearly indicate the dominance of sellers on the market. I recommend shorting the instrument, aiming at 1,957.20 level.
P.S
Please, note that an oversold/overbought condition can last for a long time, and therefore being oversold/overbought doesn't mean a price rally will come soon, or at all.
Disclosure: I am part of Trade Nation's Influencer program and receive a monthly fee for using their TradingView charts in my analysis.
Like and subscribe and comment my ideas if you enjoy them!
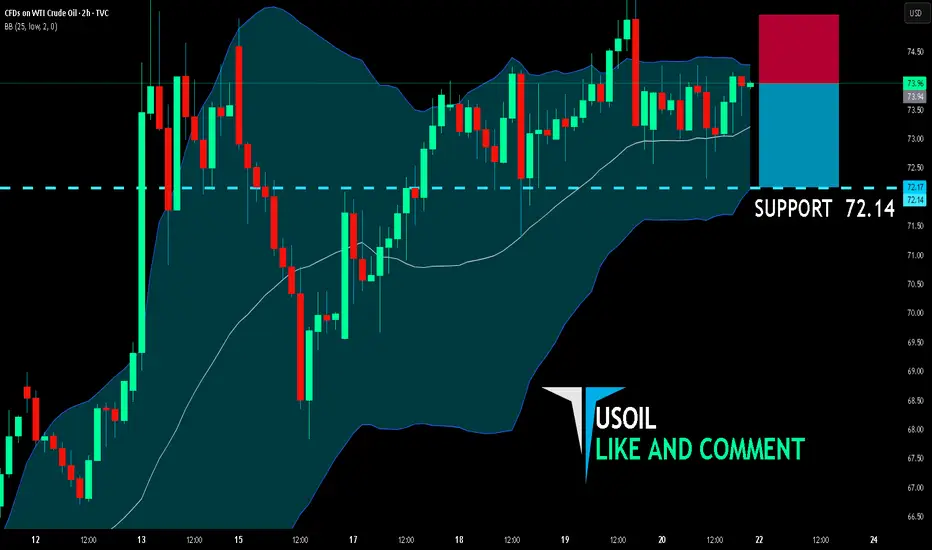
USOIL BEST PLACE TO SELL FROM|SHORT
USOIL SIGNAL
Trade Direction: short
Entry Level: 73.94
Target Level: 72.14
Stop Loss: 75.12
RISK PROFILE
Risk level: medium
Suggested risk: 1%
Timeframe: 2h
Disclosure: I am part of Trade Nation's Influencer program and receive a monthly fee for using their TradingView charts in my analysis.
✅LIKE AND COMMENT MY IDEAS✅
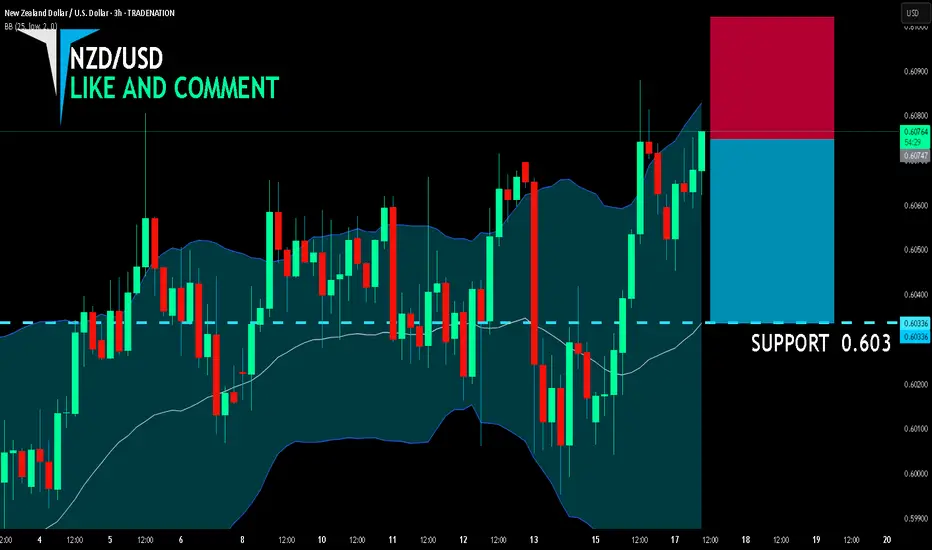
NZD/USD BEST PLACE TO SELL FROM|SHORT
NZD/USD SIGNAL
Trade Direction: short
Entry Level: 0.607
Target Level: 0.603
Stop Loss: 0.610
RISK PROFILE
Risk level: medium
Suggested risk: 1%
Timeframe: 3h
Disclosure: I am part of Trade Nation's Influencer program and receive a monthly fee for using their TradingView charts in my analysis.
✅LIKE AND COMMENT MY IDEAS✅
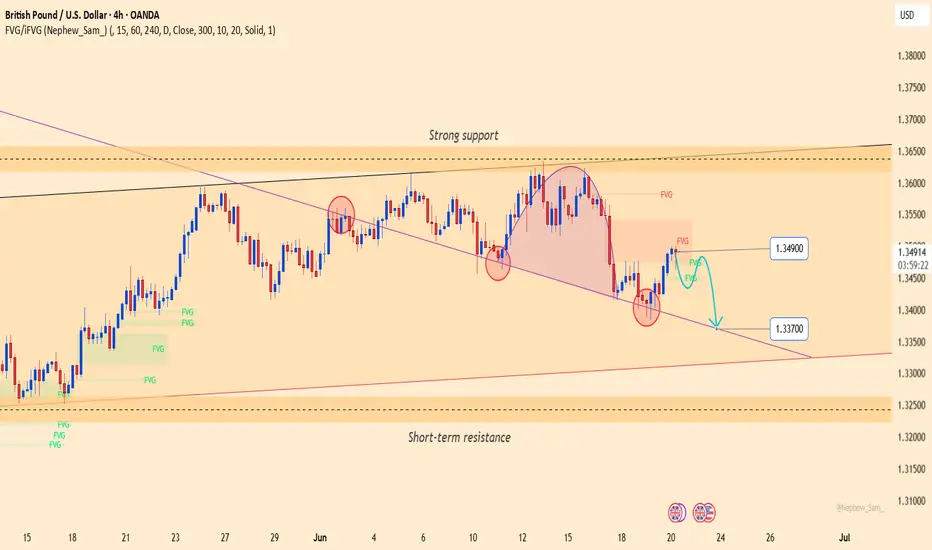
GBPUSD: Bearish pressure persistsGBPUSD is consolidating below a key medium-term resistance zone, with a rounding top and a minor head-and-shoulders pattern forming. The price is currently retesting the Fair Value Gap near 1.34900 — a potential reversal zone if it fails to break higher.
On the fundamental side, the Bank of England's decision to hold interest rates on June 19 disappointed the market. Meanwhile, the US dollar remains supported by safe-haven demand and the Federal Reserve’s hawkish tone, adding further pressure on GBP.
If GBPUSD fails to hold the trendline support near 1.33700, the risk of a deeper decline increases. Both the technical structure and macro fundamentals favor the bears.
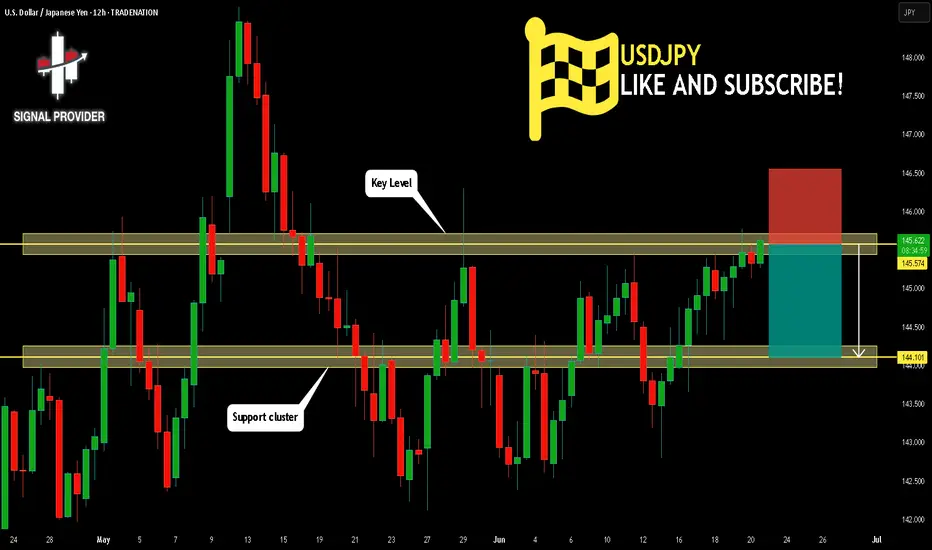
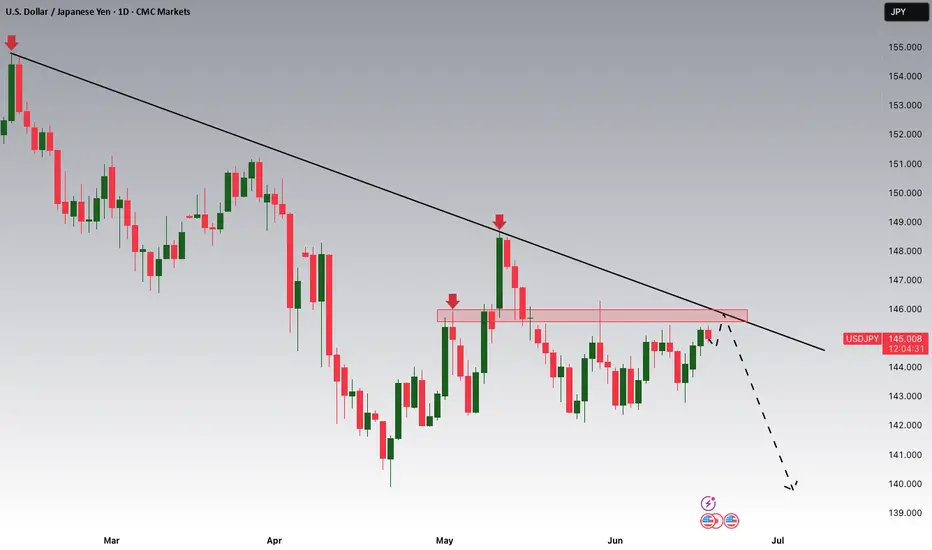
USDJPY Is Going Down! Short!
Please, check our technical outlook for USDJPY.
Time Frame: 12h
Current Trend: Bearish
Sentiment: Overbought (based on 7-period RSI)
Forecast: Bearish
The market is approaching a key horizontal level 145.574.
Considering the today's price action, probabilities will be high to see a movement to 144.101.
P.S
Please, note that an oversold/overbought condition can last for a long time, and therefore being oversold/overbought doesn't mean a price rally will come soon, or at all.
Disclosure: I am part of Trade Nation's Influencer program and receive a monthly fee for using their TradingView charts in my analysis.
Like and subscribe and comment my ideas if you enjoy them!
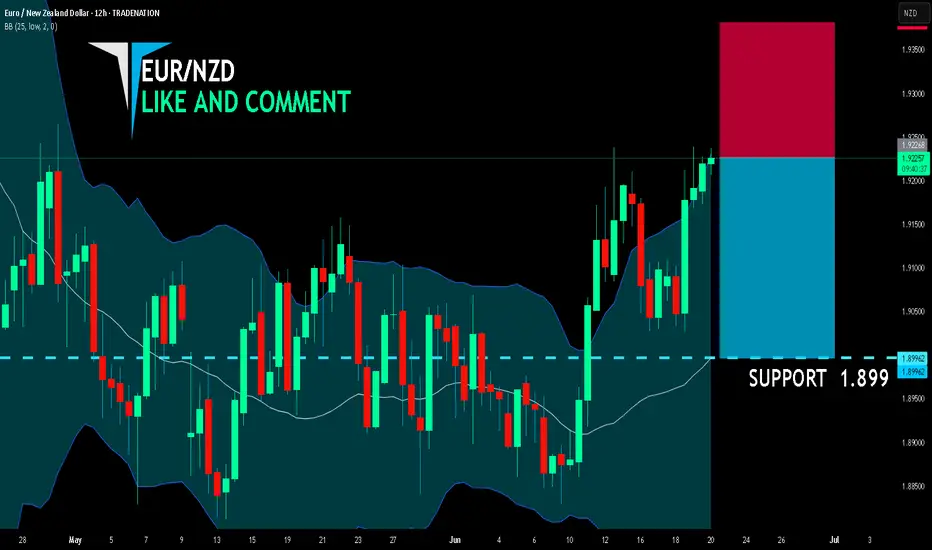
EUR/NZD SENDS CLEAR BEARISH SIGNALS|SHORT
EUR/NZD SIGNAL
Trade Direction: short
Entry Level: 1.922
Target Level: 1.899
Stop Loss: 1.938
RISK PROFILE
Risk level: medium
Suggested risk: 1%
Timeframe: 12h
Disclosure: I am part of Trade Nation's Influencer program and receive a monthly fee for using their TradingView charts in my analysis.
✅LIKE AND COMMENT MY IDEAS✅
EUR/AUD BEARS ARE GAINING STRENGTH|SHORT
Hello, Friends!
EUR/AUD is making a bullish rebound on the 12H TF and is nearing the resistance line above while we are generally bearish biased on the pair due to our previous 1W candle analysis, thus making a trend-following short a good option for us with the target being the 1.762 level.
Disclosure: I am part of Trade Nation's Influencer program and receive a monthly fee for using their TradingView charts in my analysis.
✅LIKE AND COMMENT MY IDEAS✅

EUR/CAD SELLERS WILL DOMINATE THE MARKET|SHORT
Hello, Friends!
The BB upper band is nearby so EUR-CAD is in the overbought territory. Thus, despite the uptrend on the 1W timeframe I think that we will see a bearish reaction from the resistance line above and a move down towards the target at around 1.575.
Disclosure: I am part of Trade Nation's Influencer program and receive a monthly fee for using their TradingView charts in my analysis.
✅LIKE AND COMMENT MY IDEAS✅

UK100 ShortManipulation in the Asian session, looking for price to retest higher supply then push down to the London and Asia low, this is a forecasted entry, entries will be based after 8am M5 candle opening.

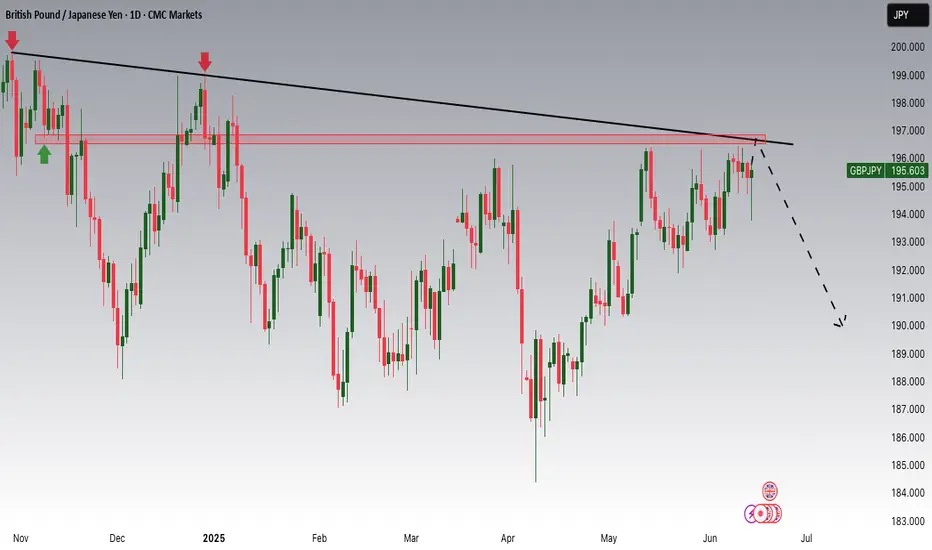
GBPJPY Potential DownsidesHey Traders, in tomorrow's trading session we are monitoring GBPJPY for a selling opportunity around 195.600 zone, GBPJPY is trading in a downtrend and currently is in a correction phase in which in which it is approaching the trend at 195.600 support and resistance area.
Trade safe, Joe.
USDJPY Potential DownsidesHey Traders, in today's trading session we are monitoringUSDJPY for a selling opportunity around 145.700 zone, USDJPY is trading in a downtrend and currently is in a correction phase in which it is approaching the trend at 145.700 support and resistance area.
Trade safe, Joe.
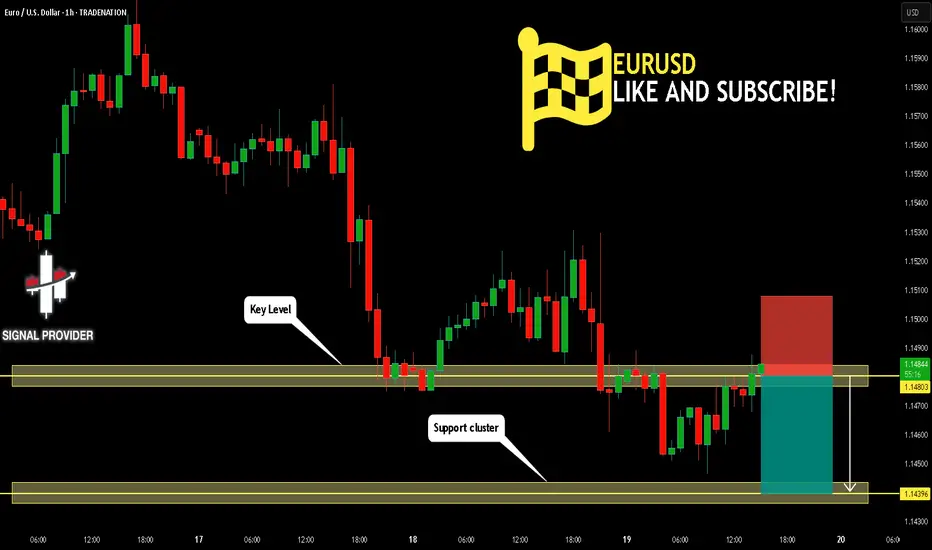
EURUSD Will Go Lower! Sell!
Here is our detailed technical review for EURUSD.
Time Frame: 1h
Current Trend: Bearish
Sentiment: Overbought (based on 7-period RSI)
Forecast: Bearish
The market is trading around a solid horizontal structure 1.148.
Taking into consideration the structure & trend analysis, I believe that the market will reach 1.143 level soon.
P.S
Please, note that an oversold/overbought condition can last for a long time, and therefore being oversold/overbought doesn't mean a price rally will come soon, or at all.
Disclosure: I am part of Trade Nation's Influencer program and receive a monthly fee for using their TradingView charts in my analysis.
Like and subscribe and comment my ideas if you enjoy them!
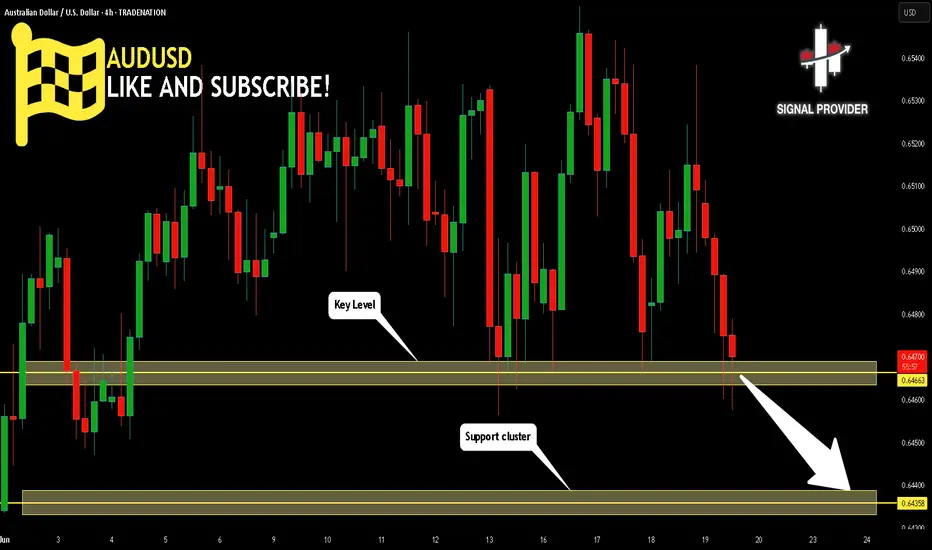
AUDUSD Will Go Down! Short!
Take a look at our analysis for AUDUSD.
Time Frame: 4h
Current Trend: Bearish
Sentiment: Overbought (based on 7-period RSI)
Forecast: Bearish
The market is testing a major horizontal structure 0.646.
Taking into consideration the structure & trend analysis, I believe that the market will reach 0.643 level soon.
P.S
The term oversold refers to a condition where an asset has traded lower in price and has the potential for a price bounce.
Overbought refers to market scenarios where the instrument is traded considerably higher than its fair value. Overvaluation is caused by market sentiments when there is positive news.
Disclosure: I am part of Trade Nation's Influencer program and receive a monthly fee for using their TradingView charts in my analysis.
Like and subscribe and comment my ideas if you enjoy them!
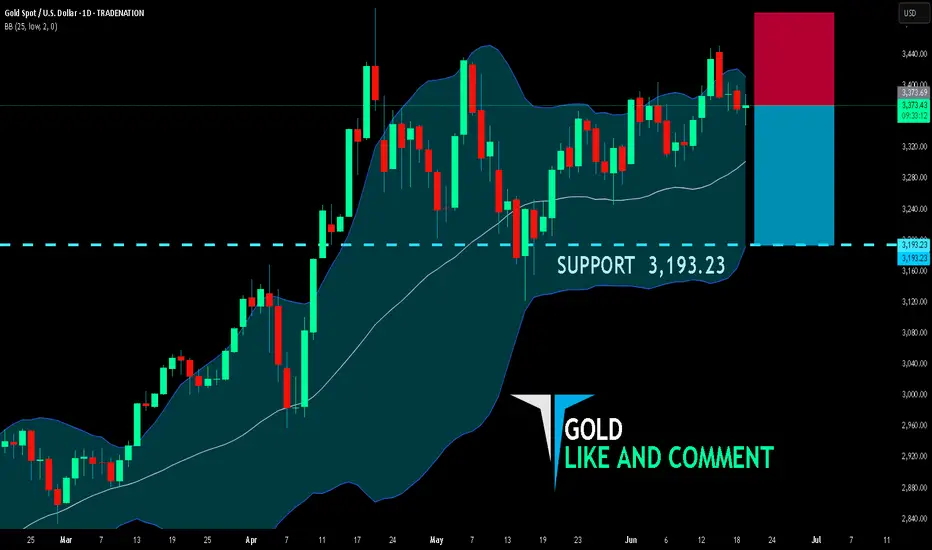
GOLD BEARISH BIAS RIGHT NOW| SHORT
GOLD SIGNAL
Trade Direction: short
Entry Level: 3,373.69
Target Level: 3,193.23
Stop Loss: 3,493.66
RISK PROFILE
Risk level: medium
Suggested risk: 1%
Timeframe: 1D
Disclosure: I am part of Trade Nation's Influencer program and receive a monthly fee for using their TradingView charts in my analysis.
✅LIKE AND COMMENT MY IDEAS✅
EUR/JPY BEST PLACE TO SELL FROM|SHORT
EUR/JPY SIGNAL
Trade Direction: short
Entry Level: 167.194
Target Level: 165.108
Stop Loss: 168.580
RISK PROFILE
Risk level: medium
Suggested risk: 1%
Timeframe: 17h
Disclosure: I am part of Trade Nation's Influencer program and receive a monthly fee for using their TradingView charts in my analysis.
✅LIKE AND COMMENT MY IDEAS✅

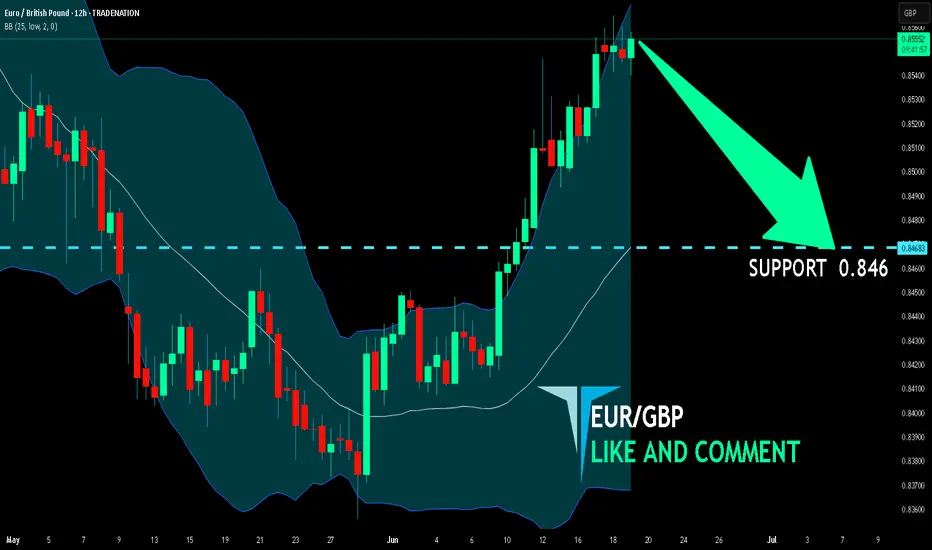
EUR/GBP BEARS ARE STRONG HERE|SHORT
Hello, Friends!
Bearish trend on EUR/GBP, defined by the red colour of the last week candle combined with the fact the pair is overbought based on the BB upper band proximity, makes me expect a bearish rebound from the resistance line above and a retest of the local target below at 0.846.
Disclosure: I am part of Trade Nation's Influencer program and receive a monthly fee for using their TradingView charts in my analysis.
✅LIKE AND COMMENT MY IDEAS✅
USD/CAD SHORT FROM RESISTANCE
Hello, Friends!
USD/CAD is trending down which is evident from the red colour of the previous weekly candle. However, the price has locally surged into the overbought territory. Which can be told from its proximity to the BB upper band. Which presents a beautiful trend following opportunity for a short trade from the resistance line above towards the demand level of 1.361.
Disclosure: I am part of Trade Nation's Influencer program and receive a monthly fee for using their TradingView charts in my analysis.
✅LIKE AND COMMENT MY IDEAS✅

AUDCAD SHORT FORECAST Q2 W25 D19 Y25AUDCAD SHORT FORECAST Q2 W25 D19 Y25
Professional Risk Managers👋
Welcome back to another FRGNT chart update📈
Diving into some Forex setups using predominantly higher time frame order blocks alongside intraday confirmation breaks of structure.
💡Here are some trade confluences📝
✅Weekly 50 EMA
✅Weekly order block rejection
✅Daily order block rejection
✅15’ order block identification
🔑 Remember, to participate in trading comes always with a degree of risk, therefore as professional risk managers it remains vital that we stick to our risk management plan as well as our trading strategies.
📈The rest, we leave to the balance of probabilities.
💡Fail to plan. Plan to fail.
🏆It has always been that simple.
❤️Good luck with your trading journey, I shall see you at the very top.
🎯Trade consistent, FRGNT X
