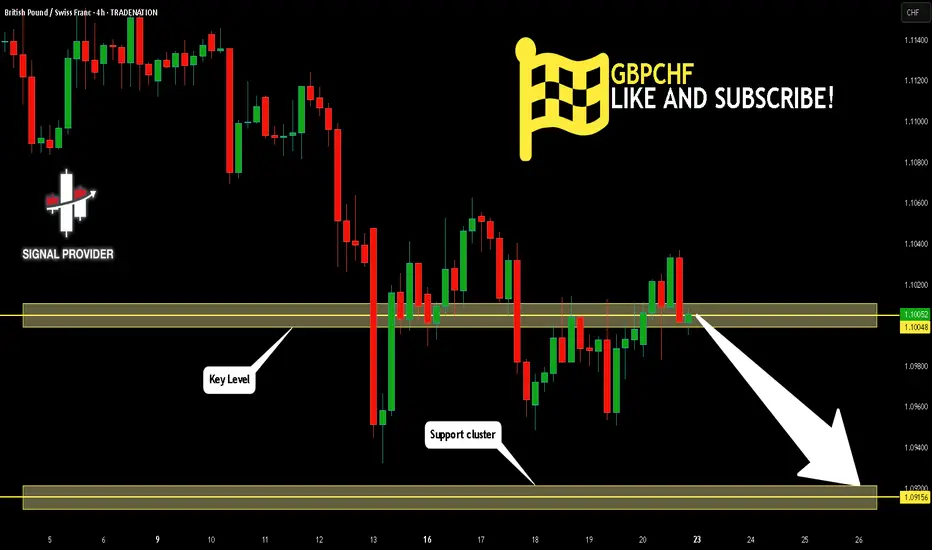
GBPCHF Is Bearish! Sell!
Here is our detailed technical review for GBPCHF.
Time Frame: 4h
Current Trend: Bearish
Sentiment: Overbought (based on 7-period RSI)
Forecast: Bearish
The market is trading around a solid horizontal structure 1.100.
The above observations make me that the market will inevitably achieve 1.091 level.
P.S
We determine oversold/overbought condition with RSI indicator.
When it drops below 30 - the market is considered to be oversold.
When it bounces above 70 - the market is considered to be overbought.
Disclosure: I am part of Trade Nation's Influencer program and receive a monthly fee for using their TradingView charts in my analysis.
Like and subscribe and comment my ideas if you enjoy them!
SELL
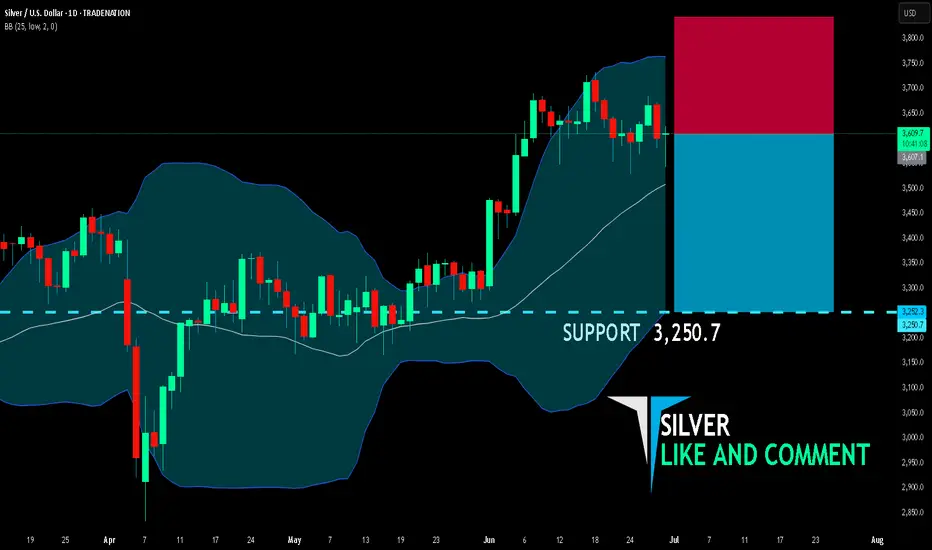
SILVER BEARS ARE STRONG HERE|SHORT
SILVER SIGNAL
Trade Direction: short
Entry Level: 3,607.1
Target Level: 3,250.7
Stop Loss: 3,843.0
RISK PROFILE
Risk level: medium
Suggested risk: 1%
Timeframe: 1D
Disclosure: I am part of Trade Nation's Influencer program and receive a monthly fee for using their TradingView charts in my analysis.
✅LIKE AND COMMENT MY IDEAS✅
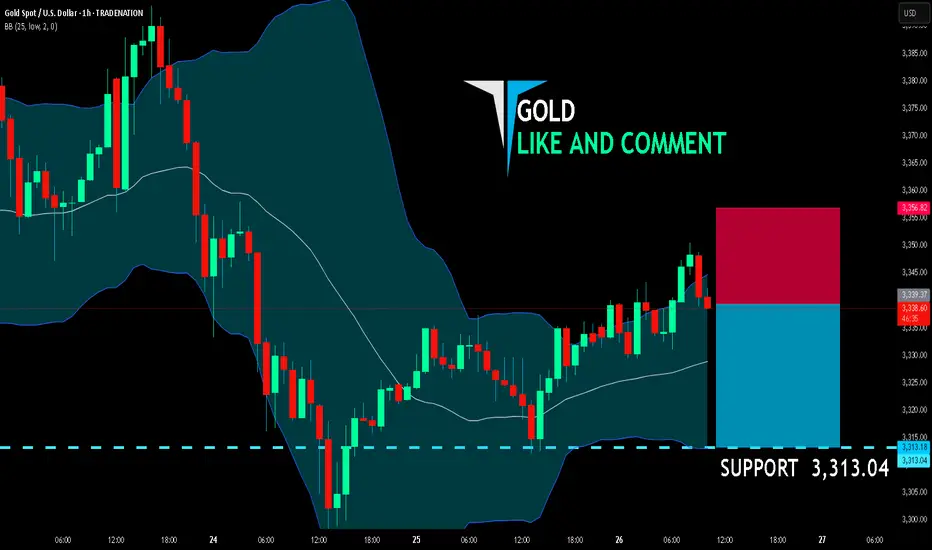
GOLD SELLERS WILL DOMINATE THE MARKET|SHORT
GOLD SIGNAL
Trade Direction: short
Entry Level: 3,339.37
Target Level: 3,313.04
Stop Loss: 3,356.82
RISK PROFILE
Risk level: medium
Suggested risk: 1%
Timeframe: 1h
Disclosure: I am part of Trade Nation's Influencer program and receive a monthly fee for using their TradingView charts in my analysis.
✅LIKE AND COMMENT MY IDEAS✅
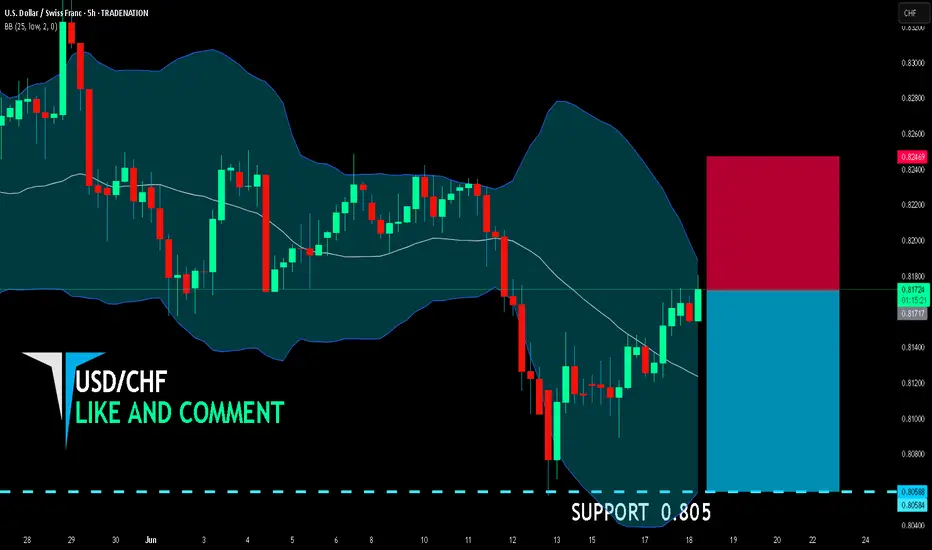
USD/CHF SENDS CLEAR BEARISH SIGNALS|SHORT
USD/CHF SIGNAL
Trade Direction: short
Entry Level: 0.817
Target Level: 0.805
Stop Loss: 0.824
RISK PROFILE
Risk level: medium
Suggested risk: 1%
Timeframe: 5h
Disclosure: I am part of Trade Nation's Influencer program and receive a monthly fee for using their TradingView charts in my analysis.
✅LIKE AND COMMENT MY IDEAS✅
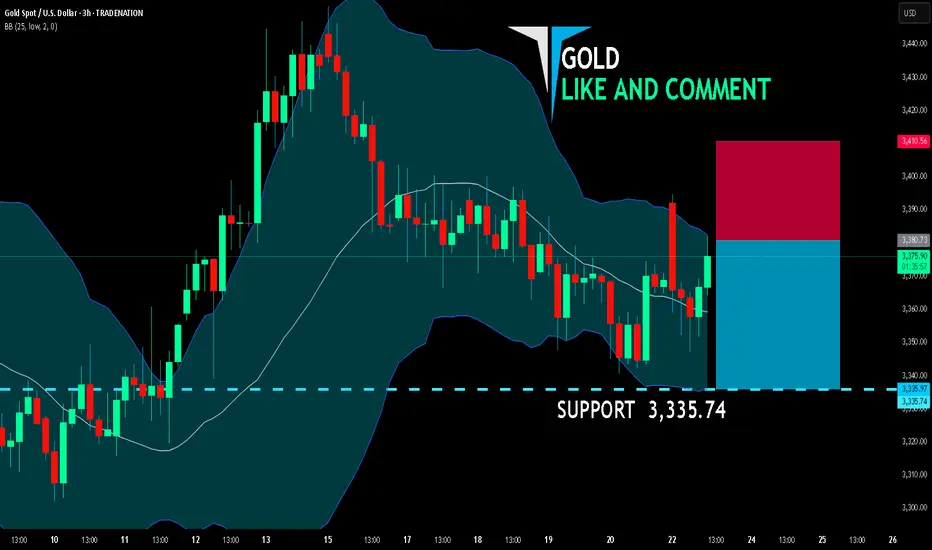
GOLD SHORT FROM RESISTANCE
GOLD SIGNAL
Trade Direction: long
Entry Level: 3,380.73
Target Level: 3,335.74
Stop Loss: 3,410.56
RISK PROFILE
Risk level: medium
Suggested risk: 1%
Timeframe: 3h
Disclosure: I am part of Trade Nation's Influencer program and receive a monthly fee for using their TradingView charts in my analysis.
✅LIKE AND COMMENT MY IDEAS✅
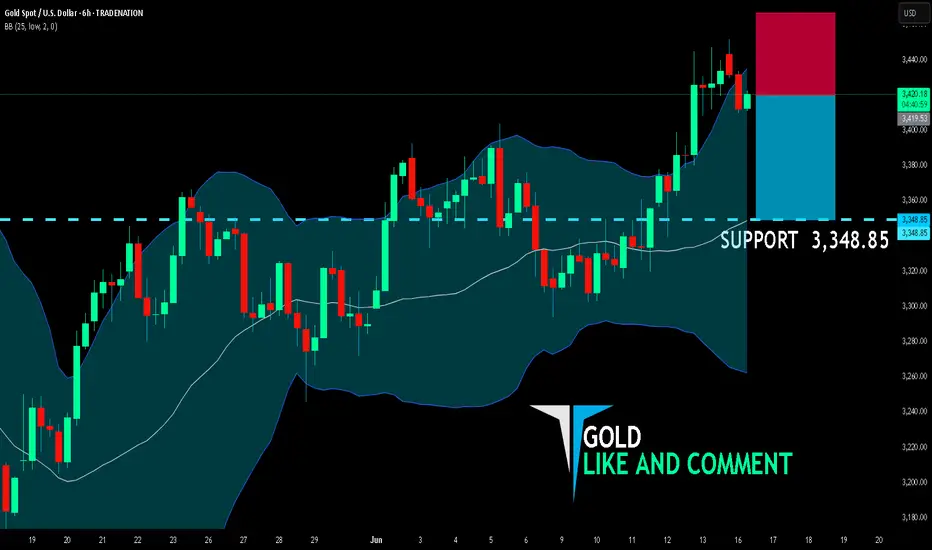
GOLD BEARS WILL DOMINATE THE MARKET|SHORT
GOLD SIGNAL
Trade Direction: short
Entry Level: 3,419.53
Target Level: 3,348.85
Stop Loss: 3,466.65
RISK PROFILE
Risk level: medium
Suggested risk: 1%
Timeframe: 6h
Disclosure: I am part of Trade Nation's Influencer program and receive a monthly fee for using their TradingView charts in my analysis.
✅LIKE AND COMMENT MY IDEAS✅
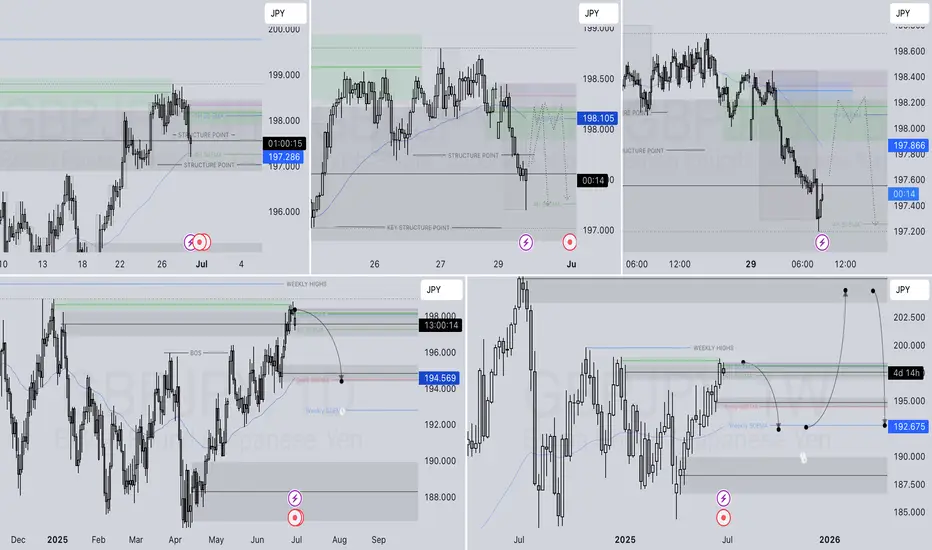
GBPJPY SHORT DAILY FORECAST Q3 D30 W27 Y25GBPJPY SHORT DAILY FORECAST Q3 D30 W27 Y25
Professional Risk Managers👋
Welcome back to another FRGNT chart update📈
Diving into some Forex setups using predominantly higher time frame order blocks alongside confirmation breaks of structure.
Let’s see what price action is telling us today! 👀
💡Here are some trade confluences📝
✅Daily Order block identified
✅4H Order Block identified
✅1H Order Block identified
🔑 Remember, to participate in trading comes always with a degree of risk, therefore as professional risk managers it remains vital that we stick to our risk management plan as well as our trading strategies.
📈The rest, we leave to the balance of probabilities.
💡Fail to plan. Plan to fail.
🏆It has always been that simple.
❤️Good luck with your trading journey, I shall see you at the very top.
🎯Trade consistent, FRGNT X
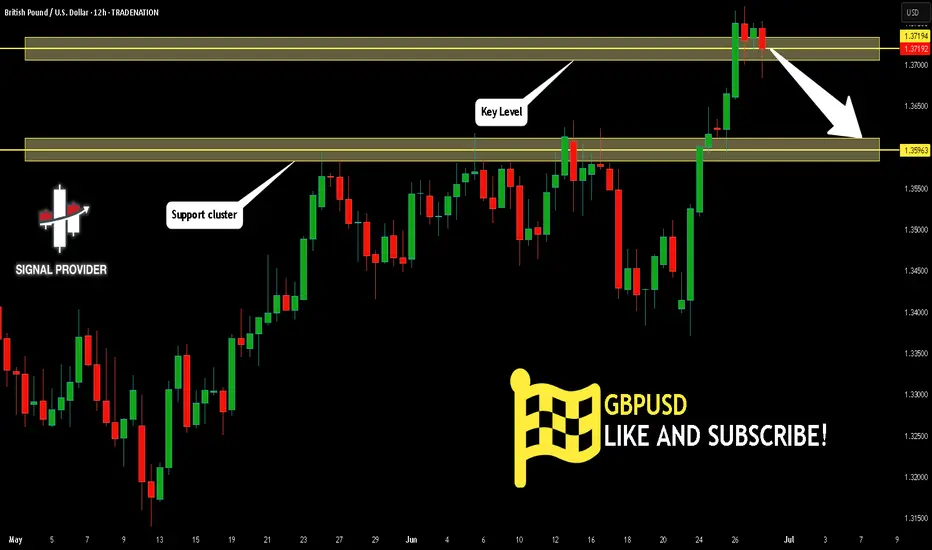
GBPUSD Will Move Lower! Short!
Please, check our technical outlook for GBPUSD.
Time Frame: 12h
Current Trend: Bearish
Sentiment: Overbought (based on 7-period RSI)
Forecast: Bearish
The market is approaching a key horizontal level 1.371.
Considering the today's price action, probabilities will be high to see a movement to 1.359.
P.S
We determine oversold/overbought condition with RSI indicator.
When it drops below 30 - the market is considered to be oversold.
When it bounces above 70 - the market is considered to be overbought.
Disclosure: I am part of Trade Nation's Influencer program and receive a monthly fee for using their TradingView charts in my analysis.
Like and subscribe and comment my ideas if you enjoy them!
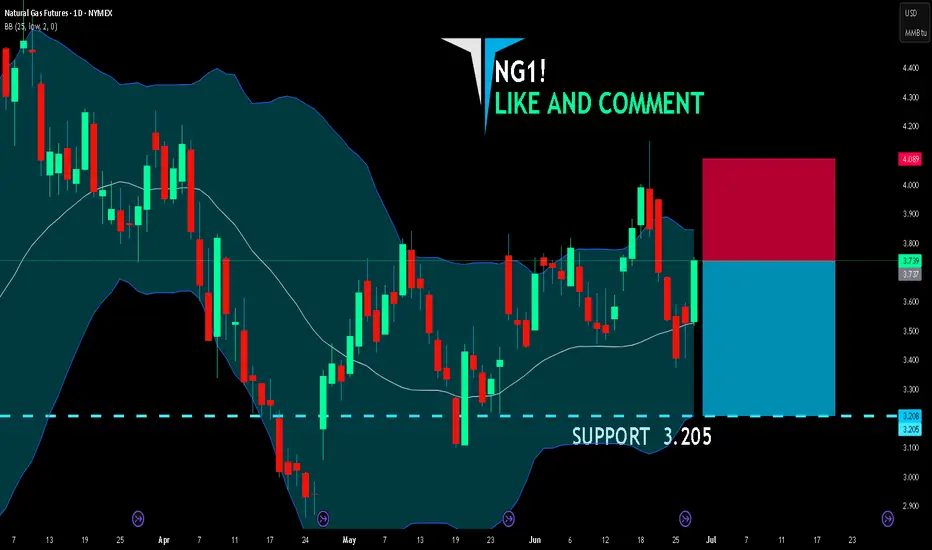
NG1! BEARS ARE GAINING STRENGTH|SHORT
NG1! SIGNAL
Trade Direction: short
Entry Level: 3.737
Target Level: 3.205
Stop Loss: 4.089
RISK PROFILE
Risk level: medium
Suggested risk: 1%
Timeframe: 1D
Disclosure: I am part of Trade Nation's Influencer program and receive a monthly fee for using their TradingView charts in my analysis.
✅LIKE AND COMMENT MY IDEAS✅
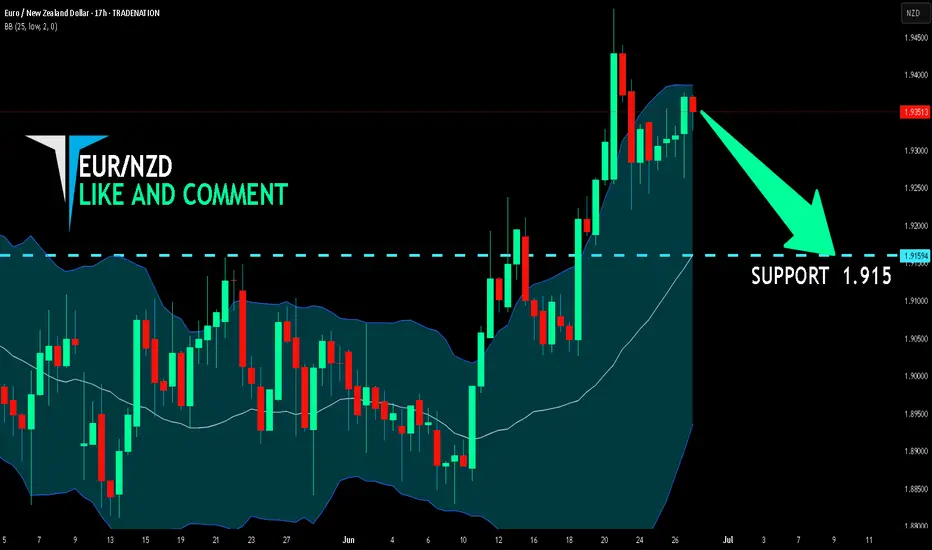
EUR/NZD SELLERS WILL DOMINATE THE MARKET|SHORT
Hello, Friends!
EUR/NZD pair is trading in a local uptrend which we know by looking at the previous 1W candle which is green. On the 17H timeframe the pair is going up too. The pair is overbought because the price is close to the upper band of the BB indicator. So we are looking to sell the pair with the upper BB line acting as resistance. The next target is 1.915 area.
Disclosure: I am part of Trade Nation's Influencer program and receive a monthly fee for using their TradingView charts in my analysis.
✅LIKE AND COMMENT MY IDEAS✅
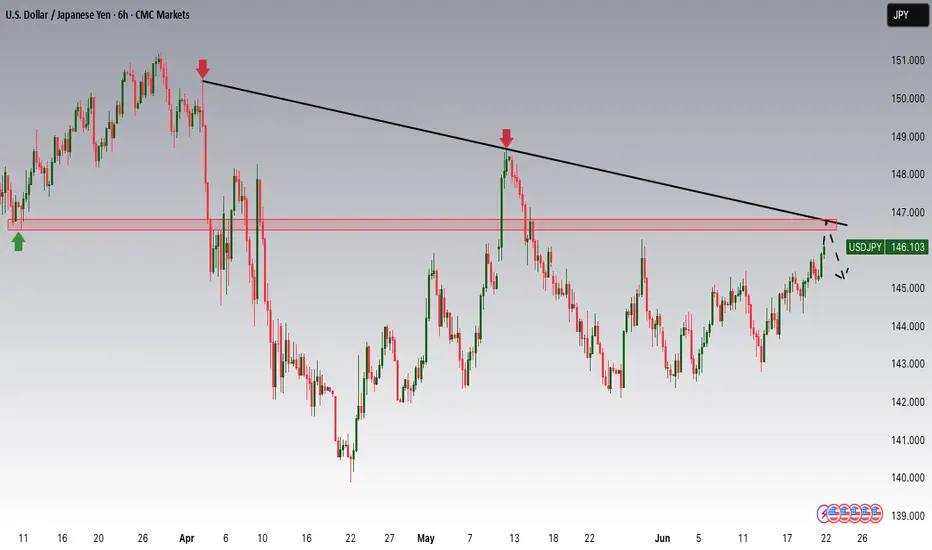
USDJPY Potential DownsidesHey Traders, in today's trading session we are monitoring USDJPY for a selling opportunity around 146.700 zone, USDJPY is trading in a downtrend and currently is in a correction phase in which it is approaching the trend at 146.700 support and resistance area.
Trade safe, Joe.
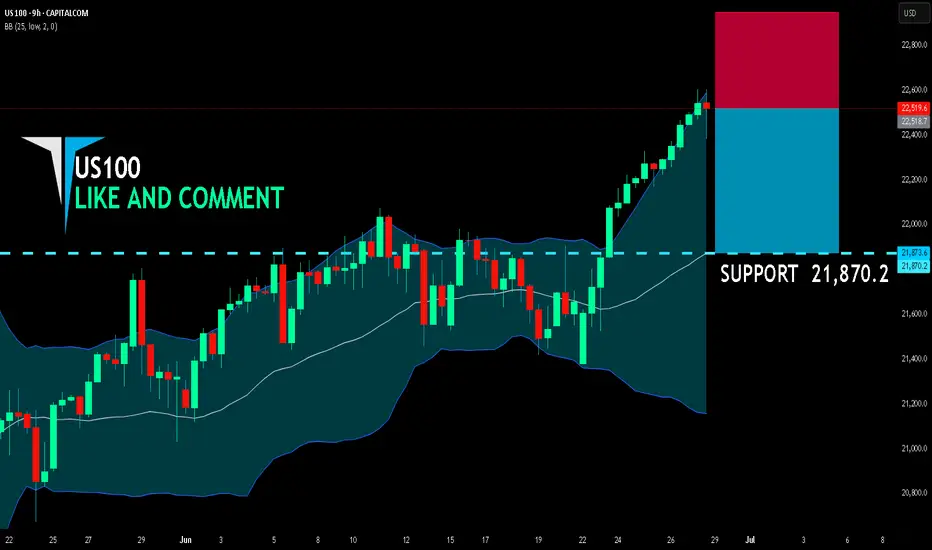
US100 BEARISH BIAS RIGHT NOW| SHORT
US100 SIGNAL
Trade Direction: short
Entry Level: 22,518.7
Target Level: 21,870.2
Stop Loss: 22,949.8
RISK PROFILE
Risk level: medium
Suggested risk: 1%
Timeframe: 9h
Disclosure: I am part of Trade Nation's Influencer program and receive a monthly fee for using their TradingView charts in my analysis.
✅LIKE AND COMMENT MY IDEAS✅
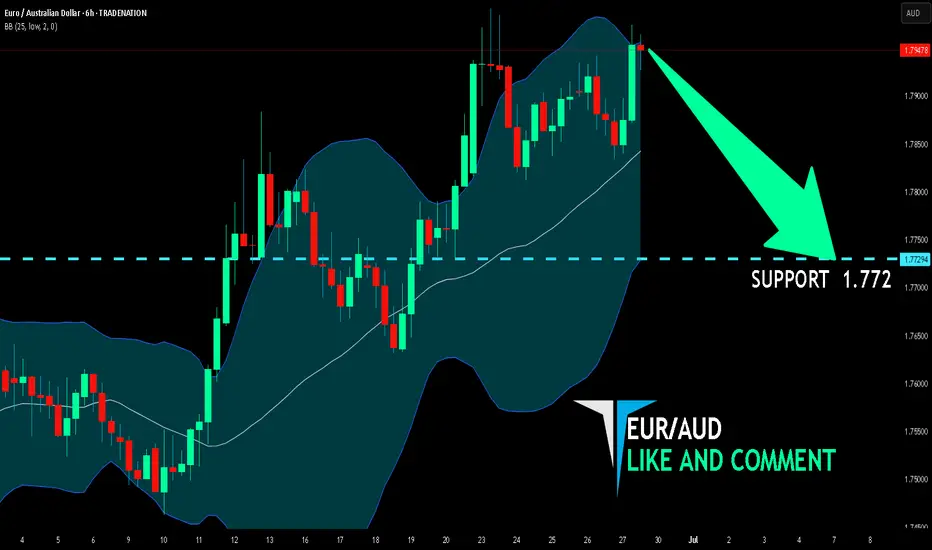
EUR/AUD BEST PLACE TO SELL FROM|SHORT
Hello, Friends!
We are going short on the EUR/AUD with the target of 1.772 level, because the pair is overbought and will soon hit the resistance line above. We deduced the overbought condition from the price being near to the upper BB band. However, we should use low risk here because the 1W TF is green and gives us a counter-signal.
Disclosure: I am part of Trade Nation's Influencer program and receive a monthly fee for using their TradingView charts in my analysis.
✅LIKE AND COMMENT MY IDEAS✅
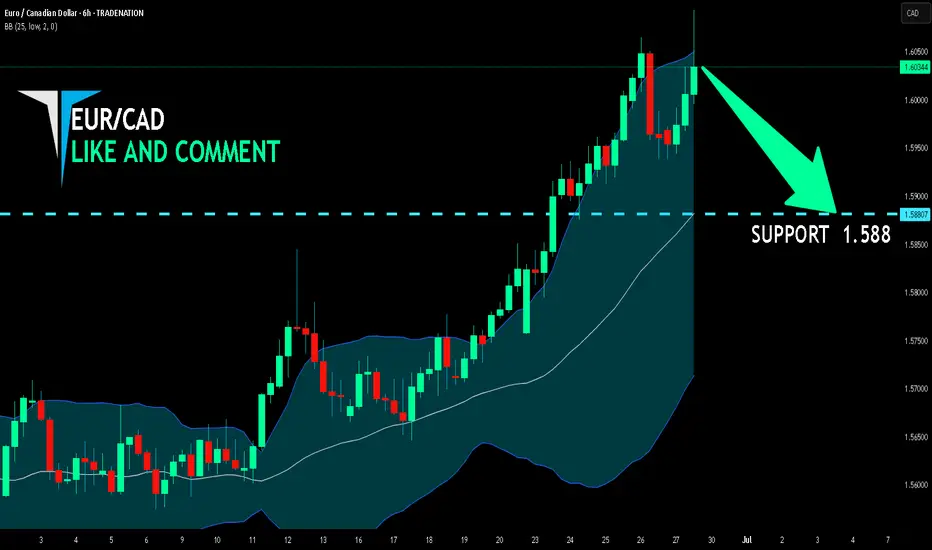
EUR/CAD BEARS ARE STRONG HERE|SHORT
Hello, Friends!
We are now examining the EUR/CAD pair and we can see that the pair is going up locally while also being in a uptrend on the 1W TF. But there is also a powerful signal from the BB upper band being nearby, indicating that the pair is overbought so we can go short from the resistance line above and a target at 1.588 level.
Disclosure: I am part of Trade Nation's Influencer program and receive a monthly fee for using their TradingView charts in my analysis.
✅LIKE AND COMMENT MY IDEAS✅
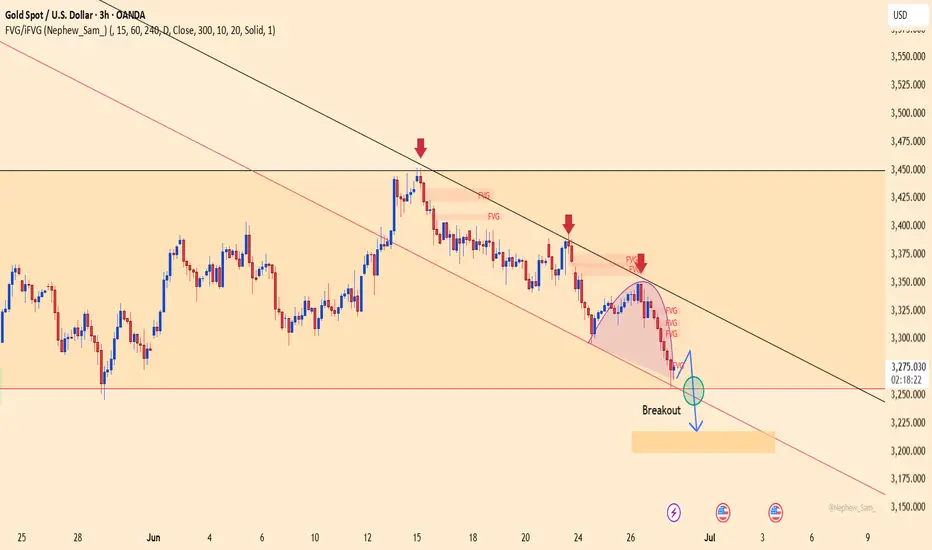
XAUUSD – Bearish Trend Continues After Channel BreakoutGold is currently moving within a clearly defined descending channel, with successive lower highs confirmed at each retest of the dynamic resistance line. Following news of a temporary ceasefire between Iran and Israel, gold's safe-haven appeal weakened, triggering strong selling pressure that drove prices sharply lower, breaking below the key $3,260 support.
A rounded top pattern and a clean breakout beneath the channel indicate that sellers are in control. The next downside target lies around the $3,218 confluence zone, where a temporary bullish reaction may occur. The nearest resistance on a pullback is around $3,349 – aligned with the broken upper channel boundary and a dense FVG zone.
If the price fails to quickly reclaim the broken channel, the bearish trend is likely to persist in the short term. Traders should closely monitor price action near the $3,218 zone for potential entries or reversals.
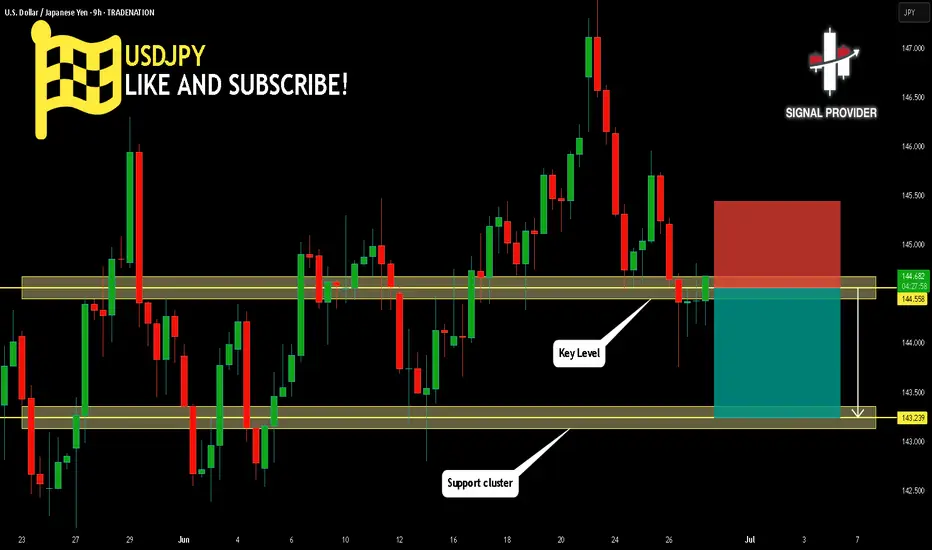
USDJPY Will Go Lower From Resistance! Sell!
Take a look at our analysis for USDJPY.
Time Frame: 9h
Current Trend: Bearish
Sentiment: Overbought (based on 7-period RSI)
Forecast: Bearish
The market is testing a major horizontal structure 144.558.
Taking into consideration the structure & trend analysis, I believe that the market will reach 143.239 level soon.
P.S
Overbought describes a period of time where there has been a significant and consistent upward move in price over a period of time without much pullback.
Disclosure: I am part of Trade Nation's Influencer program and receive a monthly fee for using their TradingView charts in my analysis.
Like and subscribe and comment my ideas if you enjoy them!
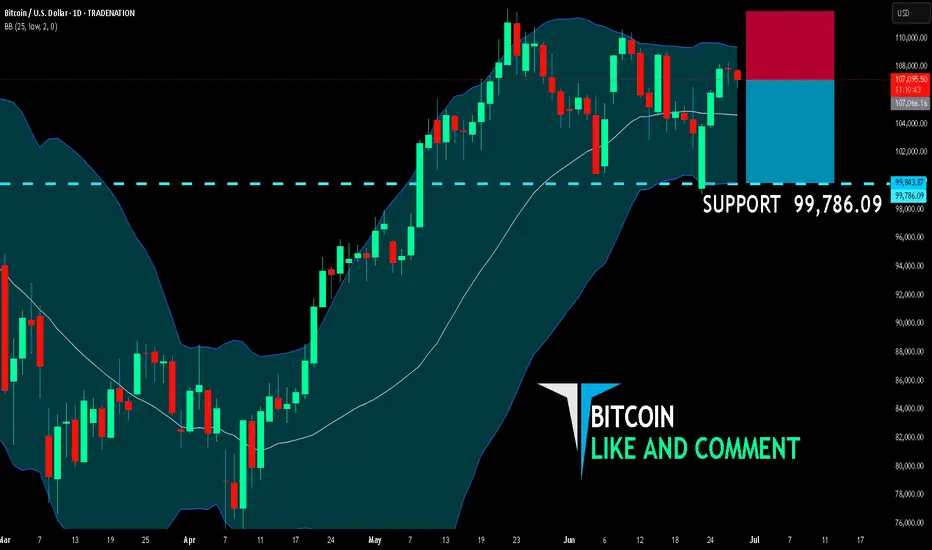
BITCOIN SHORT FROM RESISTANCE
BITCOIN SIGNAL
Trade Direction: short
Entry Level: 107,066.16
Target Level: 99,786.09
Stop Loss: 111,861.76
RISK PROFILE
Risk level: medium
Suggested risk: 1%
Timeframe: 1D
Disclosure: I am part of Trade Nation's Influencer program and receive a monthly fee for using their TradingView charts in my analysis.
LIKE AND COMMENT MY IDEAS
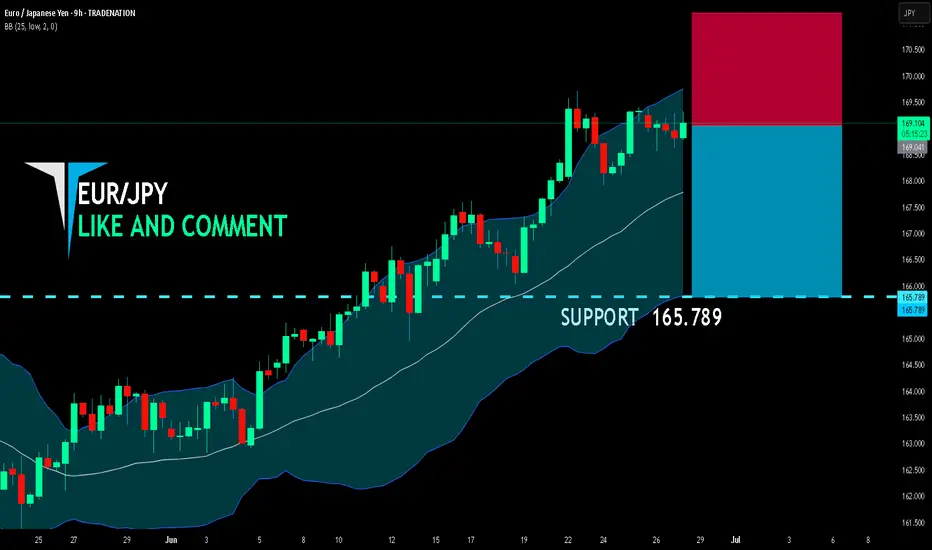
EUR/JPY BEARS WILL DOMINATE THE MARKET|SHORT
EUR/JPY SIGNAL
Trade Direction: short
Entry Level: 169.041
Target Level: 165.789
Stop Loss: 171.204
RISK PROFILE
Risk level: medium
Suggested risk: 1%
Timeframe: 9h
Disclosure: I am part of Trade Nation's Influencer program and receive a monthly fee for using their TradingView charts in my analysis.
LIKE AND COMMENT MY IDEAS
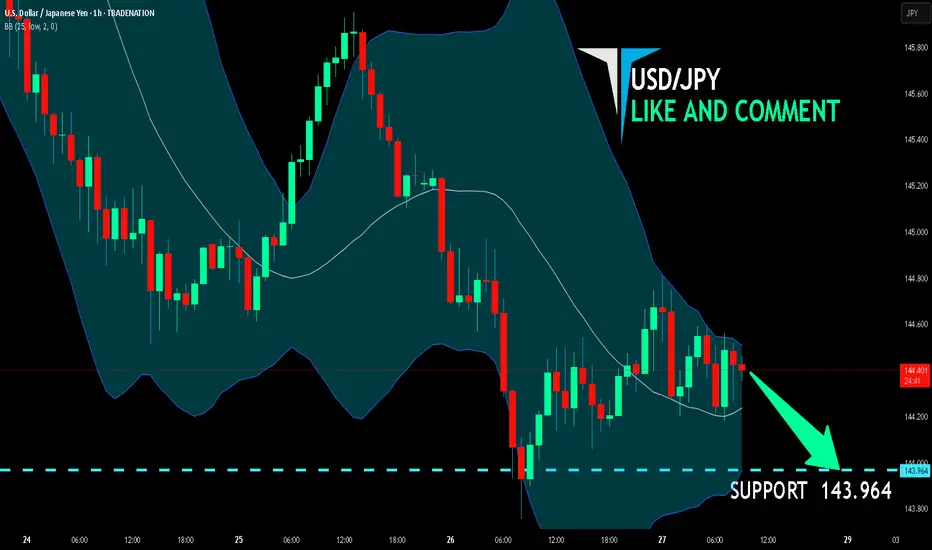
USD/JPY BEARS ARE GAINING STRENGTH|SHORT
Hello, Friends!
Bearish trend on USD/JPY, defined by the red colour of the last week candle combined with the fact the pair is overbought based on the BB upper band proximity, makes me expect a bearish rebound from the resistance line above and a retest of the local target below at 143.964.
Disclosure: I am part of Trade Nation's Influencer program and receive a monthly fee for using their TradingView charts in my analysis.
LIKE AND COMMENT MY IDEAS
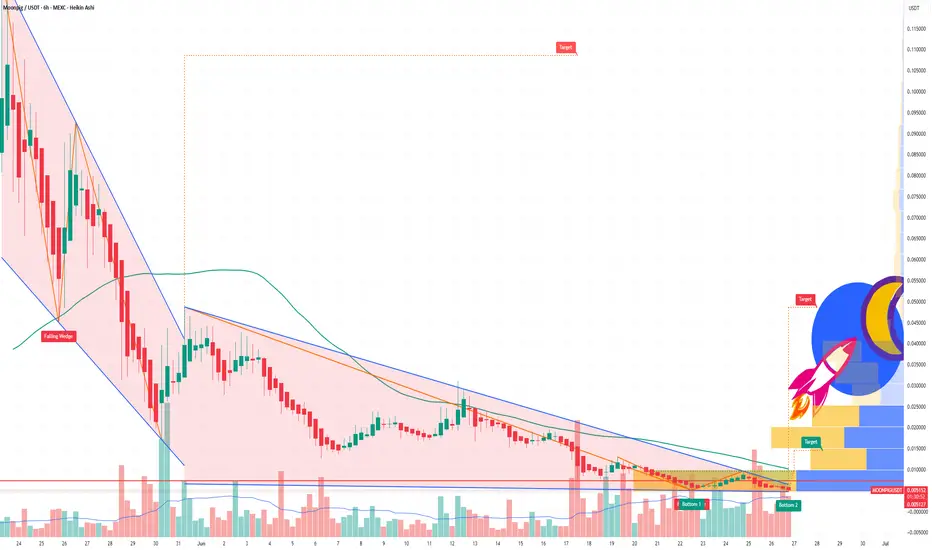
MOONPIG - Solana Meme Coin Ready to Rocket in the Next Bull RunTechnical Analysis: Bullish Signals Flashing Bright:
The MOONPIG/USDT chart is painting a bullish picture. After a sharp retracement from its all-time high near a $125M market cap, the token has found solid support around $0.0045 and is now trading at $0.0052, showing signs of a reversal. Here’s what the charts tell us:
Breakout Momentum: On the 6-hour chart, $MOONPIG recently broke above a key downtrend line, signaling a shift from bearish to bullish momentum. A potential double bottom pattern suggests a continuation toward $0.008 or higher.
Support and Resistance: The $0.0045 level has held as strong support, with resistance looming near $0.0075 (a recent high). A clean break above $0.0075 could open the door to $0.01 or beyond, aligning with the 1.618 Fibonacci extension from the recent swing low.
With Bitcoin rallying and altcoins showing signs of life, $MOONPIG’s technical setup screams opportunity for traders eyeing a breakout.
Fundamentals:
Community Power: With over 18,000 holders as of early June 2025, $MOONPIG boasts a fiercely loyal community. Unlike many meme coins reliant on paid shills, its growth is organic, driven by retail investors who love its “normie-friendly” branding. Posts on X highlight strong morale, with users like JamesWynnReal calling it a “raging bull flag” poised for a $50M–$100M market cap.
Exchange Listings: Recent listings on HTX Global, MEXC, and LBank have boosted liquidity and visibility, with more exchanges reportedly in talks. These listings are a catalyst for retail FOMO, as seen in the $7M+ on-chain trading volume.
Solana’s Hot Streak: Solana’s fast, low-cost blockchain is the perfect home for meme coins like $MOONPIG. With Solana’s ecosystem thriving and retail interest in tokens like $POPCAT and SEED_WANDERIN_JIMZIP900:WIF soaring, $MOONPIG is well-positioned to ride the wave of altseason capital inflows.
Market Timing: As Bitcoin nears new highs and market sentiment turns bullish, low-cap meme coins historically see explosive gains.
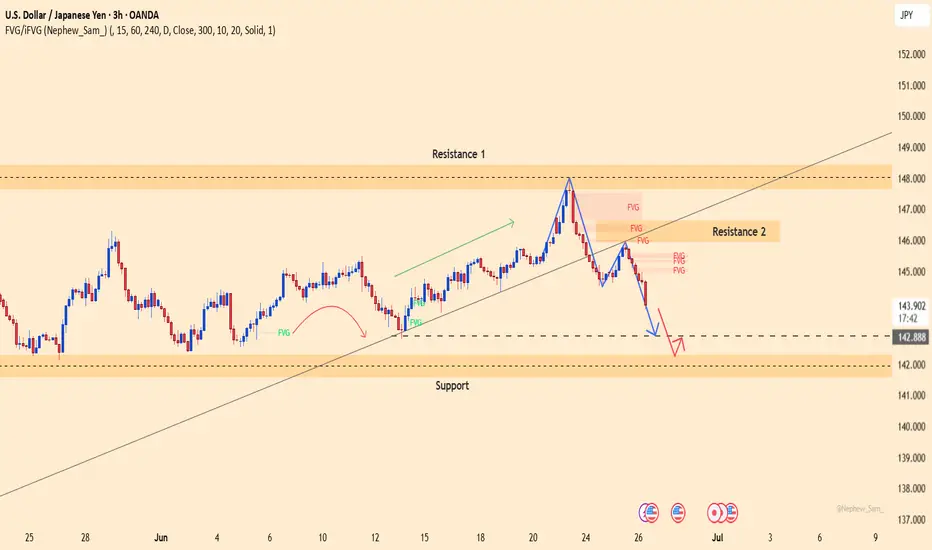
USDJPY – Uptrend Still Intact, But Waiting for a BounceUSDJPY is currently pulling back toward the key support zone at 142.244 after being rejected from the 148.000 resistance area. This recent drop reflects strong selling pressure from the dense FVG zones near Resistance 2.
However, the overall structure remains bullish, with a series of higher highs and higher lows still intact. The current support zone is crucial—if it holds, USDJPY could rebound toward 145.800 and potentially retest the 148.000 level.
On the news front:
– A fragile ceasefire between Iran and Israel has improved global risk sentiment, reducing demand for USD as a safe haven.
– The Bank of Japan kept interest rates unchanged and signaled caution in reducing bond purchases—supporting the yen, but not enough to reverse the dollar's edge.
– The wide interest rate differential still favors the USD.
Strategy: Watch for bullish confirmation at 142.244. If buyers step in clearly, it may present a long opportunity in line with the dominant uptrend.
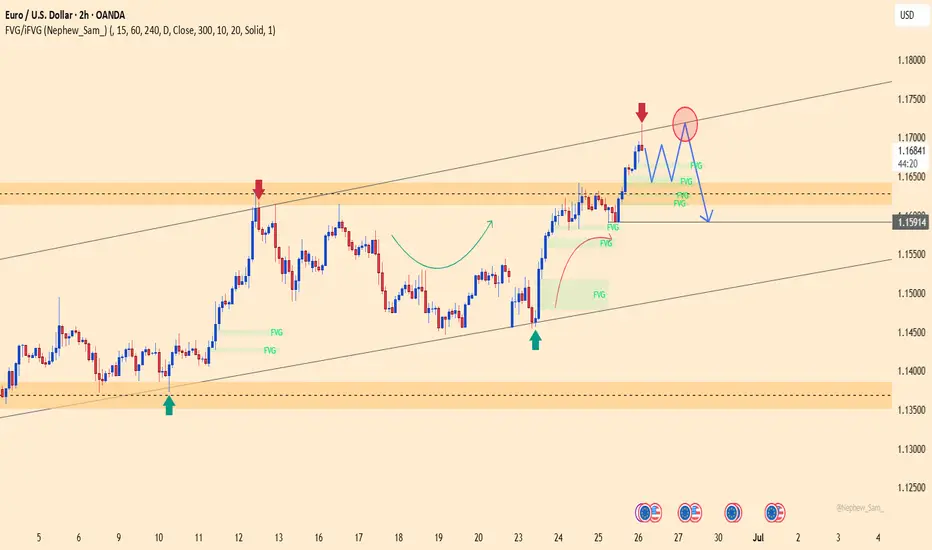
EURUSD – Short-Term Top Signal, Sellers Getting ReadyEURUSD has reached the upper boundary of the ascending channel around 1.17190 and immediately faced selling pressure. This zone previously acted as a strong reversal area, and with a rejection candlestick and a forming FVG, the risk of a downward correction is increasing.
Currently, the price is moving sideways just below the high, forming lower highs — suggesting a possible distribution pattern before breaking the bullish structure. If price breaks below the FVG zone near 1.165–1.166, the move could extend toward the technical target at 1.15900 — aligning with the channel bottom and a historical liquidity area.
Recent fundamental drivers:
U.S. economic data remains strong (Jobless Claims, Core PCE) → supports USD strength
The ECB remains cautious and hasn’t committed to further rate hikes → slightly weakens the euro
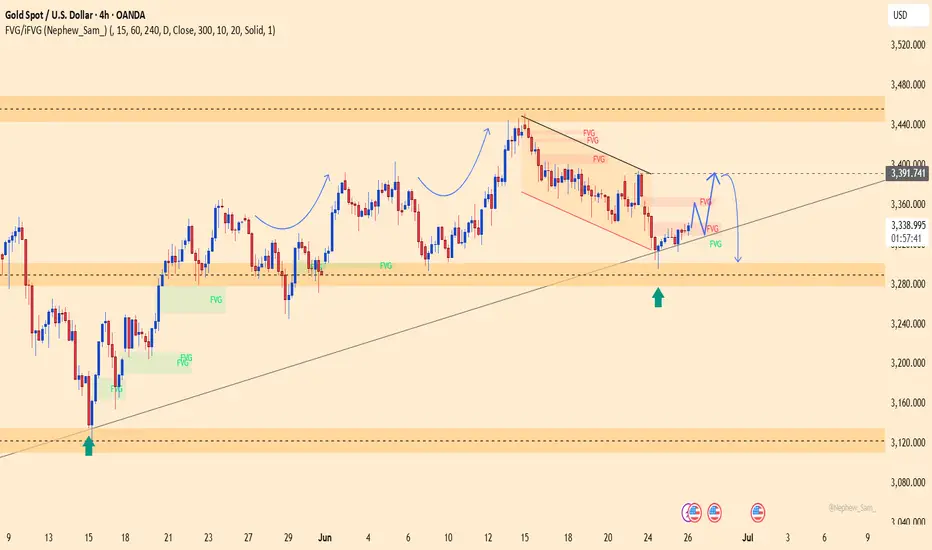
Is Gold Setting a Trap for Traders?Gold is currently retesting the FVG zone around 3,392 after breaking below a key trendline — a classic sell-trigger area if price gets rejected.
Bearish momentum is supported by:
U.S. jobless claims: 244K < 245K forecast → Stronger USD
Iran–Israel ceasefire → Reduced demand for safe-haven assets
If price fails to break above 3,392, the next downside target is the 3,299 support zone.
Trade idea: Watch for a rejection around 3,390–3,392 to consider short positions.
Bearish bias remains valid as long as price stays below 3,392.