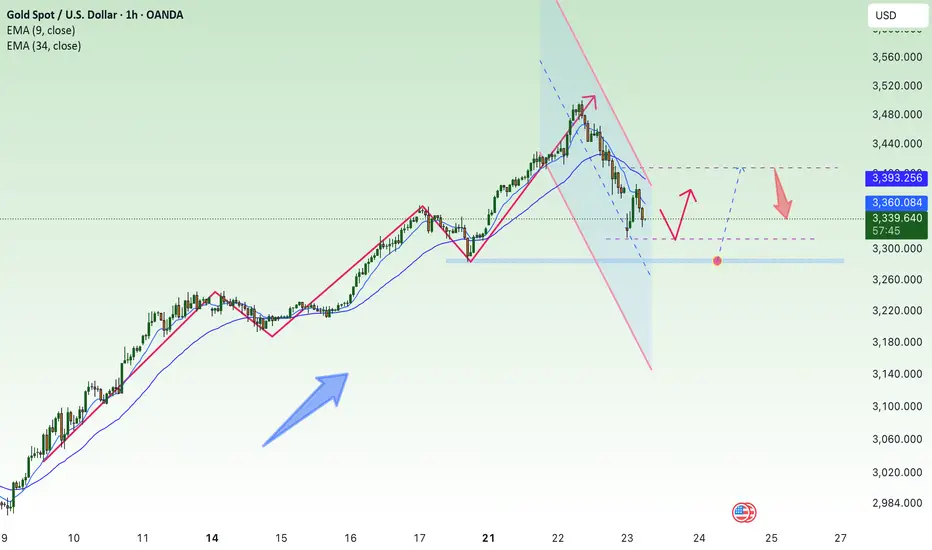
Gold price moves sideways above 3320⭐️GOLDEN INFORMATION:
Gold prices advanced during the North American session, gaining 0.78%, supported by headlines suggesting US President Donald Trump had discussed firing Federal Reserve (Fed) Chair Jerome Powell. Although Trump later denied the reports, calling it “highly unlikely” unless fraud was involved, the speculation lifted demand for the precious metal. At the time of writing, XAU/USD is trading around $3,348, after briefly reaching a daily high of $3,377 following Trump-related headlines.
According to Bloomberg, Trump floated the idea during a meeting with GOP lawmakers focused on cryptocurrency regulation, noting that most attendees reportedly supported Powell’s removal.
Beyond political drama, softer US economic data and ongoing geopolitical tensions also underpinned gold’s gains. The latest US Producer Price Index (PPI) came in below expectations but remained above the Fed’s 2% inflation target. Meanwhile, Israeli airstrikes in Syria helped limit downside pressure on bullion, though Gold’s upside remained capped below the $3,400 level following the recent US consumer inflation report.
⭐️Personal comments NOVA:
Gold price moves sideways in the price range of 3306 - 3380, accumulating and waiting for information on US tariffs and interest rates
⭐️SET UP GOLD PRICE:
🔥SELL GOLD zone: 3381- 3379 SL 3386
TP1: $3370
TP2: $3360
TP3: $3350
🔥BUY GOLD zone: $3306-$3304 SL $3299
TP1: $3318
TP2: $3330
TP3: $3343
⭐️Technical analysis:
Based on technical indicators EMA 34, EMA89 and support resistance areas to set up a reasonable SELL order.
⭐️NOTE:
Note: Nova wishes traders to manage their capital well
- take the number of lots that match your capital
- Takeprofit equal to 4-6% of capital account
- Stoplose equal to 2-3% of capital account
Selloff
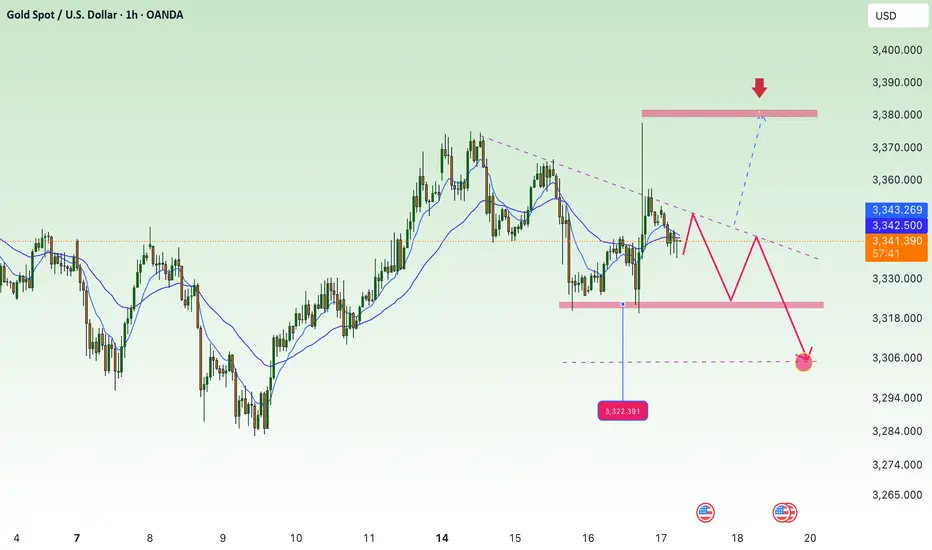
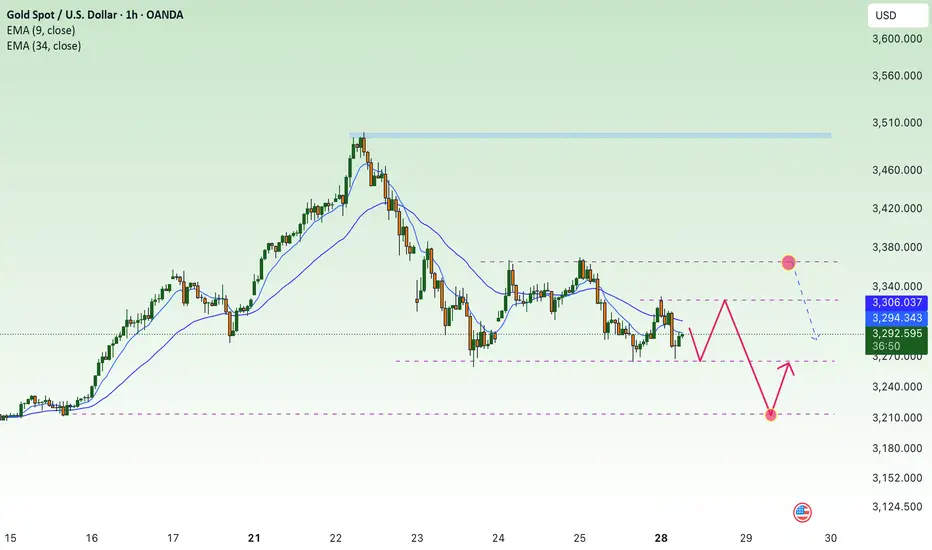
downtrend, back to 3300 gold price⭐️GOLDEN INFORMATION:
Gold prices (XAU/USD) inch higher in early Asian trading on Wednesday, recovering part of Tuesday’s sharp decline to multi-day lows, though follow-through buying remains limited. Lingering uncertainty surrounding US President Donald Trump’s trade tariffs, combined with expectations that the Federal Reserve (Fed) will maintain elevated interest rates, continues to dampen risk appetite. This weaker market mood is providing modest support to the safe-haven metal.
Meanwhile, the US Dollar (USD) eases slightly after Tuesday’s surge to its highest level since late June, which is helping gold stabilize. However, persistent speculation that the Fed may delay rate cuts, following a slight uptick in US inflation, continues to bolster the greenback and could cap further gains in gold. Traders remain cautious and await today’s US Producer Price Index (PPI) release for clearer direction.
⭐️Personal comments NOVA:
Selling pressure, break 3340 downtrend line continues. Economic news is helping DXY recover
⭐️SET UP GOLD PRICE:
🔥SELL GOLD zone: 3381- 3383 SL 3388
TP1: $3370
TP2: $3360
TP3: $3350
🔥BUY GOLD zone: $3306-$3304 SL $3299
TP1: $3318
TP2: $3330
TP3: $3343
⭐️Technical analysis:
Based on technical indicators EMA 34, EMA89 and support resistance areas to set up a reasonable SELL order.
⭐️NOTE:
Note: Nova wishes traders to manage their capital well
- take the number of lots that match your capital
- Takeprofit equal to 4-6% of capital account
- Stoplose equal to 2-3% of capital account
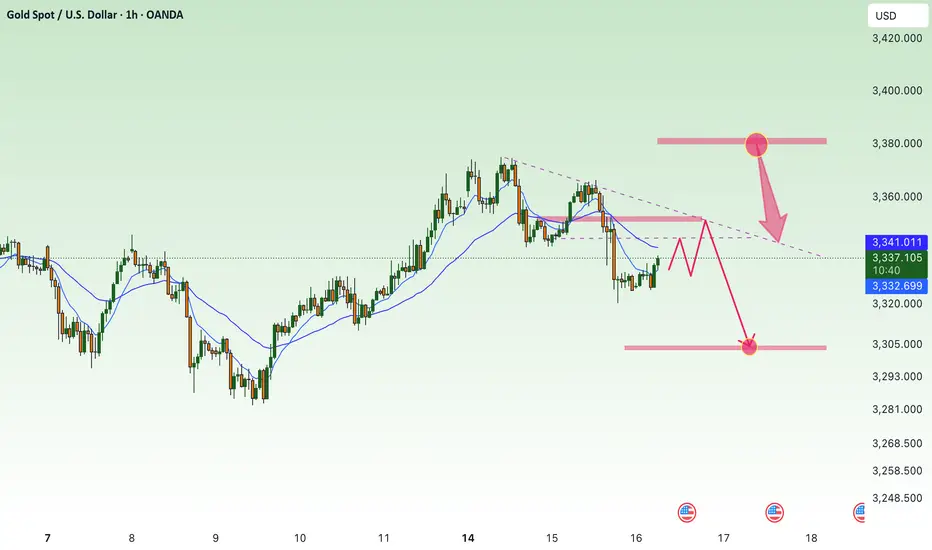
Selling pressure, bears active⭐️GOLDEN INFORMATION:
Gold prices (XAU/USD) edge higher toward $3,325 during the early Asian session on Tuesday, supported by a softer US Dollar as markets turn cautious ahead of key developments in US-China trade negotiations.
Delegations from the United States and China are set to continue discussions for a second consecutive day in London. President Donald Trump expressed optimism, stating the talks “should go very well.” According to US officials, discussions may lead to Washington lifting certain tech export restrictions in exchange for Beijing easing controls on rare earth exports — materials vital to sectors ranging from energy and defense to advanced technology. The outcome of these negotiations could provide fresh direction for the precious metal.
⭐️Personal comments NOVA:
The market is mainly sideways and accumulating, under selling pressure below 3300 due to the US-China trade negotiations taking place today.
⭐️SET UP GOLD PRICE:
🔥SELL GOLD zone : 3350- 3352 SL 3357
TP1: $3340
TP2: $3330
TP3: $3320
🔥BUY GOLD zone: $3276- $3274 SL $3269
TP1: $3285
TP2: $3300
TP3: $3312
⭐️Technical analysis:
Based on technical indicators EMA 34, EMA89 and support resistance areas to set up a reasonable sell order.
⭐️NOTE:
Note: Nova wishes traders to manage their capital well
- take the number of lots that match your capital
- Takeprofit equal to 4-6% of capital account
- Stoplose equal to 2-3% of capital account
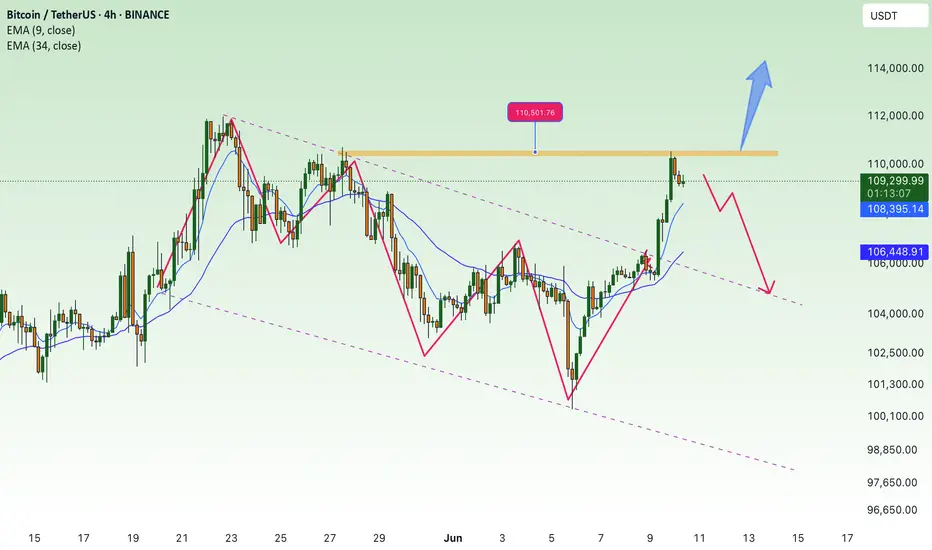
BTC Returns to Highest ATH💎 Update Plan BTC (June 10)
BlackRock’s spot Bitcoin ETF has made history, becoming the fastest-growing exchange-traded fund (ETF) ever by surpassing $70 billion in assets under management (AUM).
The iShares Bitcoin Trust (IBIT), launched in January 2024, has achieved this milestone in record time, reflecting surging demand for Bitcoin exposure through regulated, mainstream investment vehicles. IBIT’s exceptional growth trajectory has outpaced all previous ETFs, eclipsing even established funds like the SPDR Gold Shares (GLD) in terms of asset accumulation speed.
The ETF recently returned to net inflows — posting a $274 million single-day increase — following a brief period of outflows during a broader market pullback. This rebound signals renewed investor confidence, with capital flowing in from both institutional players and retail investors alike, underscoring Bitcoin’s growing role in diversified portfolios.
Technical analysis angle
Congratulations to investors when the Plan transaction has detected the bottom of 100k and is currently the highest at 110.5k. It is a prosperous signal for investors who are holding this power currency
Another good news is that the organizers have breaked out of the decrease price channel to confirm the trend of increasing and confidence in the price increase continues to be enhanced by the Buyer.
Currently, the BTC price area is slowed by the resistance level with Fibo 0.786 around the 110k price area. We expect the adjustment of the investors to collect goods before the price area goes further around 111.5k even 115k
At this time, whether new or old, should spend more time to practice, load more knowledge about the PTKT, as well as find knowledge posts at the channel ..., to strengthen the solid foundation, as well as avoid losing money at this time offline
==> Comments for trend reference. Wishing investors successfully trading
Tesla Drop to the downside update In this video I recap what happened in the latest drop on Tesla and how we anticipated this move some 4 days ago .
I cover whats possibly next for tesla looking forward .
This video also covers a HTF perspective on the direction of Tesla .
Any questions ask in comments
Thanks for your support

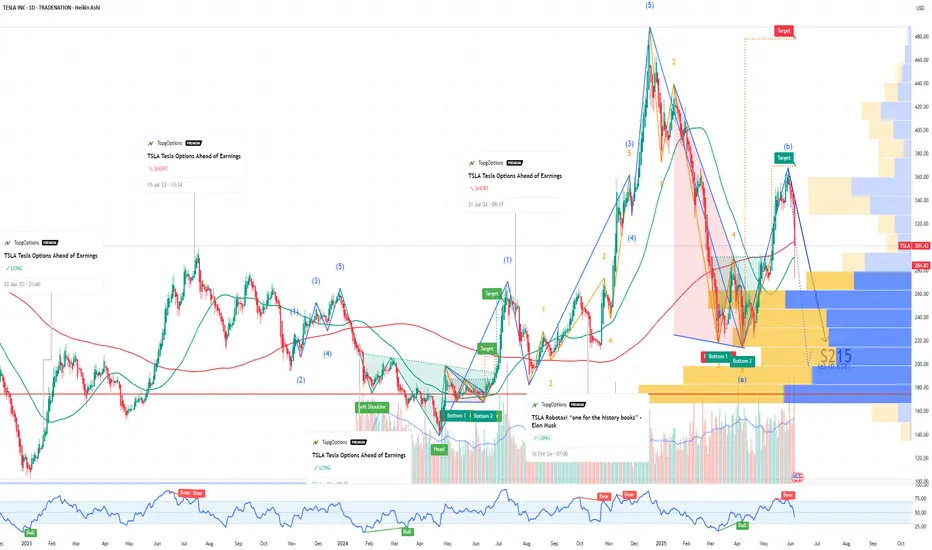
TSLA SellOff ! Elon Musk vs Donald Trump ! Beginning of the End?If you haven`t bought the dip on TSLA:
Now you need to know that TSLA Tesla experienced a significant drop of 14% today, marking its worst single-day performance in over four years. This decline erased approximately $150 billion in market capitalization, bringing the stock down to $284.70.
The immediate cause of this downturn is the escalating feud between CEO Elon Musk and President Donald Trump. Musk's public criticism of Trump's tax legislation, labeling it a "repugnant abomination," prompted Trump to threaten the revocation of government contracts with Musk's companies. This political clash has introduced significant uncertainty regarding Tesla's future government support.
Beyond the political arena, Tesla's core business metrics are showing signs of strain. The company reported a 9% decline in quarterly revenues and a staggering 71% drop in profits. Additionally, Tesla has lost its leadership position in the electric vehicle market to China's BYD, indicating increased competitive pressure.
cincodias.elpais.com
Investor sentiment is also waning. A Morgan Stanley survey revealed that 85% of investors believe Musk's political activities are negatively impacting Tesla's business fundamentals. This perception is further exacerbated by declining sales in key markets, such as a 17% drop in Model Y registrations in California.
thestreet.com
Elon Musk and Donald Trump have publicly clashed, escalating a feud that has unraveled their once-close relationship. The dispute centers on several issues:
Republican Tax and Immigration Bill: Musk criticized a sweeping Republican domestic policy bill backed by Trump, calling it a "disgusting abomination" on X. Trump claimed Musk initially had no issue with the bill, accusing him of being upset over the removal of an electric vehicle tax credit.
Epstein Files Allegation: Musk alleged Trump's name appears in classified Jeffrey Epstein files, escalating tensions. Trump has not directly addressed this claim but responded by threatening to cut government contracts with Musk's companies.
Personal and Financial Accusations: Musk argued Trump would have lost the 2024 election without his financial support, accusing him of ingratitude. Trump countered, saying he was "disappointed" in Musk, claiming he asked Musk to leave the administration and accused him of "Trump Derangement Syndrome."
Government Contracts and Tariffs: Trump threatened to cancel "billions and billions" in government contracts with Musk's companies, like SpaceX, amid the feud. Separately, Musk reportedly made personal appeals to Trump on auto tariffs, which Trump noted might involve a conflict of interest.
Cabinet Clash: Reports indicate Musk clashed with Trump’s cabinet, including Marco Rubio, over spending cuts related to the Department of Government Efficiency (DOGE), with some describing Musk's behavior as disruptive.
Given these challenges, a price target of $215 for TSLA appears justified. The combination of political entanglements, deteriorating financial performance, and eroding investor confidence suggests that Tesla's stock may face continued downward pressure in the near term.
Disclosure: I am part of Trade Nation's Influencer program and receive a monthly fee for using their TradingView charts in my analysis.
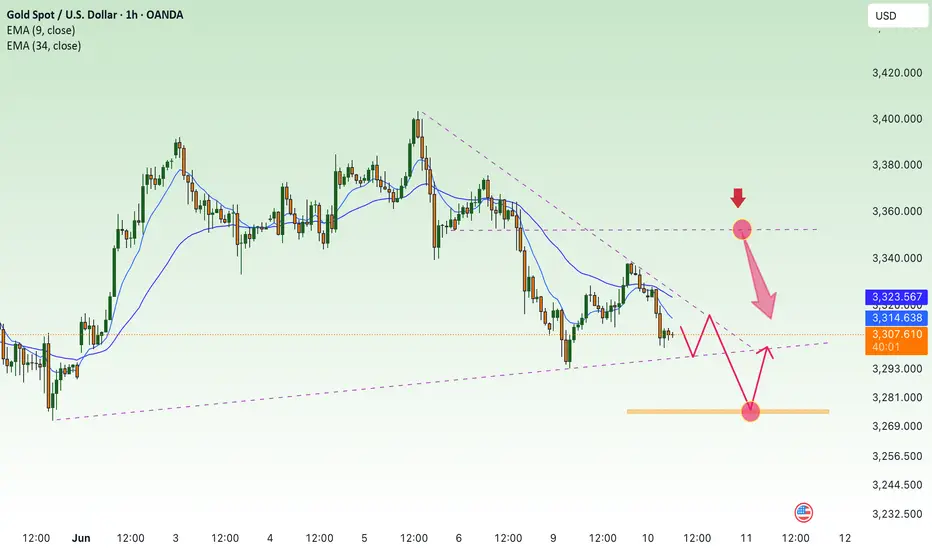
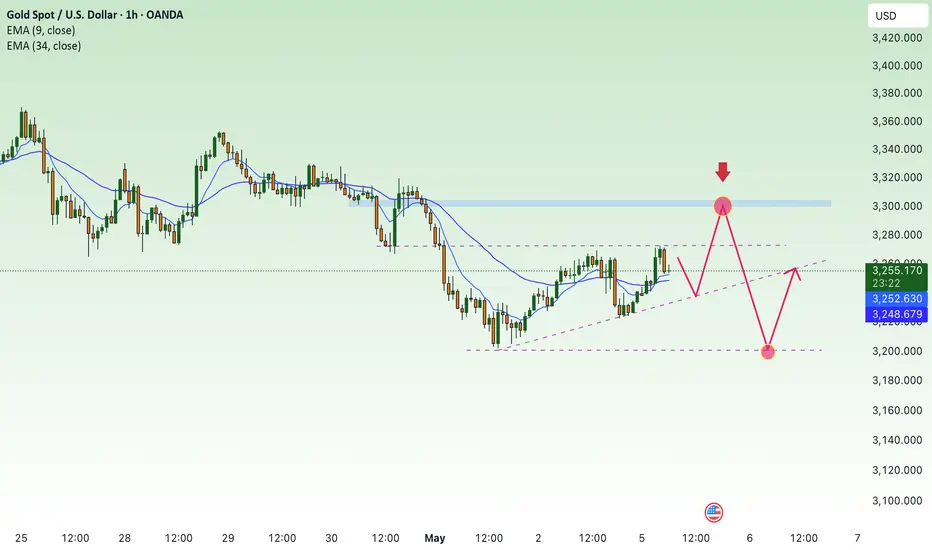
Sideway range, gold price accumulates below 3302⭐️GOLDEN INFORMATION:
Gold price (XAU/USD) kicked off the week on a positive note, rising toward the $3,271 level during Monday’s Asian session as a blend of geopolitical and economic concerns fueled demand for the safe-haven asset. The prolonged Russia-Ukraine conflict, coupled with renewed tensions in the Middle East, continues to elevate global risk sentiment. Meanwhile, lingering uncertainty surrounding US President Donald Trump's tariff agenda has added to investor caution, further supporting the appeal of gold as a hedge in times of instability.
⭐️Personal comments NOVA:
Gold price continues to accumulate, low amplitude at the beginning of the week, waiting for the most important interest rate information this week
⭐️SET UP GOLD PRICE:
🔥SELL GOLD zone : 3302- 3304 SL 3309
TP1: $3290
TP2: $3280
TP3: $3270
🔥BUY GOLD zone: $3204 - $3206 SL $3199
TP1: $3215
TP2: $3224
TP3: $3240
⭐️Technical analysis:
Based on technical indicators EMA 34, EMA89 and support resistance areas to set up a reasonable SELL order.
⭐️NOTE:
Note: Nova wishes traders to manage their capital well
- take the number of lots that match your capital
- Takeprofit equal to 4-6% of capital account
- Stoplose equal to 2-3% of capital account
Gold price decreased at the beginning of the week⭐️GOLDEN INFORMATION:
Gold prices (XAU/USD) edged lower toward $3,310 during the early Asian session on Monday, retreating from last week's record highs amid growing signs of easing global trade tensions.
US Agriculture Secretary Brooke Rollins revealed on Sunday that the Trump administration is engaged in daily discussions with China regarding tariffs, according to Reuters. Rollins also emphasized that agreements with several other countries were “very close” to being finalized.
"Headlines hinting at possible partial exemptions from retaliatory tariffs further lifted market sentiment and contributed to gold slipping below the $3,300 mark," noted Yuxuan Tang, strategist at JPMorgan Private Bank.
⭐️Personal comments NOVA:
At the beginning of the week, gold prices were mainly sideways, without much news impact, trading around 3300 and gradually decreasing.
⭐️SET UP GOLD PRICE:
🔥SELL GOLD zone : 3368- 3370 SL 3375
TP1: $3360
TP2: $3350
TP3: $3340
🔥BUY GOLD zone: $3212 - $3214 SL $3207
TP1: $3225
TP2: $3240
TP3: $3255
⭐️Technical analysis:
Based on technical indicators EMA 34, EMA89 and support resistance areas to set up a reasonable SELL order.
⭐️NOTE:
Note: Nova wishes traders to manage their capital well
- take the number of lots that match your capital
- Takeprofit equal to 4-6% of capital account
- Stoplose equal to 2-3% of capital account
Gold price stabilized again, trading around 3300⭐️GOLDEN INFORMATION:
Gold price (XAU/USD) found fresh buying interest during the Asian session on Wednesday, pausing its pullback from the previous day’s record high near $3,500. Attempts by the US Dollar (USD) to rebound from multi-year lows faltered, as investor confidence in the US economic outlook continues to erode amid President Donald Trump’s erratic tariff policy shifts.
Additionally, growing expectations of more aggressive monetary easing by the Federal Reserve (Fed) have triggered renewed selling pressure on the greenback. This, in turn, has reinforced demand for the non-yielding yellow metal, helping gold regain upward momentum as investors seek shelter from mounting economic and policy uncertainty.
⭐️Personal comments NOVA:
The slowdown and downward adjustment of gold are inevitable. Profit-taking psychology and cooling news of tariffs and Russia-Ukraine military forces caused gold prices to fall.
⭐️SET UP GOLD PRICE:
🔥SELL GOLD zone : 3410- 3412 SL 3417
TP1: $3390
TP2: $3380
TP3: $3370
🔥BUY GOLD zone: $3281 - $3283 SL $3276
TP1: $3290
TP2: $3300
TP3: $3315
⭐️Technical analysis:
Based on technical indicators EMA 34, EMA89 and support resistance areas to set up a reasonable SELL order.
⭐️NOTE:
Note: Nova wishes traders to manage their capital well
- take the number of lots that match your capital
- Takeprofit equal to 4-6% of capital account
- Stoplose equal to 2-3% of capital account
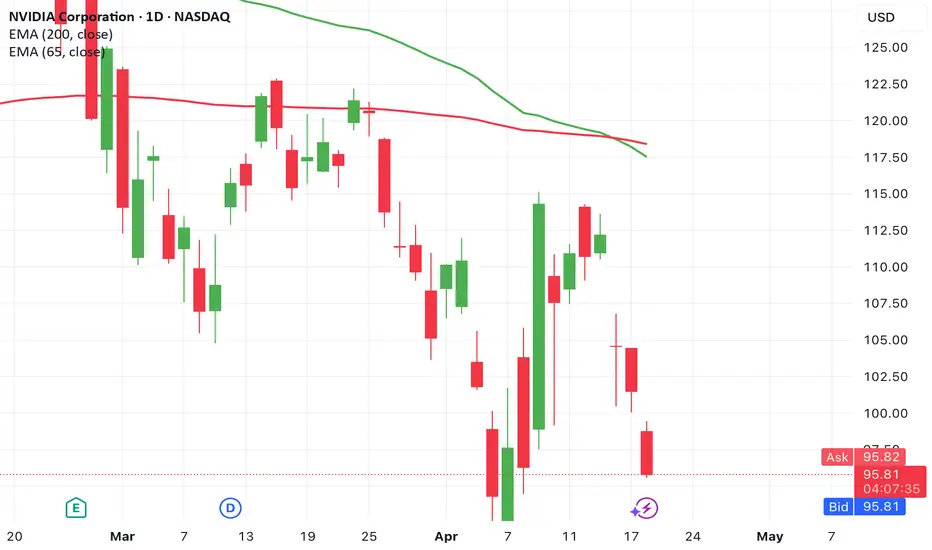
Down Nearly -5.5% The Nvidia Death Cross. Formed and Diverging?!NVIDIA (NVDA) Looks to be showing a formed death cross of the 65 Day and 200 Day Exponential Moving Averages . Price is down almost -5.50% by Midday.
What could happen next?
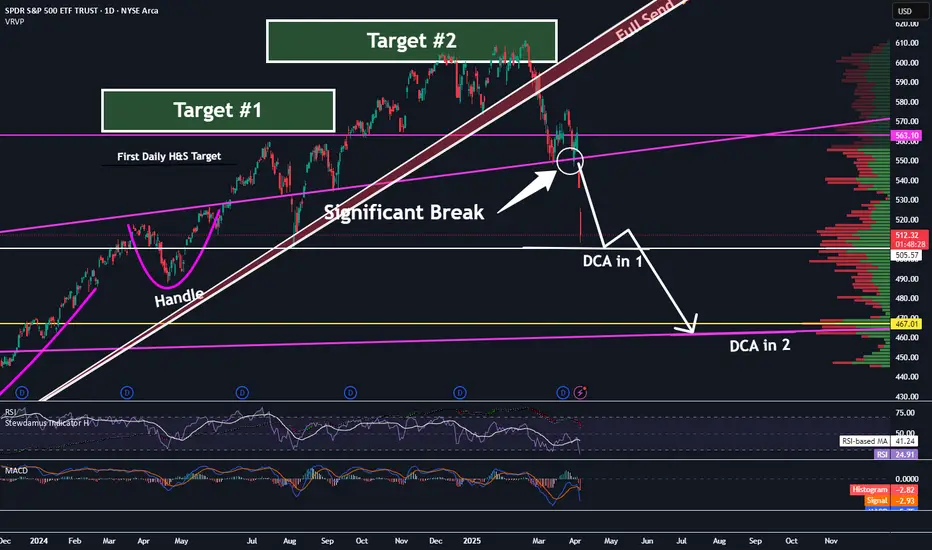
Tariff FUD is reking ports. SPY 505 First Stop. 460 Second.Trading Fam,
It's no surprise that Trump's implementation of high tariffs would cause initial FUD. This can be observed in the massive spikes on the $VIX. What is unknown and has caught many traders by surprise, myself included, is how substantial of a drop would be incurred by investor uncertainty.
Initially, it did appear that 500 might hold. That was a huge support. I knew if it broke, the sell-off would be deep. But I held hope that the market would hold above this trendline. It did not. So, yesterday and today, investors who held are incurring substantial losses.
For those who were smarter than me and sold at or near the top, congratulations! You've saved yourself some duress and cash. Now, some are calling this the beginning of a longer bear market. I still don't see it that way. Honestly (and I know this will be hard to believe), I still see the SPY hitting my target #3 at 670-700 before 2026 comes to an end. Longer-term we still remain in a massive secular bull market since 2009 and to break this long-term trend, the SPY would actually have to break below 300. That is a long way down and I just don't see that happening, though as always, I definitely could be wrong.
Shorter-term I am seeing two prominent areas of support. The first has almost been reached at 505. If I would have played this correctly, I'd be DCA'ing in my first load of cash here. The second area of support is at around 460 and slightly rising daily. This would be where I DCA'ed in another load of cash. However, if that broke, I'd exit immediately and reassess the charts. 300 is a long way down, but over the past 5 years we have seen some extraordinary market price action and volatility. TBH, even the best of us technicians are struggling to understand the larger macro-economic picture, but I'd wager to say that tariff fears may be overexaggerated as market reactions often tend to be.
One interesting note is that crypto price action no longer seems to correlate and prices have help up surprisingly well. Could this be our first indicator that the markets are due to turn up again in a few weeks/months? Unknown. But I can promise you I'll be watching this all closely.
✌️Stew
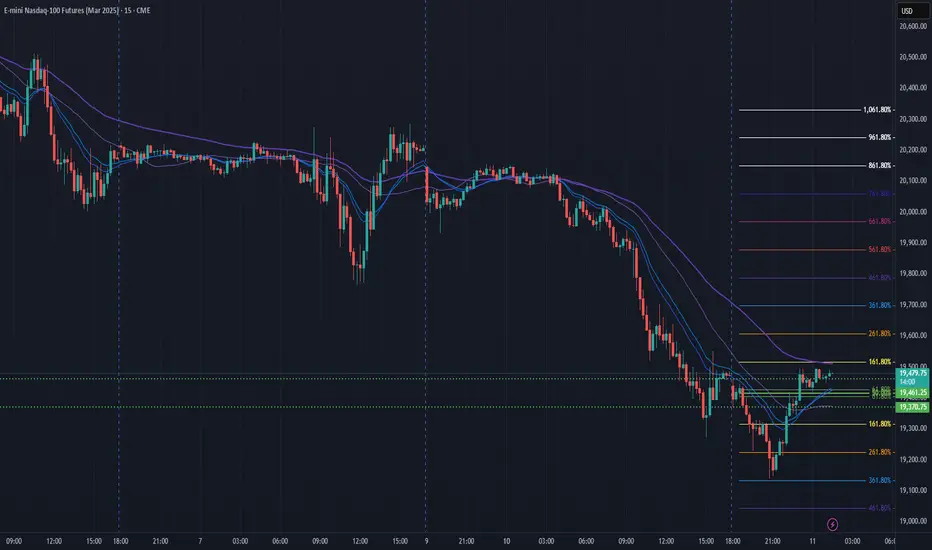
NQ Power Range Report with FIB Ext - 3/11/2025 SessionCME_MINI:NQH2025
- PR High: 19461.50
- PR Low: 19370.25
- NZ Spread: 204.0
Key scheduled economic events:
10:00 | JOLTS Job Openings
Value decline continues, finding 19200s inventory
- Advertising continued selling, keeping slight gap above previous session high open
- Holding auction above previous session close at the lows
Session Open Stats (As of 12:35 AM 3/11)
- Session Open ATR: 498.26
- Volume: 83K
- Open Int: 297K
- Trend Grade: Neutral
- From BA ATH: -13.2% (Rounded)
Key Levels (Rounded - Think of these as ranges)
- Long: 22667
- Mid: 21525
- Short: 19814
Keep in mind this is not speculation or a prediction. Only a report of the Power Range with Fib extensions for target hunting. Do your DD! You determine your risk tolerance. You are fully capable of making your own decisions.
BA: Back Adjusted
BuZ/BeZ: Bull Zone / Bear Zone
NZ: Neutral Zone
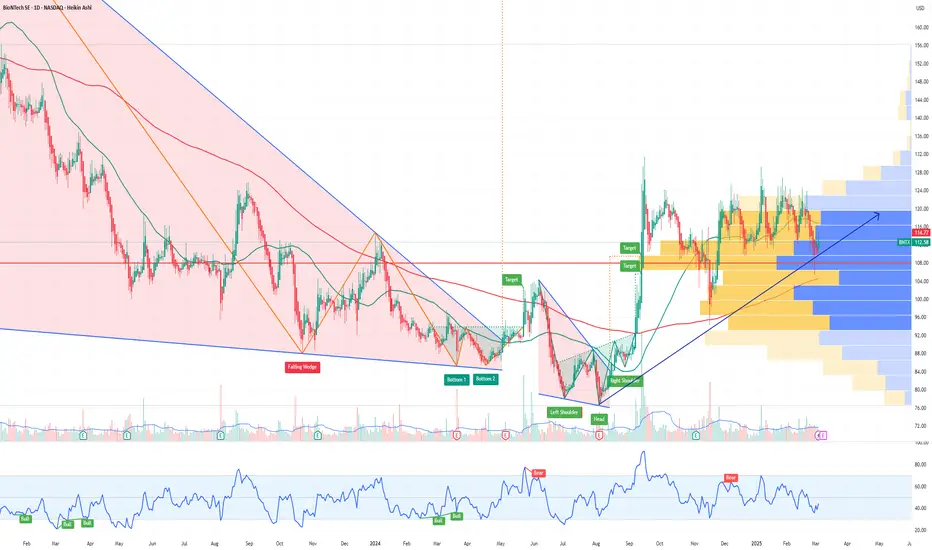
BNTX BioN Tech Options Ahead of EarningsAnalyzing the options chain and the chart patterns of BNTX BioN Tech prior to the earnings report this week,
I would consider purchasing the $115usd strike price Calls with
an expiration date of 2025-9-19,
for a premium of approximately $17.40.
If these options prove to be profitable prior to the earnings release, I would sell at least half of them.
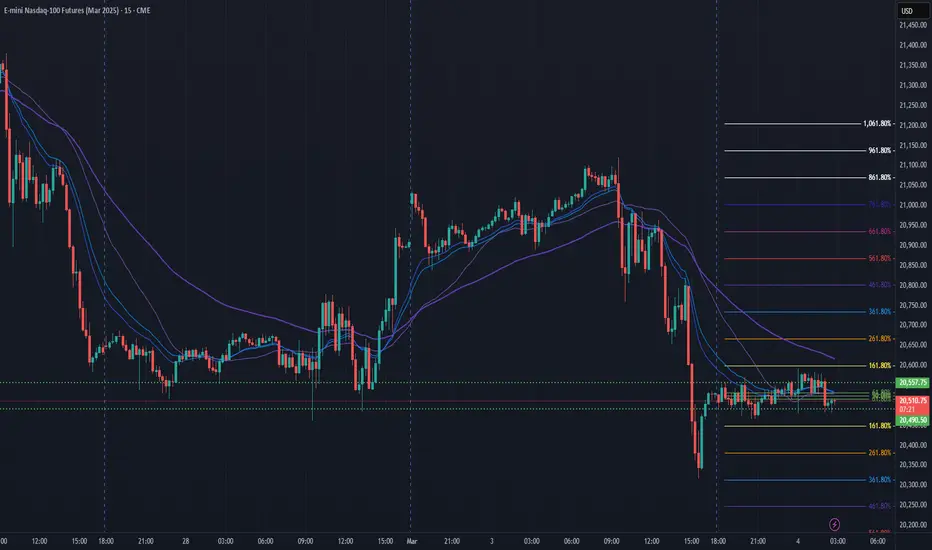
NQ Power Range Report with FIB Ext - 3/4/2025 SessionCME_MINI:NQH2025
- PR High: 20557.75
- PR Low: 20490.00
- NZ Spread: 151.25
No key scheduled economic events
Friday range supply sweep, placing auction at the lows of previous 2 sessions
- Rotating off 20400 inventory
- Advertising continued selling into new week lows
Session Open Stats (As of 12:45 AM 3/4)
- Weekend Gap: N/A
- Gap 10/30/23 +0.47%
- Session Open ATR: 418.05
- Volume: 52K
- Open Int: 287K
- Trend Grade: Bull
- From BA ATH: -8.5% (Rounded)
Key Levels (Rounded - Think of these as ranges)
- Long: 22667
- Mid: 21525
- Short: 19814
Keep in mind this is not speculation or a prediction. Only a report of the Power Range with Fib extensions for target hunting. Do your DD! You determine your risk tolerance. You are fully capable of making your own decisions.
BA: Back Adjusted
BuZ/BeZ: Bull Zone / Bear Zone
NZ: Neutral Zone
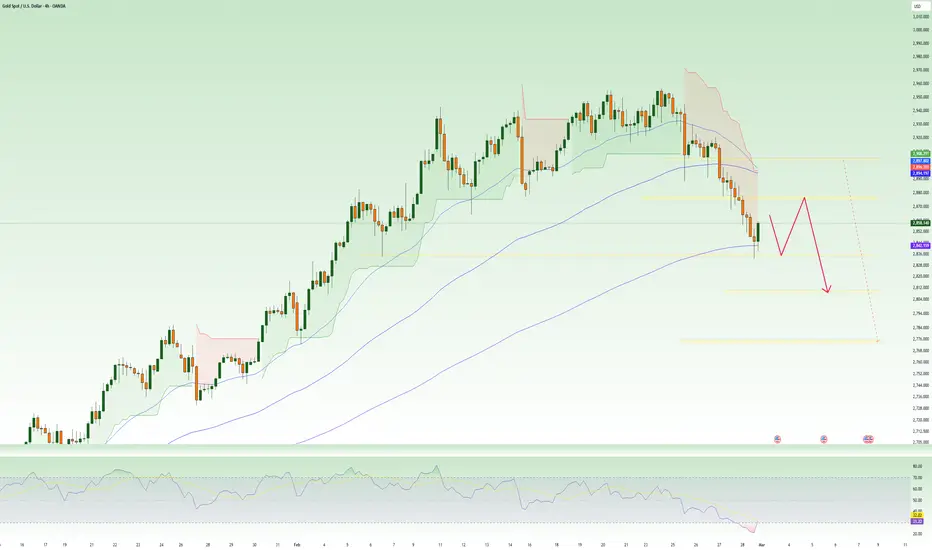
Downward momentum, downtrend next week, XAU ✍️ NOVA hello everyone, Let's comment on gold price next week from 03/3/2025 - 03/07/2025
🔥 World situation:
US President Donald Trump confirmed that 25% tariffs on Mexican and Canadian goods will take effect next week on March 4. Meanwhile, the Fed’s preferred inflation gauge, the Core PCE Price Index, signaled continued progress toward the central bank’s 2% target.
Following the data, expectations for further Fed policy easing grew. According to Prime Market Terminal, the Fed is anticipated to cut rates by 70 basis points this year, with investors betting on the first reduction in June.
🔥 Identify:
Breaking the trend, gold continues to maintain a downtrend
🔥 Technically:
Based on the resistance and support areas of the gold price according to the H4 frame, NOVA identifies the important key areas as follows:
Resistance: $2876, $2903, $2956
Support : $2810, $2773
🔥 NOTE:
Note: Nova wishes traders to manage their capital well
- take the number of lots that match your capital
- Takeprofit equal to 4-6% of capital account
- Stoplose equal to 2-3% of capital account
- The winner is the one who sticks with the market the longest
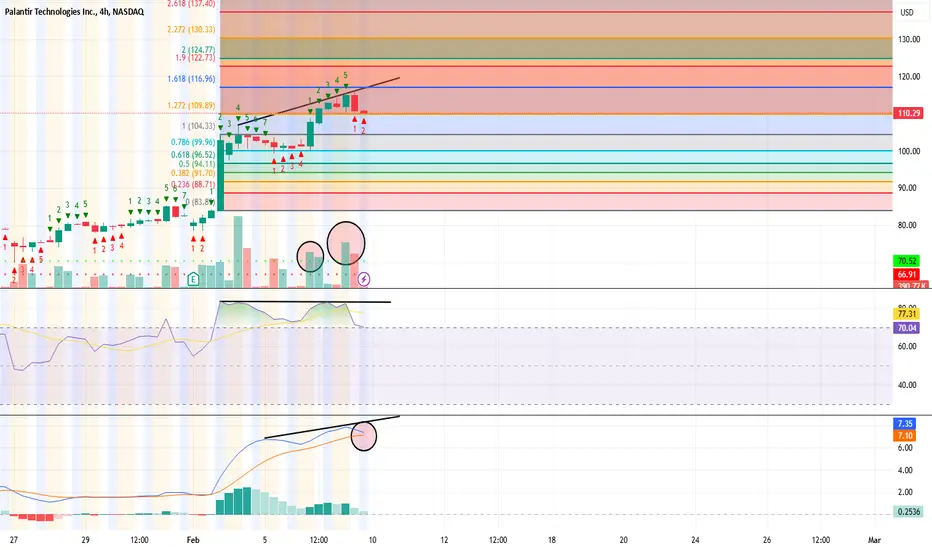
$PLTR 4h RSI, Vol. Bearish Divergence4H chart showing divergence and may not necessarily be a top but could be pulling back for a test of support. Watch 10DMA for potential support.
To Thine Own Shoe be True - $BTC's Other Foot is About to FallBitcoin’s Floor Must Be Lower – Chart Physics and Market Psychology at Work
In this video, I explain why Bitcoin has no choice but to find a lower floor, despite many traders believing the worst is behind us. While price is briefly going to appear to confirm support, this is just part of the process before it comes back down and breaks through it on the third test. The real focus here isn’t whether this level holds for another day or two—it’s about why Bitcoin must go lower before it can establish true support.
For a long time, Bitcoin has been floating over clear air with no real structural support. When price climbs too high without building a strong foundation, it eventually has to fall back down to fill the gaps. Right now, the market is in denial, desperately trying to hold Bitcoin in the $90,000 range, but this isn’t about what traders want—it’s about chart physics and liquidity. When there’s nothing left to hold the price up, it must seek a lower equilibrium.
Psychologically, traders don’t want to accept that Bitcoin might have to revisit $70,000 or lower to reset before moving higher. But markets don’t move based on hope—they move based on supply, demand, and liquidity positioning. Right now, there are no meaningful buyers willing to absorb the sell pressure at this level, which means Bitcoin has nowhere to go but down. Once it finally breaks through, it will likely move quickly, as there’s no real support structure beneath it.
Know thy shoe.
The shoe will find the ground.
(My sincerest apologies about the volume ladies and gentlemen. The problem which I thought I had corrected from a prior video still exists in this video. It is an issue I'm hoping Trading View can correct before too long on their end… The problem originated on my end, but there was nothing I can do after it was recorded, and I had to get this video up there - I believe it contains important time sensitive information…
Please try listening with the volume turned all the way up or perhaps with headphones until the problem can be corrected.
My system issue has been corrected for the future, but Trading View if you can, please tweak this on your end and amplify it. This video is extremely worthwhile..)

MSFT MicroStrategy Update Quick update on the move to the downside that we had been expecting . Sharing my thoughts on what next.

That's the Way the Bitcoin TumblesWhy I Think the Sell-Off Isn’t Over Yet
Bitcoin is already in the middle of a sharp sell-off, but at least half the market seems convinced the worst is over and that a recovery is underway. I don’t see it that way. Bitcoin has been grinding sideways into the Bollinger Bands on the weekly chart, and now that it’s finally colliding with the basis lines, I think it’s about to plunge straight through them. This doesn’t look like a market that’s ready to bounce—it looks like one that’s about to take another leg down. Maybe I’m wrong, maybe I’m early, but in my experience, when people start celebrating too soon, things tend to get a whole lot worse.
CRYPTO:BTCUSD
CRYPTOCAP:BTC
CME:MBT1!
CME:BTC1!
CRYPTO:MOBILEUSD
COINBASE:RNDRUSD
CRYPTO:SHPINGUSD
CRYPTO:FXUSD
CRYPTO:ALEOUSD
CRYPTO:HONEYUSD
COINBASE:ACSUSD
CRYPTO:ASMUSD
CRYPTO:BATUSD
CRYPTO:FILUSD
CRYPTO:VTHOUSD
CRYPTO:B3USD
As always, this is not investment advice, any trade you make is on you, because good golly Miss Molly, I got my own things to worry about.

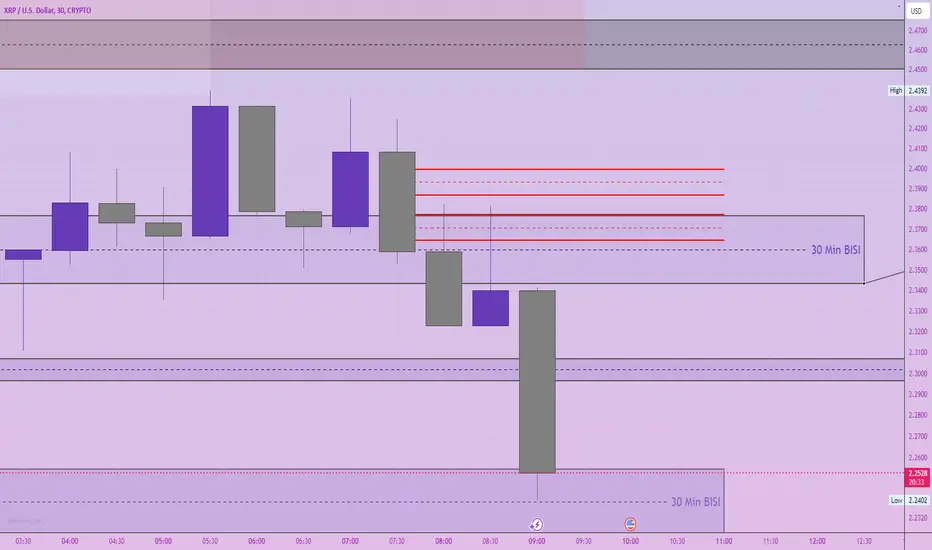
XRP, what are you doing?
There is a good chance price starts to move sideways. A weekly SIBI has formed at 2.59-2.89 and might be the resistance to keep price sideways.
If price does not, I foresee a possible bear retracement occurring.
Multiple FVGs are below current price (2.34). A 4HR SIBI rests at around 2.45-2.46. If price does go up, that SIBI might be the resistance to hold prices from elevating upwards.
Based on what the charts are showing me, we might be headed to another sell-off.
Reason for this assumption is due to the 1-day liquidity zone that sits at $1.77. Also keeping in mind that the bottom 1/3 of the weekly FVG has still been untouched.
If I was analyzing this chart without experiencing yesterday's (2/2/25) sell-off, I would say that we wouldn't get that low into the FVGs. But yesterday was crazy, and I did not think we could get into those gaps. So I am giving more respect to those gaps with this analysis.
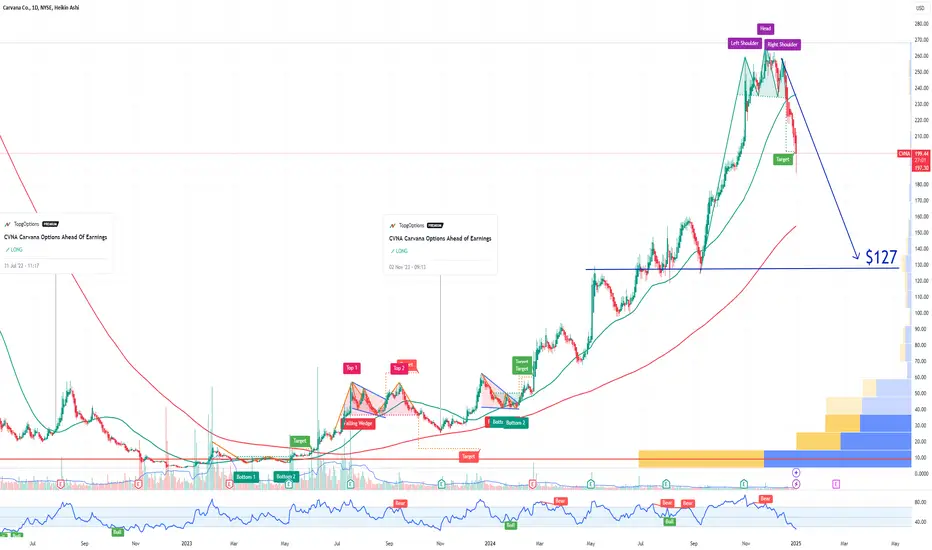
CVNA Carvana Sell-Off: Hindenburg Research Short PositionIf you haven`t bought CVNA at $25:
Carvana Stock Now Faces Major Risks: A Price Target of $127
Carvana Co. (CVNA), currently trading at $199, faces mounting scrutiny after allegations from Hindenburg Research. The short-seller’s report, titled “Carvana: A Father-Son Accounting Grift for the Ages,” accuses the company of unsustainable growth fueled by lax underwriting standards and questionable insider dealings.
Key Concerns:
Insider Selling: CEO Ernest Garcia III and his father, Ernie Garcia II, sold $3.6 billion in stock between 2020-2021, with an additional $1.4 billion sold last year after a 284% stock surge.
Loan Portfolio Risks: Claims suggest Carvana approves nearly all loan applicants, increasing exposure to subprime defaults as economic conditions tighten.
DriveTime Transactions: Allegations of inflated revenues through sales to DriveTime, owned by Garcia II, raise conflict-of-interest concerns.
Manipulated Results: Extensions on subprime loans reportedly delay delinquencies, misrepresenting financial health.
Outlook:
While the stock has shown resilience, we believe these risks significantly outweigh the rewards. With questionable accounting practices and a vulnerable loan portfolio, our price target is $127.
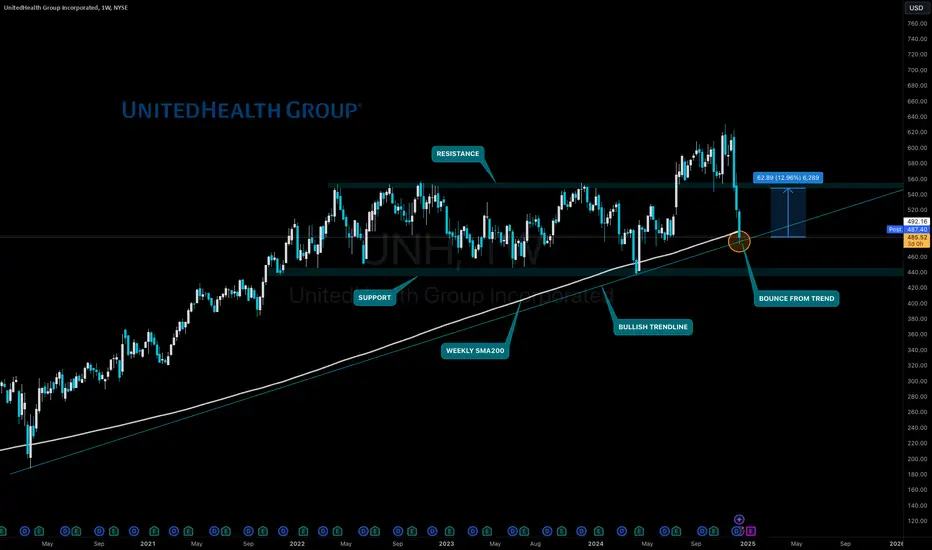
UNH Selloff Unreasonable - Still 15% ROI Short-TermSince my first NYSE:UNH idea a couple of days ago the price of this stock dropped significantly. If you've been part of the first idea you should've been able to lock in around 1.x% of return when using a tight stop-loss. Otherwise you've been stopped out with break-even. Nevertheless, the sell-off was not helpful and is completely exaggerating the situation at UNH since the company is not really effected by the current PBM debate.
"Deutsche Bank sees a potential divestiture as not having a significant impact on earnings, estimating the risk at likely less than $200M of the company’s roughly $30B+ operating earnings. Deutsche Bank noted, however, that CVS (CVS), Cigna (CI) and UnitedHealth (NYSE:UNH) 'could face additional risk from losing the ability to vertically integrate the PBM, fulfillment and manufacturing functions of biosimilars through organizations like Cordavis and Quallent.' Despite concerns about the potential breakup of their pharmacy businesses, Deutsche Bank maintained it's buy rating on UnitedHealth (UNH)."
From a technical standpoint we can see a confluence of support:
Weekly SMA200
Strong Trendline from March 2020
Horizontal Support at $480
UNH managed to bounce from the trendline intraday today. This could mean we're going to see a turnaround from here. If we break below the trendline on the daily chart this trade will be invalidated. Otherwise our target sits at $550.
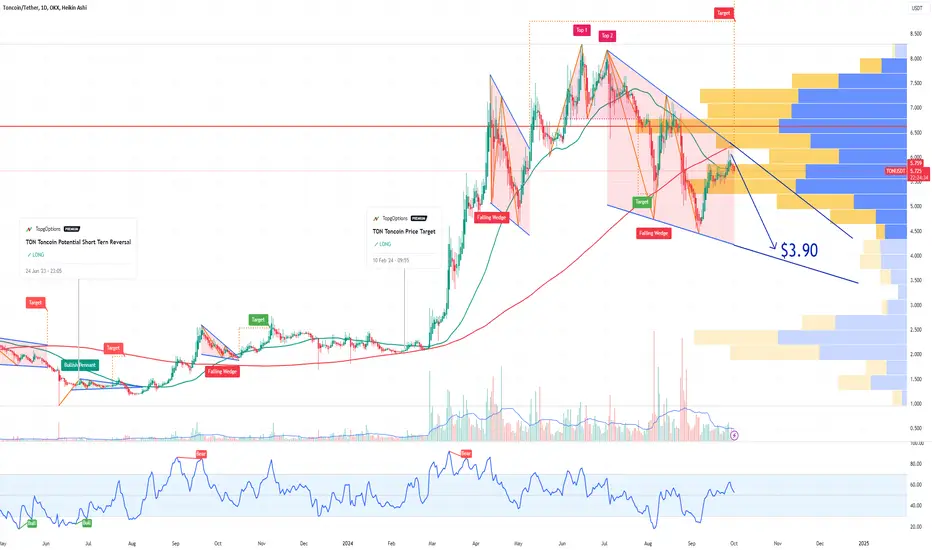
TON Toncoin potential SelloffTelegram CEO Pavel Durov has been charged for failing to prevent extremist and illegal content on the messaging platform and placed under judicial supervision, according to the Paris prosecutor's office on August 28.
Durov must report to the police twice a week and is barred from leaving France, the prosecutor's office stated on X.
Parisian investigative judges have also ordered the Russian-born Telegram co-founder to post 5 million euros in bail.
Meanwhile, TON Toncoin is currently in a bearish falling wedge pattern, with a new price target of $3.9.