ASML (ASML): Massive Sell-Off - What's next after the $50B loss?We are sure you’ve heard about ASML’s massive drop yesterday, erasing $50 billion in market value within hours following a technical error and the earnings report published a day earlier. ASML, Europe's most valuable tech company and a critical supplier to chipmakers, is now facing doubts—not about its long-term prospects but regarding short-term sales and whether it can continue to outperform the market in the long term.
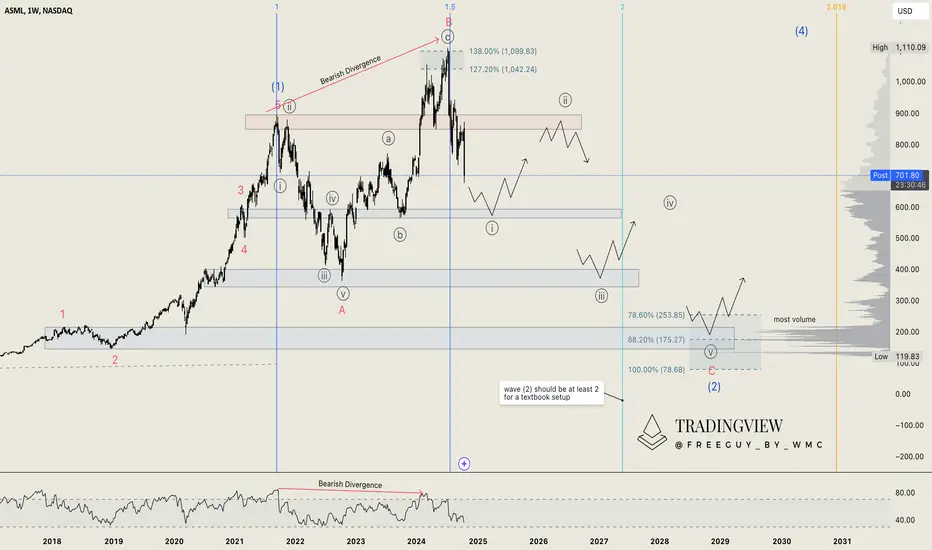
As always, we’re not focused on intraday trades but are looking for bigger, high-risk-to-reward swing trade setups. To assess this, we’re turning to the Weekly chart to analyze ASML’s most important levels. Our most likely scenario at this point is that the All-Time High represents a wave B, after exactly respecting the 138% Fibonacci extension level. Coupled with the bearish divergence on the RSI, this pullback was expected.
While it's difficult to predict the exact point of reversal, we see $600 as a major psychological support level that could hold in the short term. To reverse the current downtrend, ASML must break above the resistance zone of $850–$895. However, as this is a potential wave ((ii)), even reaching the All-Time High is not out of the question. Merely reclaiming this resistance zone might not be enough to signal a trend change.
We’re keeping an eye on all major support zones, but the largest position we plan to open would be between $250 and $140. While this is still far off, and there will likely be opportunities along the way, this zone would provide the most textbook setup according to Elliott Wave Theory. The recent dip has also opened up more potential plays for the future.
Stay tuned as we monitor the situation for further developments! 🔥
Selloff
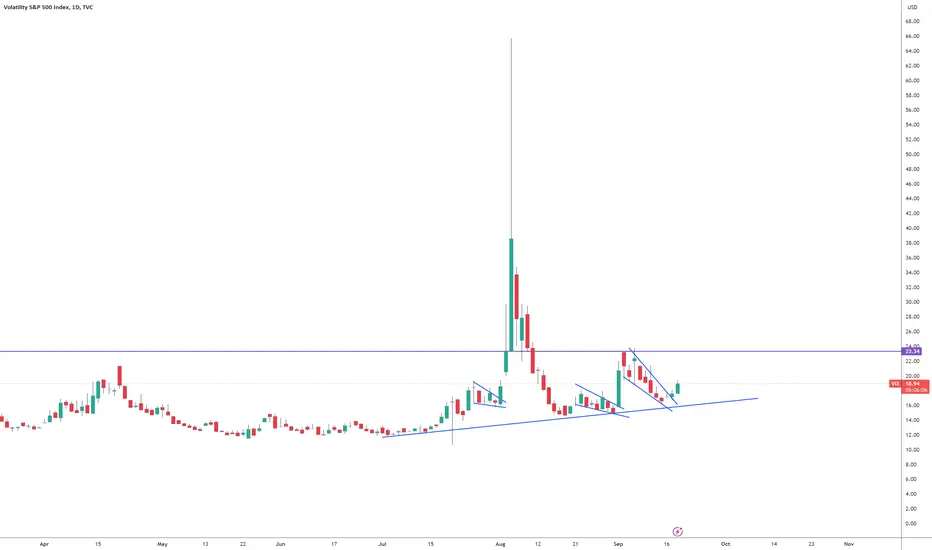
VIX Watch outHours before FOMC VIX is doing this. I bought QQQ puts expire today to trade the news. More than 60% probabilities the FED cuts 0.5. But if it only cuts 0.25 might trigger a violent sell-off
NAS100 - End Of August - Are you not satisfied???Hello Traders.
Come on guys, interact with the post if you seeing how accurate this is !
Notes for today
Price tapped into our zone i mentioned in the previous post, 19,666 was to far but but 19,630 was my entry.
Price was kind enough to come back to this point again today before NY killzone time.
If you followed me from Monday, i mentioned we will see lower prices possibly up to 19,120. So far so good.
If you caught it, you would be + 300 ticks minimum.
For today, i am done. Will relook at the charts tomorrow.
Trade safe 👌

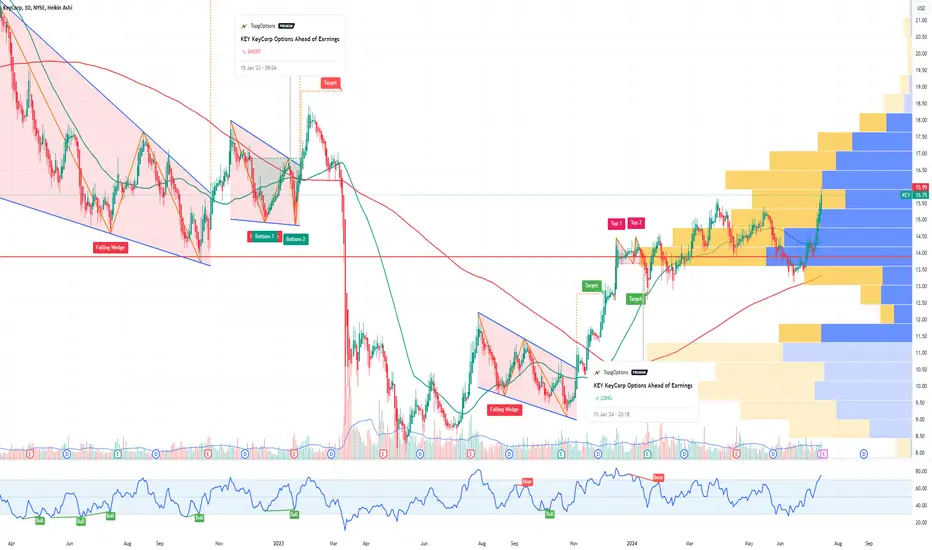
KEY KeyCorp Options Ahead of Earnings If you haven`t sold KEY before the selloff:
Now analyzing the options chain and the chart patterns of KEY KeyCorp prior to the earnings report this week,
I would consider purchasing the 15usd strike price Puts with
an expiration date of 2024-8-16,
for a premium of approximately $0.21.
If these options prove to be profitable prior to the earnings release, I would sell at least half of them.
ZION Zions Bancorporation Options Ahead of EarningsAnalyzing the options chain and the chart patterns of ZION Zions Bancorporation prior to the earnings report this week,
I would consider purchasing the 45usd strike price Puts with
an expiration date of 2024-8-16,
for a premium of approximately $0.80.
If these options prove to be profitable prior to the earnings release, I would sell at least half of them.

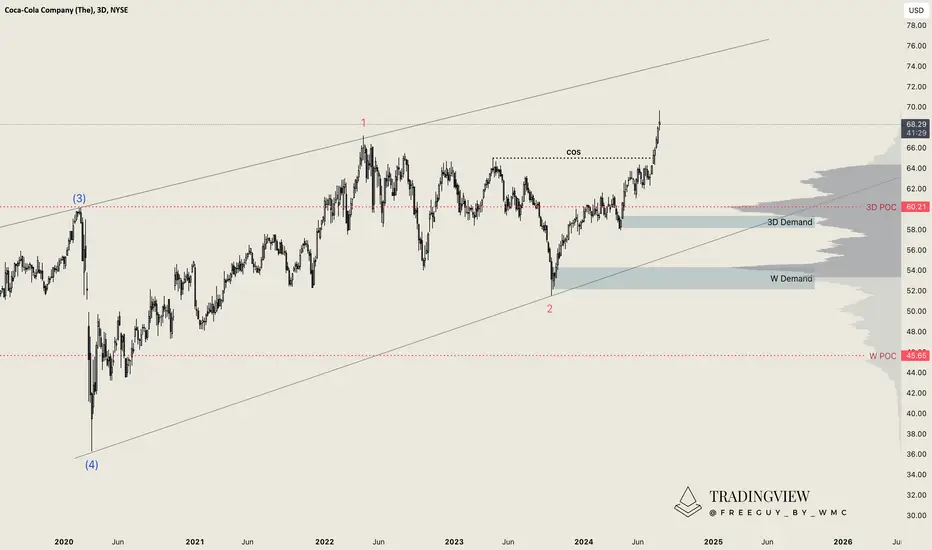
Coca-Cola (KO): Strength in Uncertain TimesAfter not taking a look at Coca-Cola for quite a while, it's definitely worth analyzing. As one of the biggest assets in the stock market, Coca-Cola seems to have the most resistance with a relatively low risk/return profile, making it very interesting in times of uncertainty. A shift from risk-on assets to risk-off assets could happen easily. Just by looking at the latest rise, we can see that while there was a big sell-off in all stocks, NYSE:KO only fell by about 1.2%. This showcases the strength I am talking about.
After finishing Waves 1 and 2, we got the structure shift for a possible bullish rise. Because the intra-waves aren't very clear on NYSE:KO , we are looking at it from mostly the market structure perspective. Two points are highly interesting: the 3D POC just above the 3D Demand at around $60 and the Weekly Demand at $54.
We are looking for a possible long bid on Coca-Cola but will wait for the opportunity to come. When it does, we will share it with you, of course. 🤝
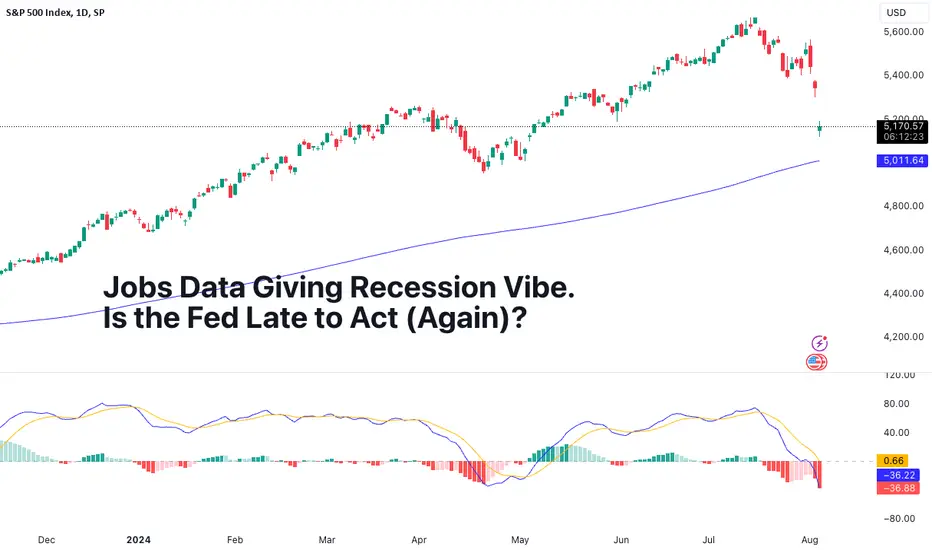
Jobs Data Giving Recession Vibe. Is the Fed Late to Act (Again)?Why does it seem like the Fed is playing catch-up with the economy? In 2021 and 2022, the US central bank was jamming stimulus at a fast clip. Suddenly it stopped and reversed course to raise interest rates at never-before-seen speed (that’s when officials were saying inflation was transitory). Now, the skyrocketing interest rates are threatening to derail the economy. Or worse — throw it in a recession.
The red-hot US labor market is no more. Or at least there wasn’t anything red-hot for America’s workers and job seekers in July (except for maybe the coast-to-coast summer heat). And now financial markets are in limbo.
America’s employers added just 114,000 new hires to the workforce — a far cry from the expected 174,000 and even that consensus view was soft. The bigger-then expected slump in US jobs growth fanned concerns over a flailing economy and there was one major player to pin the blame on — the Federal Reserve.
What’s the Fed?
The Federal Reserve, or just the Fed, is the central bank of the United States. Its daily grind is to keep the economy from veering off a cliff or overheating like a meme stock on WallStreetBets. The Fed is currently headed by Jerome Powell, or Jay Powell, or even JPow if you’re cool enough, and serves a dual mandate of maximum employment and stable prices.
For about a year, markets have been building up the conviction that the Federal Reserve should start thinking about cutting rates. But for months, the Fed didn’t even think about talking about cutting rates as a flurry of economic indicators was more or less suggesting that one slash might be a good idea. And now markets fear it may be too late for that.
The steep drop in the employment figure for July suggested that the economy has started to crack under the pressure of interest rates sitting at a 23-year high of 5.50%. When rates are high they make borrowing more expensive and discourage businesses and consumers from taking out loans to run their lives better. Instead, they shove their cash in deposit accounts and generate passive, risk-free yield. In a nutshell, high rates = economic contraction; low rates = economic expansion.
When rates stay higher for longer, the Fed runs the risk of tilting the economy into the very recession it is fiercely trying to avoid.
Talk About Bad Timing
The timing for that jobs data couldn’t have been more inconvenient. July’s nonfarm payrolls arrived just two days after the Fed praised the growth of the economy and voted against reducing its benchmark interest rate. To defend this decision, Chairman Jay Powell said that his clique of top central bankers need more good data that shows inflation is heading down toward the bank’s 2% goal. He also went on to say that he “wouldn’t like to see material further cooling in the labor market.”
The press conference after that rate call did end on a high note. The Fed boss noted that an interest rate cut was on the table at the next meeting slated for mid-September. The issue, however, is whether a single 25-basis-point cut, as communicated, will be enough. Markets have already ramped up bets for a juicier 50-basis-point reduction to borrowing costs — a more aggressive monetary policy measure that will provide a stronger lean against a faltering economy.
And while the difference between jobs added and jobs expected might be a factor, the severe pullback seems more about investors throwing a tantrum. "You should've cut rates, now deal with our unusually strong reaction as we make a statement," kind of play.
The painful scenario where the Fed may have fallen behind the curve shook Wall Street and spread into global markets. Stocks in the US are in a free fall. The tech-heavy Nasdaq Composite slipped into correction territory, dropping 10% from its peak in mid-July.
Tech giants , the main driver of the broad-based gains across the major US indexes, are heavily battered. But the selloff is widespread, jolting everything from stocks , to the US dollar to Bitcoin .
Add to this an earnings season weighed by investor concerns over spending on artificial intelligence and you’ve got quite a few things to consider before you jump into your favorite stock out there.
What Do You Think?
Do you think the Fed will trim rates by a bigger 50-basis-point cut in September or even introduce an urgent interest rate cut before their next regular meeting? And are you comfortable betting on beaten-down equities across the board? Let us know your comments below!
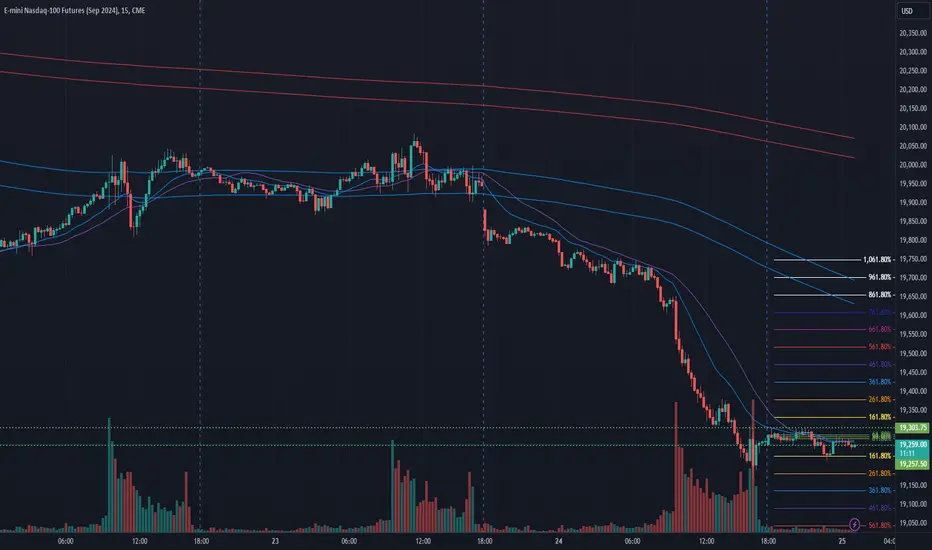
NQ Power Range Report with FIB Ext - 7/25/2024 SessionCME_MINI:NQU2024
- PR High: 19304.50
- PR Low: 19257.50
- NZ Spread: 105.0
Key scheduled economic events
08:30 | Initial Jobless Claims
- Durable Goods Orders
- GDP
Continuing strong value decline
- Recent political news taking the blame
- Broken 2 daily pivots, ~20400 & ~19800
- ~1000 points from 20-Keltner Avg
Evening Stats (As of 11:15 PM 7/24)
- Weekend Gap: +0.25% (filled)
- Session Gap 7/24: -0.32% (open > 19946)
- Gap 10/30/23 +0.47% (open < 14272)
- Session Open ATR: 323.73
- Volume: 32K
- Open Int: 250K
- Trend Grade: Bull
- From BA ATH: -8.2% (Rounded)
Key Levels (Rounded - Think of these as ranges)
- Long: 20954
- Mid: 19814
- Short: 18675
Keep in mind this is not speculation or a prediction. Only a report of the Power Range with Fib extensions for target hunting. Do your DD! You determine your risk tolerance. You are fully capable of making your own decisions.
BA: Back Adjusted
BuZ/BeZ: Bull Zone / Bear Zone
NZ: Neutral Zone
KEY KeyCorp Options Ahead of EarningsLooking at the KEY KeyCorp options chain ahead of earnings , I would buy the $14 strike price Puts with
2023-6-16 expiration date for about
$0.27 premium.
If the options turn out to be profitable Before the earnings release, i would sell at least 50%.
Looking forward to read your opinion about it.

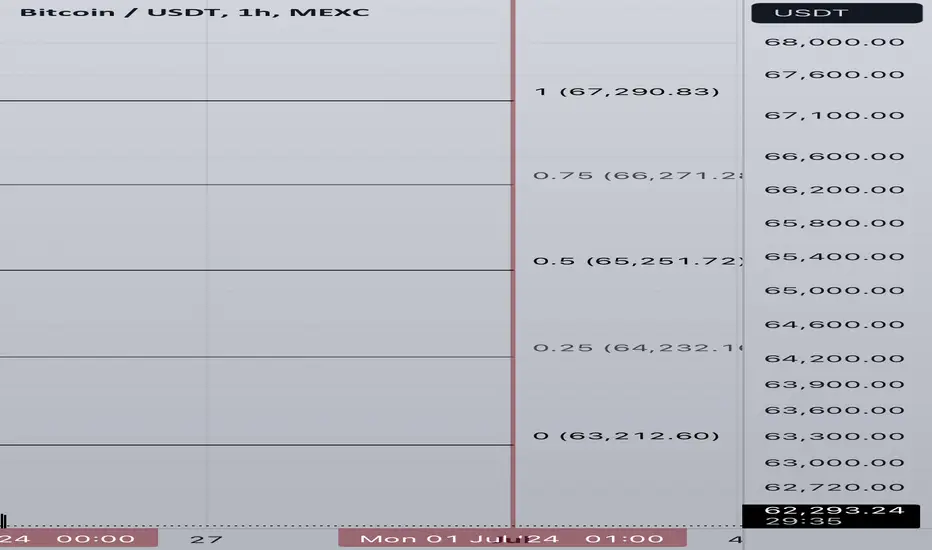
24/06/24 Weekly outlookLast weeks high: $67,290.83
Last weeks low: $62,212.60
Midpoint: $65,251.72
Despite the seemingly endless chop, last week was a very interesting one for BTC. Micro strategy added ~$800 worth of Bitcoin to their balance sheet, putting them at 226,000BTC, just over 1% of the entire BTC supply that will ever exist! In relation to microstrategy, Michael Dell has been sending some cryptic tweets reacting to the news that Saylor has added even more to their balance sheet. “Scarcity creates value” was his response. With the news that Dell is potentially buying or looking to buy Bitcoin it’s strange that BTC has dropped in price overall with overall sentiment in the space being very negative.
As we continue to slowly sell off and alt oins continue to get destroyed in both their stable and BTC pairs, I would like to see a clear capitulation wick with obvious strength on the bounce. It’s hard to say at what level that will come to, many are calling for GETTEX:52K which is a clear Bullish OB+, so it could be there however that would be devastating for all alt coins and may/probably have a bearish effect on the launch of the ETH ETF which is coming in the near future, 1/2 weeks.
For this week it’s purely about survival and looking for signs of capitulation, max fear and showing of strength following any potential sell offs. A slow bleed down within a range is very hard to catch the bottom but it would be better to see clear signs of reversal.
Economic Overview | The "Yellowstone Bubble"On Thursday, May 16th, I was sipping coffee and watching The Today Show , when a guest appeared on the program to talk about how much money YOU are supposedly making in your 401(k). Oddly enough the commentator - who was identified as the "chief business correspondent for CNN" - then reminded viewers that "you really should only look at your 401(k) once or twice a year"....
What?....WHAT?
My first thought: we don't need to be lectured on how often we should be checking on our retirement funds.
But this got me thinking, WHY do these "professional money managers" insist that working people not pay attention to their money??
I am speculating here, but I assume it is because retirement fund managers (large investment institutions) are also in the business of making money and therefore TAKING PROFIT.
Is there any evidence for this?... Well, yes:
Now factor in all of the nonsense that is constantly pumped by television commentators, meme stock pumpers, crypto fantasies, immature CEOs, and more recently - celebrities and professional athletes.
Have you ever stopped to think about the fact that there is a television commercial for $QQQ... Things have become so obscene that money managers are paying for airtime to deceptively lure regular people into buying their securities, so they can take profits, after already receiving bailouts. You've seen it, there are several versions of the same commercial and the narrative goes something like "I'm investing in QQQ for the future".
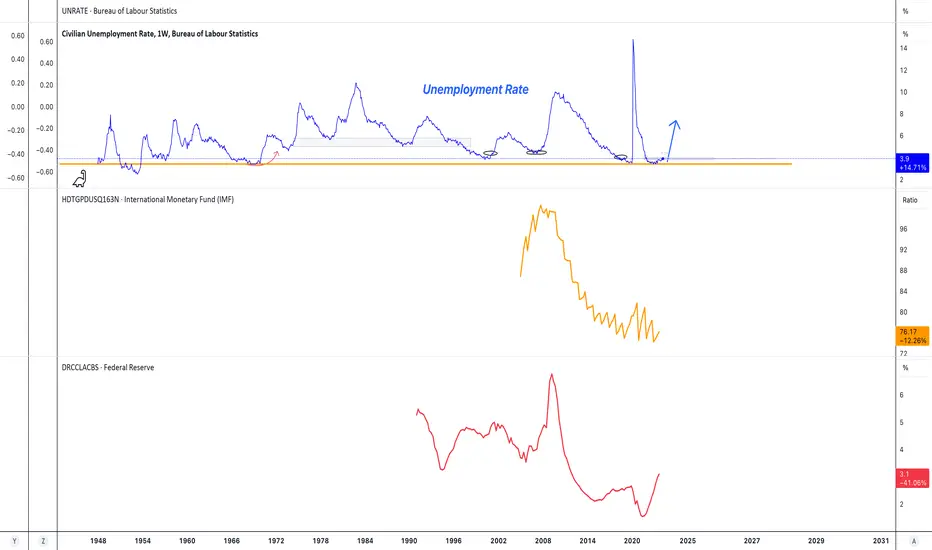
The Unemployment Rate has bottomed - there is no more growth to be had and even if we were to see unemployment trend below 3%, we can go back to the early 1950s and 1960s to see that financial markets really DON'T return much more below 3% unemployment; again this is because there is no more growth below 3% and therefore marginally less return.
Credit card delinquency is rising rapidly, thanks to inflation from Covid helicopter money.
And Household Debt-to-GDP has also bottomed. This one is particularly concerning because as we just explained, there is no more growth to be achieved from here (UNRATE). So, ask yourself: what happens if GDP falls ? Answer: household debt as a proportion of GDP rises by at leas that amount (it's a ratio - it has no choice). Expanding on this question, ask yourself: what happens if household debt continues to rise, amid maxed out unemployment? Answer: the already record profit-margins of investment banks increase to highly unstable levels, thereby further incentivizing profit-taking.
Anyway, I am calling this market the Yellowstone Bubble . Everyone is a rich tough-guy cattle rancher, everyone is a crypto professional, everyone thinks "Tesla is the future" (LOL), everyone is an AI expert, everyone is a pro because they scroll forums and listen to some podcast.
In a world that runs on "users" and "clicks" and web traffic, you must remain vigilant!
Take care!
Aggregate Rate of Return All 401(k) PlansThe purpose of this chart is to show how retirement funds are drained once returns reach 20%.
The reason this happens is because the purpose of the 401(k) is to prevent working people from ever reaching anything that resembles financial independence.
From the time we begin our careers to the time that we reach retirement age, we are CONSTANTLY told that if we do NOT use the 401(k), we are "leaving free money on the table".
But look at the chart.
The reality is: retirement funds get drained, people lose their life savings ('08), and big institutional funds (supposedly fiduciaries) get bailed out, WHILE YOU LOSE EVERYTHING YOU WORKED TO BUILD.
All I'm saying is: if you work with a "financial professional", you have a right to ask questions. You have a right to seek answers. You have a right to know what THEIR plan is for YOUR money.
Look at the S&P 500.
Ask your advisor: What causes these massive drops? Why does this occur? Am I protected?
I will build on this in my subsequent chart publishing.

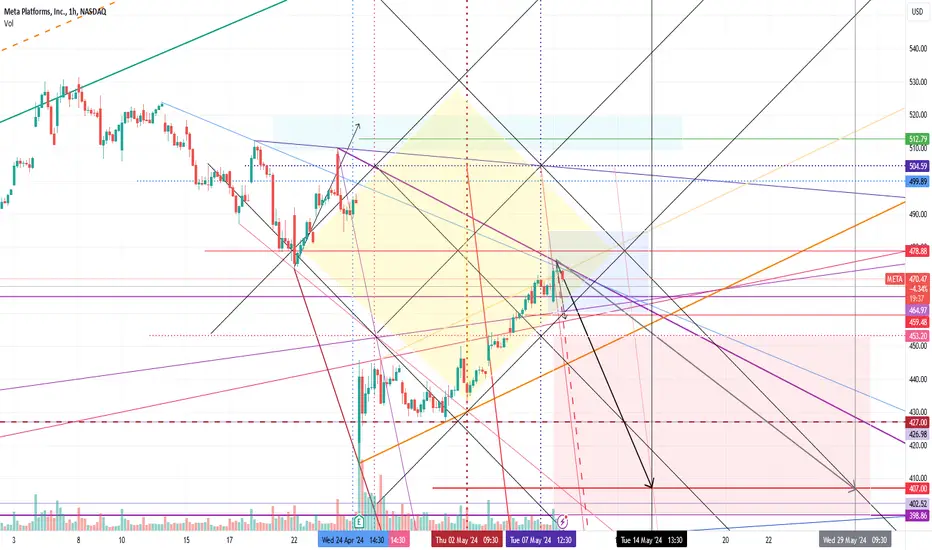
Test of 427 at Least (final TGR pt. 5)Loading July puts in the price range 460-485.
I will continue to accumulate puts in this zone until either of the 2 scenarios below occurs:
1) If price drops below 460 at any point
2) If price is still in this zone on 5/14 (next Tuesday)
If either of these occur my position will be complete.
Main/primary forecast:
- Reversal begins tomorrow 5/9, initial target is a break below 460 by 5/10
- Goal target = 427 by 5/17
Alt. forecast :
- META takes until 5/15 to break below 460
-Goal target = 427 by 5/31/2024
Stop Loss = close above 485
Not Fin. advice
--------------------------------------------------------------------------------------------------------------------
This is my last prediction for now in The Goat Returns series (a set of bearish ideas for the expected market drop over the coming weeks).
The other ideas in the series are linked below.
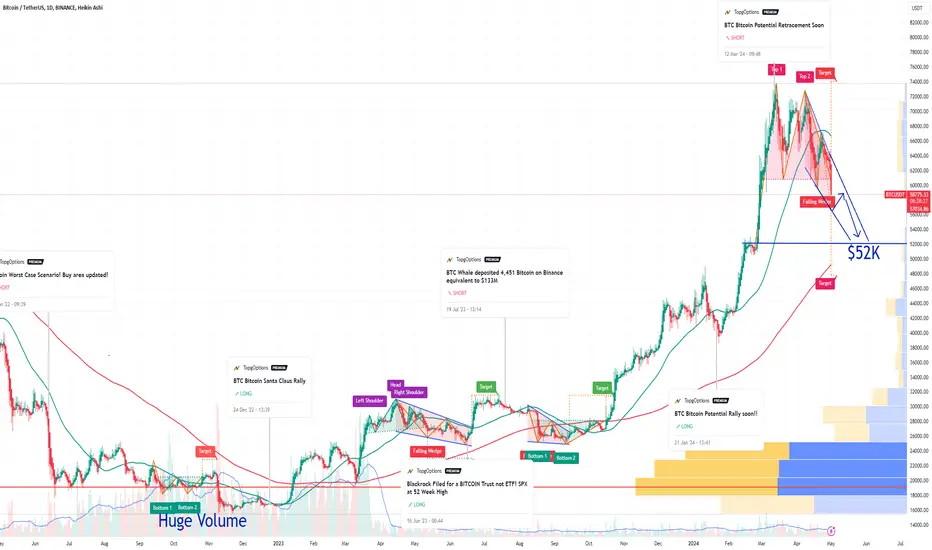
BTC Bitcoin Falling Wedge Price TargetIf you haven`t sold the top on BTC Bitcoin:
Upon examining the chart patterns, I believe the price target within the falling wedge is $52,000.
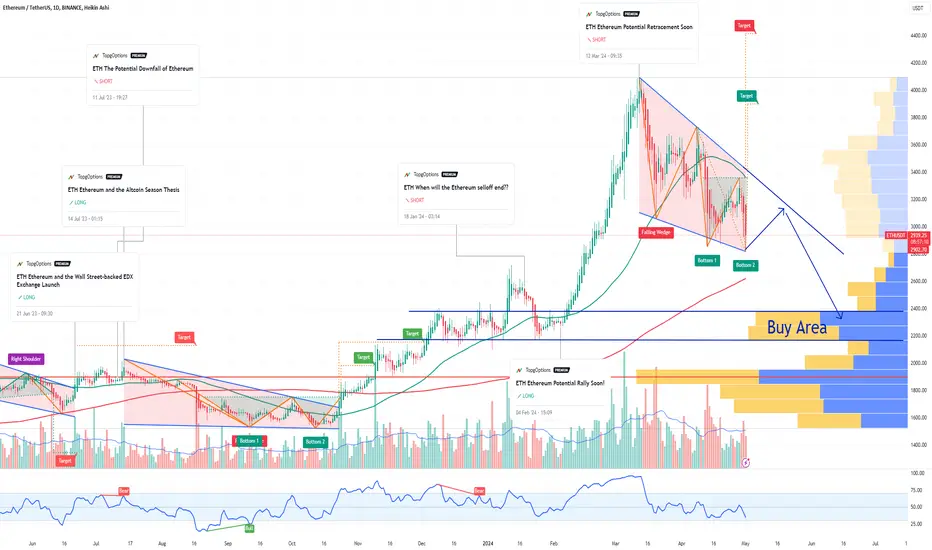
ETH Ethereum Selloff Price TargetIf you haven`t sold the top on ETH Ethereum:
After analyzing the chart patterns, I would define the revised buy zone as ranging from $2170 to $2370, as illustrated in the chart.
BNB Faces Potential Sell-Off Following CZ's Sentencing TodayThe news of Binance's billionaire founder, Changpeng Zhao, being sentenced to four months in prison after pleading guilty to charges of enabling money laundering at his crypto exchange could potentially trigger a selloff in BNB.
This development raises concerns about the governance and regulatory compliance within the exchange, which may lead investors to reassess the risks associated with holding BNB.
Uncertainties surrounding the impact of Zhao's absence on Binance's operations and future prospects could further contribute to downward pressure on BNB prices in the near term.
My price targets are: $510, $425 and $315.

Im back again Premium Gold idea $$$ Gold has experienced a significant sell-off in recent trading sessions, driven by a stronger US dollar, rising bond yields, and inflation concerns. This has created a challenging trading environment for day traders in XAU/USD. While some may see this as a buying opportunity, caution is advised as selling pressure could continue. Traders should do their own research and analysis before making any trading decisions in the volatile gold market.
Entry: 2312.74
SL; 2318.04
Target: is in the video $$$$
Like share and comment
Follow for more
#gold #XAUUSD #daytrading #selloff #USdollar #bondyields #inflationconcerns #tradingopportunity #volatility #tradingstrategy
Trade God out

RIO - BUYLooking at current price , RIO has climbing to the top of the range.
Going back and looking at price, it seems to like to reject when it is Overbought and fly when its Oversold.
- Buy @ $116
- Target for 8% with the possibility of a Sell off again

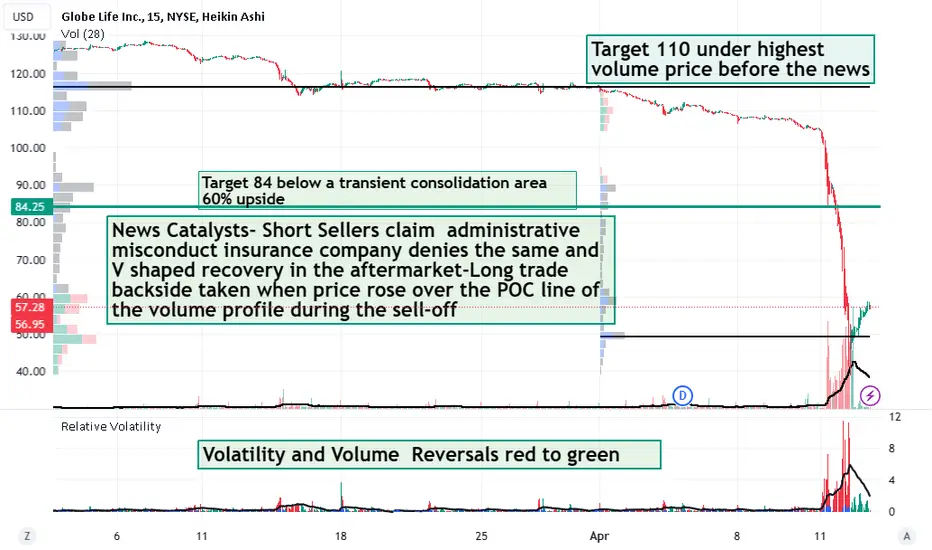
GL news catalyst backside trade LONGGL fell on bad news and started its recovery in the after-market hours. The idea is on the chart.
It shows how price action can be manipulated and how retail traders can play the manipulation.
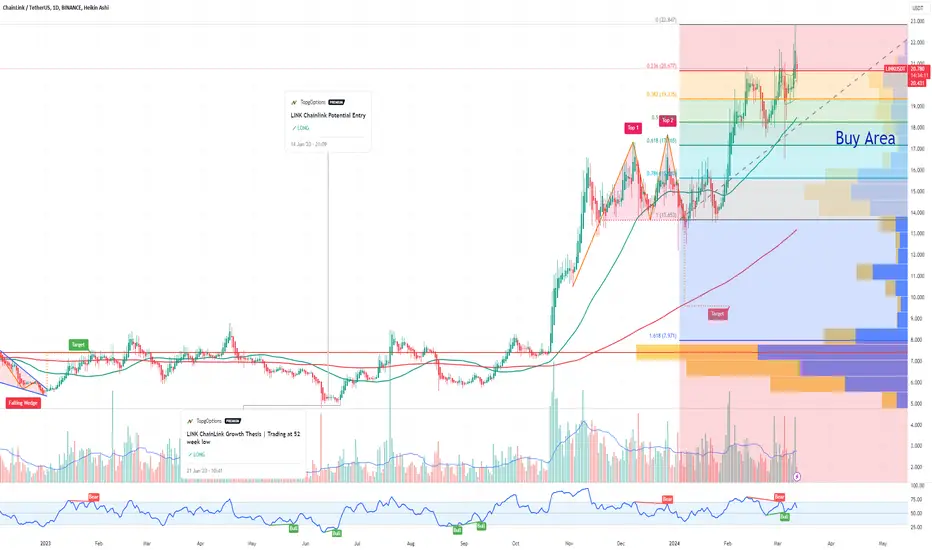
LINK Chainlink Potential Retracement SoonIf you haven`t bought the dip on LINK:
Then using the Fibonacci Retracement tool, I believe there will be a new buy opportunity in the $17 - $18 range!
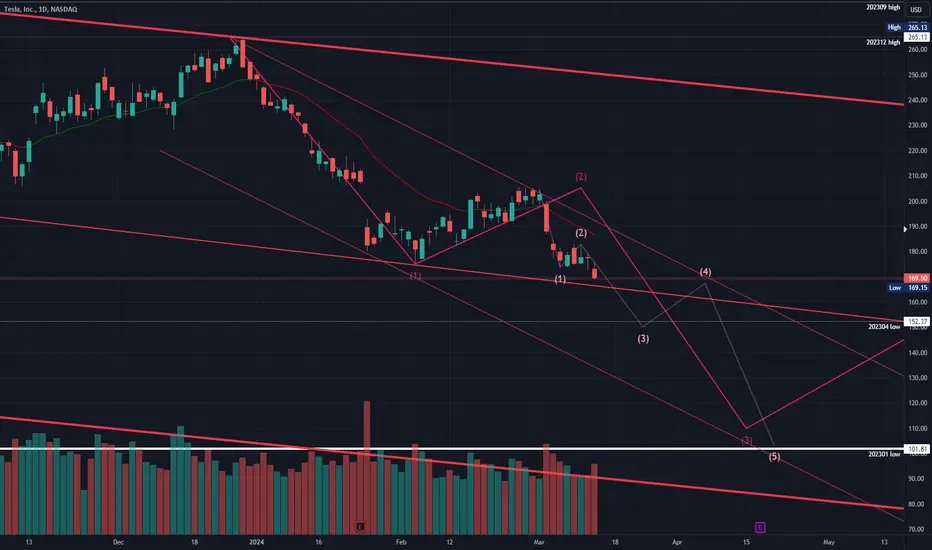
a weekly price action market recap and outlook - tesla #3Good evening and i hope you are well.
tl;dr: do or die here at 170 for the bulls. If we break below the bear channel line, bulls covering will fuel this further. Strongly bearish.
Last week i wrote the following:
"bear case: Price action wise was this a wedge bear flag which broke down and now market will test 175 if there are more buyers than sellers. Not rocket science so far."
I still did not adjust my wave thesis since 2024-02-11. I added a sub w5 for the bigger w3 to make it clearer what i expect the next weeks.
bull case: Do or die here at 170. The bear channel has to hold or we will flush down to around 150. If bulls manage to hold 170, we could probably see sideways movement to the upper bear channel, where i expect stronger selling again. Bulls can probably only stall the market until next earnings 2024-04-17 and pray for a elon miracle.
bear case: Nothing bullish about this stock at all. Bears are in full control and selling everything. If they manage to break below the bear channel, the long covering will accelerate it to 150 but probably not much further before earnings. If earnings are as bad as i expect, the remaining die hard bulls will give up. Except for Cathy. This stock and her fund will go down in 2024.
short term: below the bear trend line is hell for bulls - if we bounce here, probably sideways till earnings between 167 - 180
medium-long term: down - what would change that? trading above 270 --unchanged outlook
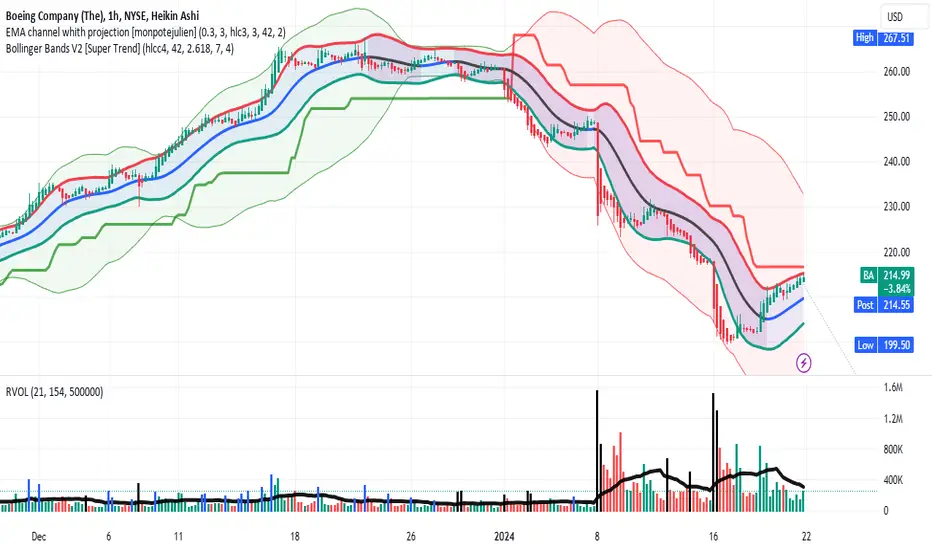
BA- Buy the recovery? or take partial profits? LONGBoeing had a near disastrous start to 2024 with a Malaysian part falling off a MAX jet at 36,000.
Incidentally, going viral is that an iPhone survived the plunge fully functional. 20% got
shaved off the market cap. I bought the low with calls at $215 expiring March 15'24. They did
80% for the week and 16% today. News catalysts are that an East Indian airline company placed
a contract for the purchase of 100 jets of uncertain model. Delta Airlines also did not pull their
existing contract. These catalysts have allowed price to recover about 1/3 of the plunge. The
15-minute chart demonstrates the super trend reversal better than the 60 minute which is
shown here on the idea. The relative volume indicator is about 3 X the running mean showing
trader interest uptick. BA could short squeeze where short sellers quickly buy to cover &
capture profit while the synergistic rise is compounded by near buyers coming in to get ahead
of the chasing? The caution is that the POC line on the intermediate
term volume profile is $ 210 and so getting contracts extended above that has increased
risk based on price distance from the POC. The uptrend instead of a true recovery could be
simply a correction in the overall downtrend. I will take some of the week's profit off
the table and keep a close watch on the price action.
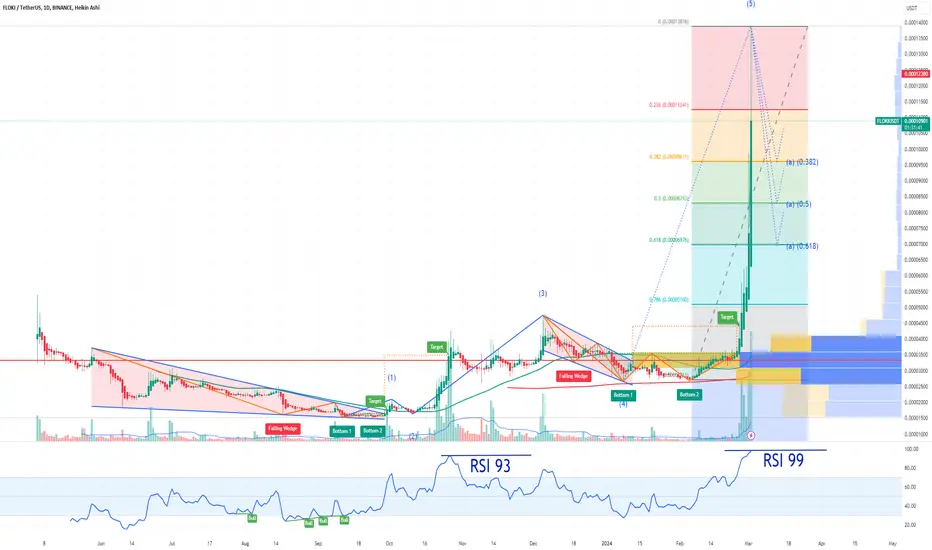
FLOKI Potential Correction Soon ! RSI at 99If you haven't read my article about meme coins:
Then the heightened RSI level of 99 for FLOKI signals a potential correction on the horizon.
Such an extremely high RSI often indicates overbought conditions, suggesting that the asset may be due for a pullback.
The price target, as per the Fibonacci retracement tool, is: $0.00000697