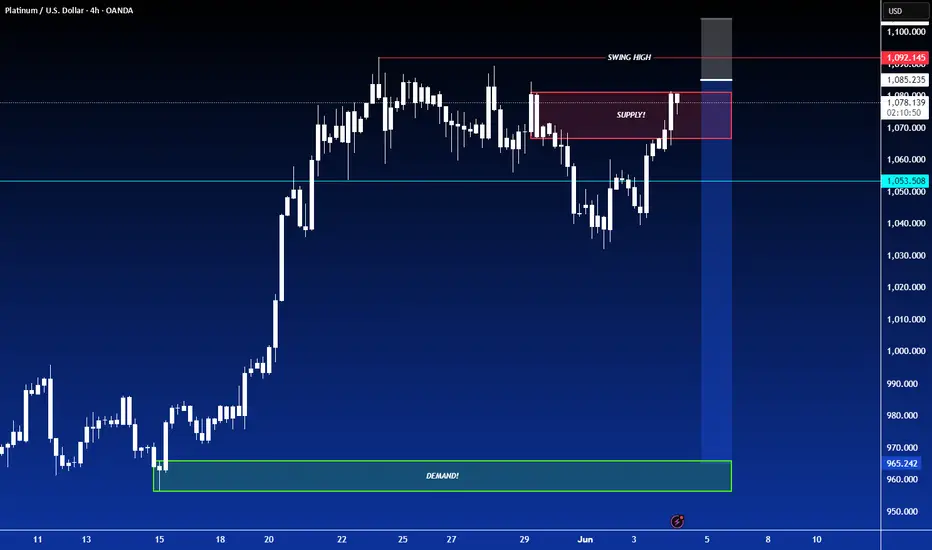
SHORT ON XPT/USD PLATINUMXPT/USD Platinum has given us a choc (change of character) to the downside from a recent push up.
It has currently completed the pullback of that new change to the downside and I expect it to fall from the supply area/zone to the next level of demand.
Lost of imbalance to the downside making this trade a nice setup.
Sellsetup
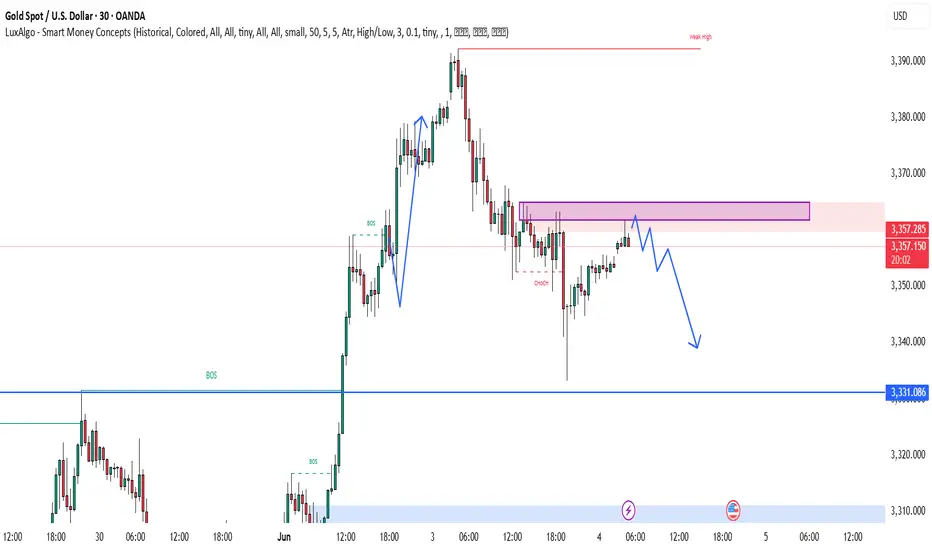
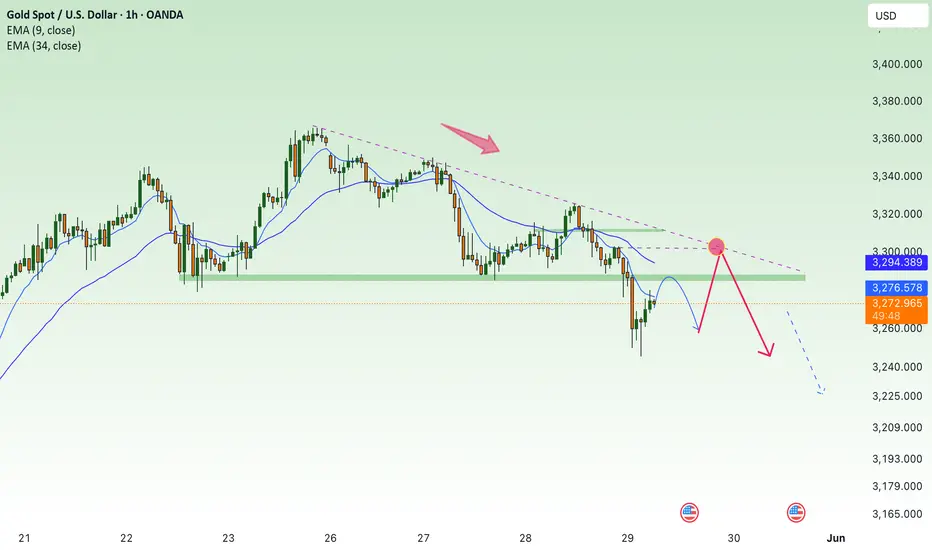
BEST XAUUSD M30 SELL SETUPNFOR TODAY 📉 Gold Analysis Summary – Bearish Setup Alert ⚠️
Gold is currently showing signs of weakness after a strong bullish push. A Change of Character (CHOCH) has confirmed a potential shift in trend. Price is approaching a supply zone (highlighted in purple), and rejection from this level could trigger a downward move. 🔄 The projected path suggests a potential lower high formation, followed by a drop towards the 3,348 and 3,331 key demand levels. 🧠 Watch for bearish confirmation near resistance before entering short positions. 📊💥
Crude oil futures Trade the range In this video I look at the current range that we are in and I have laid out a plan in the scenario that we break that range to the upside and what we could possibly expect .
I have given some reaction zones where I anticipate price to react when we reach there .
I have used Fibonacci, volume profile, and vwap in this video .
Thankyou for your support

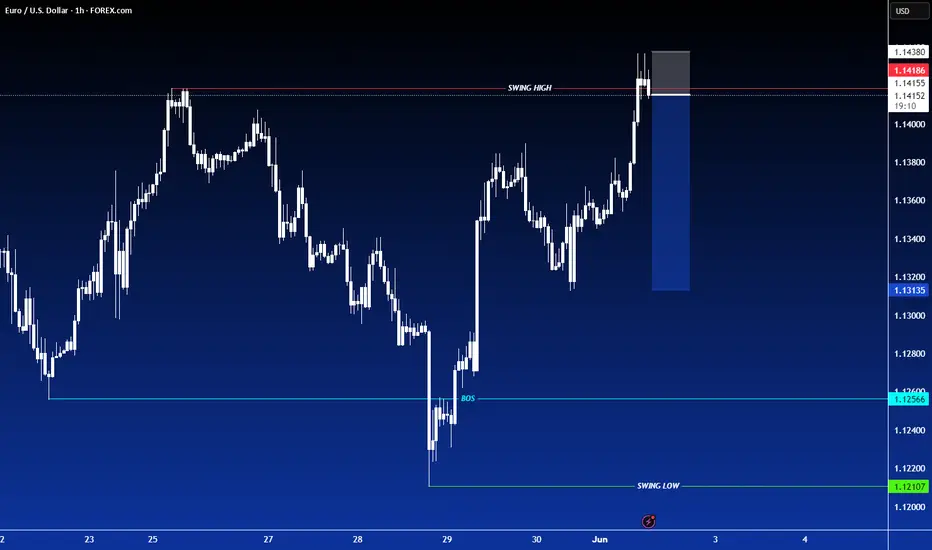
SHORT ON EUR/USDEUR/USD has just swept a previous high and has plenty of liquidity to the downside to capture.
I will be selling EU to the next swing low looking to catch 80-100 pips.
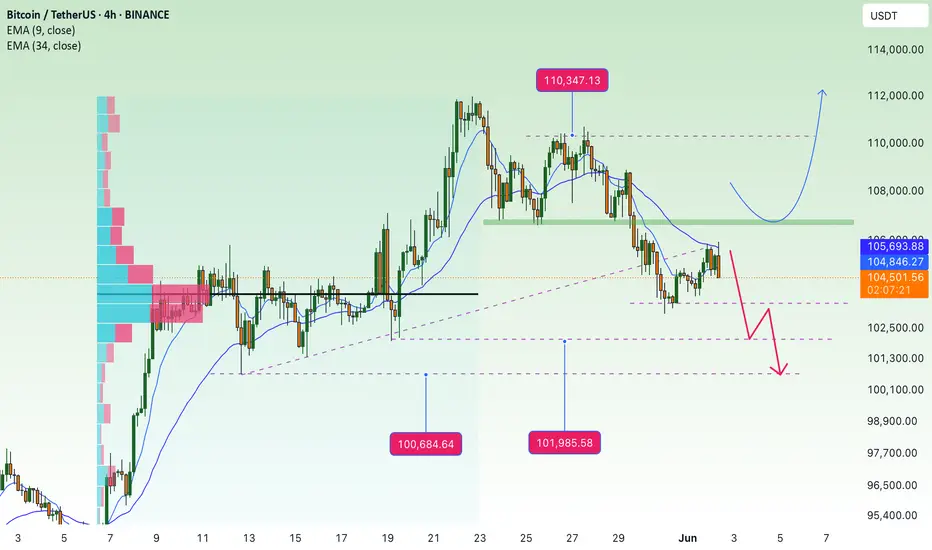
BTC short term correction: zone 100k💎 BTC PLAN UPDATE (June 2)
NOTABLE NEWS ABOUT BTC:
Meta shareholders have decisively voted down a proposal to explore adding Bitcoin to the company’s balance sheet, signaling limited appetite for crypto exposure at the tech giant.
According to a regulatory filing dated May 28, the “Bitcoin treasury assessment” proposal garnered just 3.92 million votes in favor — representing a mere 0.08% of total shares — while nearly 5 billion votes against it.
Given that CEO Mark Zuckerberg holds 61% of Meta's voting power, as disclosed in an April filing, it is likely he played a pivotal role in rejecting the measure.
TECHNICAL ANALYSIS PERSPECTIVE
Bitcoin closed below the daily support level of $106,406 on Thursday and fell another 1.50% the following day. However, prices saw a slight recovery over the weekend. As of Monday's writing, BTC is trading below $105,500.
Assuming BTC faces resistance around the $106,406 daily level and continues correcting, it could extend the decline to retest the psychologically important $100,000 mark.
The Relative Strength Index (RSI) on the daily chart is at 53, trending down toward the neutral level of 50, indicating weakening bullish momentum. The Moving Average Convergence Divergence (MACD) also showed a bearish crossover last week. The increasing red histogram bars below the baseline further signal a potential correction ahead.
At this point, whether you are new or experienced, it’s advised to spend more time practicing and enhancing your knowledge of technical analysis. Consider exploring educational posts on the channel (…) to strengthen your foundation and avoid losses during this period.
==> This is a trend-based analysis for reference only. Wishing all investors successful trades!
Tapped In & Tapped Out – Smart Money’s About to Dump AUDUSDAUDUSD has just executed a classic liquidity raid, sweeping a short-term high into a high-probability 1H Order Block (OB) — which also aligns with the continuation move that broke prior structure to the downside.
This OB sits directly above equal highs that served as a clear magnet for buy-side liquidity — a textbook inducement for retail breakout traders. Smart money logic suggests these stops were used to fill sell orders.
Notably, there’s a Fair Value Gap (FVG) resting just below, which increases the probability of a displacement move to the downside. We now expect price to deliver into the Sellside Liquidity (4H) resting beneath the equal lows, a highly attractive draw on liquidity from an institutional perspective.
Key Confluences
✅ 1H OB tapped with precision
✅ Buy-side liquidity swept via equal highs
✅ Clear FVG imbalance below
✅ Sellside liquidity target aligned with equal lows
✅ Weekly bias still leans bearish
This is a high-probability setup when following ICT/SMC principles — refined entry, defined target, clean structure.
🔍 Watch for:
A clean bearish displacement from current levels
Potential lower timeframe confirmations (BOS/CHoCH) for tighter risk entries
📌 Target: 0.64071
🧠 Bias: Bearish
⚠️ As always — DYOR (Do Your Own Research). Institutional concepts work best with context and personal backtesting.

Nasdaq Signals Economic Instability – Are You Watching CloselyDear traders,
You may be witnessing a “first” — a pivotal moment right before things begin to spiral.
We’re not fortune tellers. We don’t claim to predict the future.
But what you’re about to read is based entirely on publicly available data, interpreted not through speculation, but through a deep, rational analysis of interconnected facts — the kind of connections that most overlook, and few dare to question.
We may not know how the future is being orchestrated behind the scenes...
But one thing seems certain: crisis always comes first... and then we are given a narrative to justify it — be it war, a pandemic, or a "global emergency."
This is the correct sequence... and it’s the one they never teach you.
Yet for those of us who navigate the financial markets, one question matters more than all others:
How do we profit from this?
We recently shared an important setup on the Nasdaq index, the benchmark that reflects — to a large extent — the true state of the U.S. economy.
As a proxy for the 100 largest American corporations, the Nasdaq plays a critical role in signaling macro trends.
And while some are just now waking up to the storm ahead, our outlook has been clear since October 2022:
A major economic crisis was not only probable… it was inevitable.
Some analysts chalk this up to uncontrolled money printing post-2019 as governments tried to patch the damage from the COVID-19 crisis. That’s one explanation.
But at Glich, our vision is different.
More complex.
And for now… not something we can fully release.
For years, strong correlations between risk markets — especially U.S. equities and crypto — held firmly in place.
But something changed on May 30th, 2025. Completely and unmistakably.
The link was severed.
Now ask yourself:
Why was Bitcoin created in the first place?
It wasn’t just digital money.
It was a bold, revolutionary idea. A system designed for a future economy no longer shackled by inflation, central banking failures, or hidden agendas.
A fluid, transparent, and secure network for a world in desperate need of change.
The current financial model is obsolete. It’s no longer evolving — just surviving.
And it can no longer answer the challenges of what's to come.
2008 was not the collapse; it was the setup. A convenient pretext to slowly roll out something new.
And "Satoshi Nakamoto"? Well, let’s just say...
That name means more than you think.
"HIDDEN INFORMATION" 👁️
What does NEO mean when he says:
"This has all happened before… yet it’s happening for the first time"?
And what does that have to do with us?
This analysis is not just about charts or setups.
It’s a hidden message — a spotlight on a once-in-a-generation opportunity lying in plain sight.
But not everyone is trained to read between the lines.
Let us ask:
Why was Donald Trump specifically pushed into position?
Why is crypto — after being suppressed, banned and attacked worldwide — now being quietly promoted and fast-tracked in legislation during 2024 and 2025?
Something’s moving beneath the surface.
🔍 In summary:
Expect a tidal wave of global crypto legislation to pass in the coming days/weeks/months.
Crypto — particularly BTC and ETH — will become silent stores of value during the economic storm.
Expect record-breaking levels:
400
K
f
o
r
B
i
t
c
o
i
n
∗
∗
,
∗
∗
400KforBitcoin∗∗,∗∗40K for Ethereum.
Yes, this may sound like science fiction…
But keep your eyes and ears wide open. 👁️
And brace yourself for a historic collapse in U.S. equities. Possibly… something we’ve never seen before.
The show is starting.
And we won’t spoil the ending — because watching it unfold is part of the experience.
But here’s what we can say, thanks to our proprietary algorithmic system:
The U.S. economy will bleed.
And crypto will blow past expectations — fulfilling the very purpose it was built for.
🛒 Load your bags in the coming days...
Because when this train leaves the station —
It won't be stopping for anyone.

SUI analysis In this video I go through the recent bullish trend in SUI and anticipate where I think the retrace will take us for a possible long entry . I also highlight a possible short setup off of the Value area high if it comes in .
Tools used in the video TR Pocket / Fibs , Volume Profile and Pivots .
Appreciate your support any questions then please leave them in the comments
Have a great day

INTEL INTC Short setup target 15.29Fibonacci technical analysis : Intel Corporation NASDAQ:INTC has already found resistance at the Fib level 61.8% (23.07) of my Down Fib. The May 30th Daily candle has closed below retracement Fib level 23.6% (19.73), confirming a sell signal. A Bear Flag pattern has also formed. My Down Fib guides me to look for NASDAQ:INTC to eventually go down to hit first target at Fib level -27.2% (15.29).
NASDAQ:INTC – Target 1 at -27.2% (15.29), Target 2 at -61.8% (12.26) and Target 3 at -78.6 (10.79)
Stop loss slightly above the 50.0% retracement Fib level (22.04).
Enjoy the trading process and take time to smell the roses🌹

BEST XAUUSD M30 BUY & SELL SETUP FOR TODAY 📉📊 Gold (XAU/USD) Technical Outlook – Key Decision Zone Incoming! ⚠️📈
Gold prices are currently testing a crucial support zone around 3,251, following a strong bearish momentum. As shown on the M30 chart, the market is now at a make-or-break level, where two potential scenarios could unfold: either a bullish reversal toward the 3,280–3,300 area if price holds and confirms support ✅, or a bearish continuation if the level breaks, pushing price lower toward 3,220 or beyond ❌. Traders should watch for price action signals and wait for a clear breakout or strong bounce confirmation before entering any trades 🧠🔍. This is a high-volatility reaction zone — trade smart! 🎯📉📈

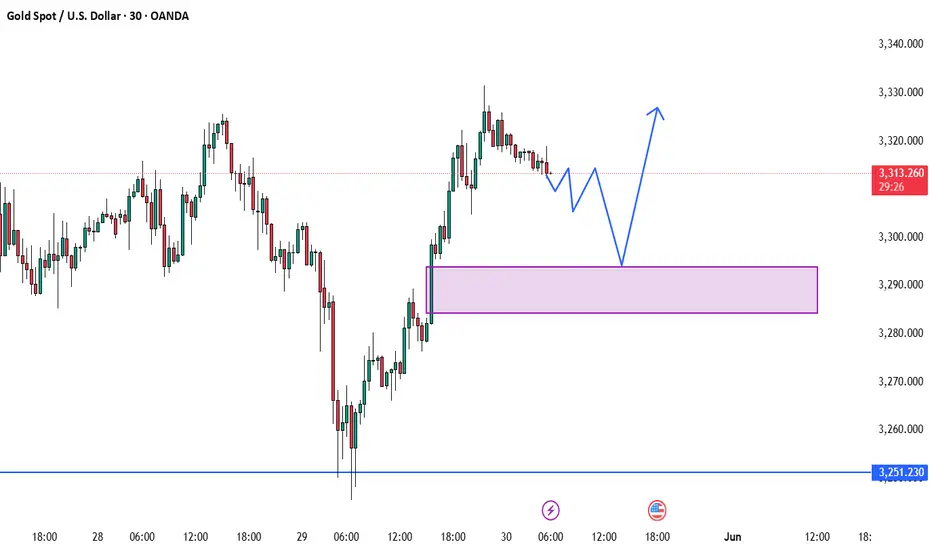
BEST GOLD M30 BUY SETUP FOR TODAY📉 Gold is currently showing signs of a potential pullback towards the key demand zone around 3,290–3,285 marked in purple. This area has previously acted as a strong support and could trigger a bullish reversal if price reacts positively here. 🟪 Once the price enters this zone and forms a bullish confirmation (like a rejection wick or bullish engulfing candle), we could see a strong upward move targeting 3,320+ 📈. Traders should stay alert for buying opportunities from this zone and avoid chasing the price before a clear confirmation! 🎯⚡
Selling pressure, gold price falls below 3300⭐️GOLDEN INFORMATION:
Gold prices continued to retreat during Wednesday’s North American session, slipping below the $3,300 mark after reaching an intraday high of $3,325 earlier. The pullback, amounting to a 0.27% decline, came as traders absorbed the implications of the latest Federal Reserve (Fed) meeting minutes.
During the May 6–7 policy meeting, the Fed opted to leave interest rates unchanged, highlighting growing uncertainty surrounding the economic impact of proposed tariffs. Officials maintained a cautious stance, citing heightened risks of both inflation and unemployment—potential consequences of trade disruptions.
The minutes also reflected concerns over stagflation, with policymakers noting that “the Committee may face challenging trade-offs if inflation proves more persistent while growth and employment expectations deteriorate.”
⭐️Personal comments NOVA:
The downtrend line remains intact, gold prices are trading around below 3300. The tariff backdrop remains largely unchanged.
⭐️SET UP GOLD PRICE:
🔥SELL GOLD zone : 3311- 3313 SL 3318
TP1: $3300
TP2: $3290
TP3: $3280
🔥BUY GOLD zone: $3205- $3207 SL $3200
TP1: $3218
TP2: $3230
TP3: $3248
⭐️Technical analysis:
Based on technical indicators EMA 34, EMA89 and support resistance areas to set up a reasonable SELL order.
⭐️NOTE:
Note: Nova wishes traders to manage their capital well
- take the number of lots that match your capital
- Takeprofit equal to 4-6% of capital account
- Stoplose equal to 2-3% of capital account
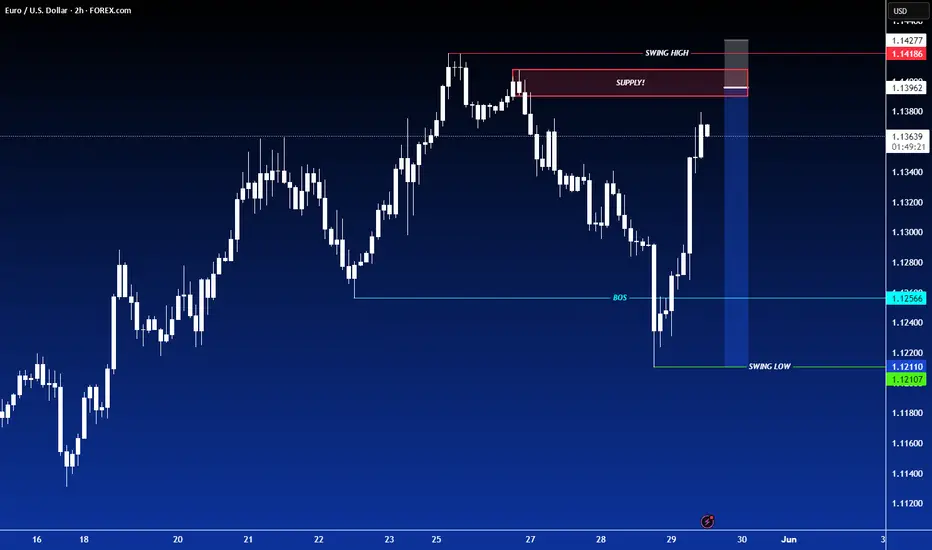
SHORT ON EUR/USDEUR/USD has pulled back to a major supply zone that previously formed a DOUBLE TOP in that area in the past. (This is technically the re-test)
I have placed a sell limit order in the supply area and I will be expecting EUR/USD to fall past the swing low for over 100 -150 pips.
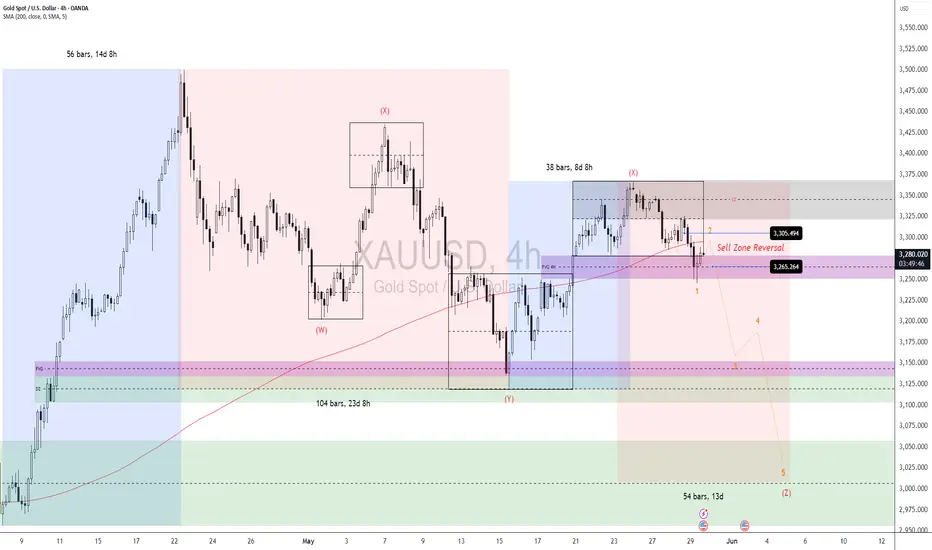
XAUUSD: Mid-Term Swing Sell OpportunityXAUUSD: Mid-Term Swing Sell Opportunity
While Gold's (XAUUSD) larger timeframe remains bullish, the intermediate trend has turned bearish. This shift is clearly signaled by a break below previous lows and the formation of a clean Head and Shoulders reversal pattern.
Currently, price is testing a strong support confluence at a Fair Value Gap (FVG) and a Demand Zone below.
Strategy: Bounce & Sell
Our strategy is to sell into bounces (short on rallies). Key resistance levels to watch for reversal
signals include:
3300: Coincides with the Range Volatile Day High.
3325 - 3350: This is a significant Supply Zone.
We will wait for bearish candlestick patterns and reversal patterns to confirm the move down at these resistance areas.
Downside Targets
Our primary downside targets are:
3150: Aligns with the Range Volatile Week Low.
3100: If this level breaks, we'll then look towards the final support at 3000, potentially forming a Triple Zigzag (WXYXZ) corrective structure.
From a time perspective, we anticipate this bearish phase to last approximately 13 days, in line with Fibonacci Time Cycle analysis.
Crucial Considerations
Effective Money Management is paramount. Ensure your position sizing is appropriate for the expected volatility range. Always be prepared to adapt your view when the price structure clearly invalidates the current bearish setup.
Trade carefully and profitably.
C.Goii Super Trader
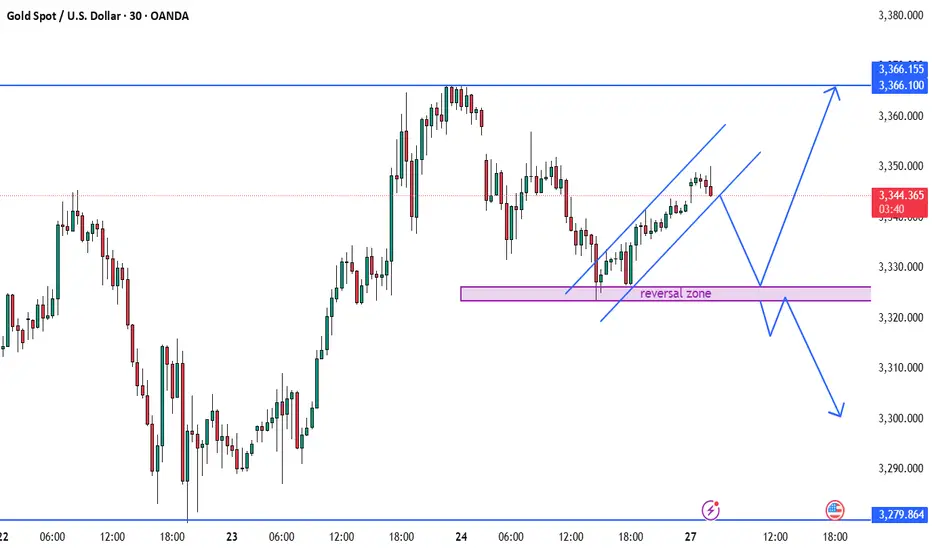
BEST XAUUSD M3 BUY AND SELL SETUP FOR TODAY 📊✨ Gold (XAU/USD) Technical Outlook – 30-Min Chart ✨📉
Price is currently trading within a rising channel after a bounce from the marked reversal zone 💜, suggesting a short-term bullish trend 📈. However, the chart outlines two key scenarios: if price breaks out upward, we may see a move towards the 3,366 resistance zone 🔼. Conversely, if the channel fails and price breaks downward, a retest of the reversal zone could trigger a deeper bearish move 📉, potentially targeting the 3,300 area or lower. Traders should watch for confirmation at key levels and react accordingly — not predict impulsively. 🧠⚖️📍
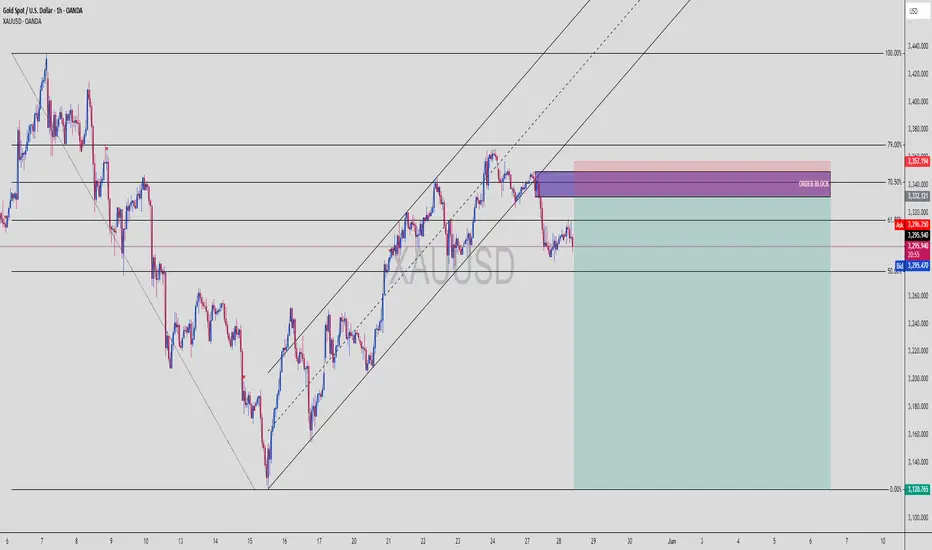
XAUUSD | Institutional Sell Setup – OB + 79% Fib Confluence🪙 XAUUSD | Gold Sell Setup Based on Smart Money Concepts
This is a classic example of how institutions lure in retail traders — tap the golden zone, reject hard, and leave a trail of liquidated longs.
🔍 1. Technical Breakdown
Price aggressively climbed into a strong Order Block zone
Rejection from the 70.5%–79% Fibonacci retracement area
Broken ascending channel confirms shift in momentum
Bearish BOS already occurred = Smart Money in control
This zone (3332–3357) is a magnet for institutional sells.
🧱 2. Bearish Confluences
💀 OB Rejection: Previous up candle before the sharp drop
📐 Fib Overlap: 70.5–79% = premium zone for shorts
📉 Structure Shift: Channel break + bearish order flow
⚠️ No Candle Close Above OB: = market respecting supply
🎯 3. Trade Plan
Entry: 3332–3357 (executed)
Stop Loss: 3360 (above OB)
Take Profit: 3120 zone
This is a deep sell-side liquidity hunt.
⚖️ 4. RRR (Risk-Reward Ratio)
📥 Entry: ~3345
🔒 SL: 3360
💰 TP: 3120
✅ RRR ≈ 1:15
This is a "swing short with conviction" kind of setup, where patience = profit.
🔁 5. Key Confirmation Points
Watch for lower lows and lower highs to continue
Price closing below 3290 = full confirmation
If Gold reclaims 3360 = setup invalidated
💬 Comment “Sniped Gold 🥷💰” if you took this short!
📌 Save this chart for OB + Fib zone study
🎯 Post your entry/exit levels — let’s compare setups
Selling pressure, gold price continues to fall below 3285?⭐️GOLDEN INFORMATION:
Gold prices declined by nearly 2% on Monday, slipping below the $3,300 mark, as investor sentiment improved following U.S. President Donald Trump’s decision to postpone tariffs on European Union imports. The renewed risk appetite, coupled with a modest rebound in the U.S. Dollar from last week’s losses, placed pressure on the non-yielding precious metal.
The move came after a weekend call between President Trump and European Commission President Ursula von der Leyen, which resulted in the U.S. deferring the planned 50% tariffs on EU goods until July 9. The development eased global trade concerns, prompting a shift away from safe-haven assets—excluding the Greenback—and helped propel global equity markets higher.
⭐️Personal comments NOVA:
Accumulated price zone around 3300, under selling pressure, mainly waiting for important economic news this week: GDP, FOMC
⭐️SET UP GOLD PRICE:
🔥SELL GOLD zone : 3363- 3365 SL 3370
TP1: $3352
TP2: $3340
TP3: $3325
🔥BUY GOLD zone: $3266- $3268 SL $3261
TP1: $3277
TP2: $3286
TP3: $3300
⭐️Technical analysis:
Based on technical indicators EMA 34, EMA89 and support resistance areas to set up a reasonable SELL order.
⭐️NOTE:
Note: Nova wishes traders to manage their capital well
- take the number of lots that match your capital
- Takeprofit equal to 4-6% of capital account
- Stoplose equal to 2-3% of capital account

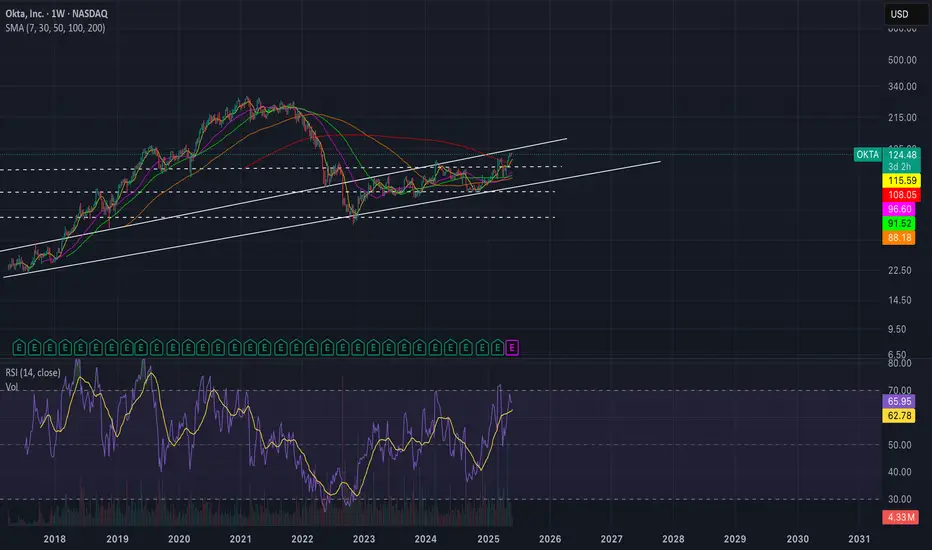
$OKTA Gen AI tailwinds are not materializing as of now!- I'm a seller of NASDAQ:OKTA at $124 . Company was undervalued at 70s but has run so much without tangible materializing Gen AI tailwinds.
- Theoretically, Agentic AI should have been a great tailwind for SSO but it appears that industry is not yet focussed on security aspect of it when it comes to agentic AI.
- Even on application level, companies are struggling with developing orchestration framework and deploying them at Scale.
- Risk/Reward is not suitable for me to stay long. Short or Avoid/sell $OKTA.
- I might change my mind if they prove themselves today May 27, 2025.
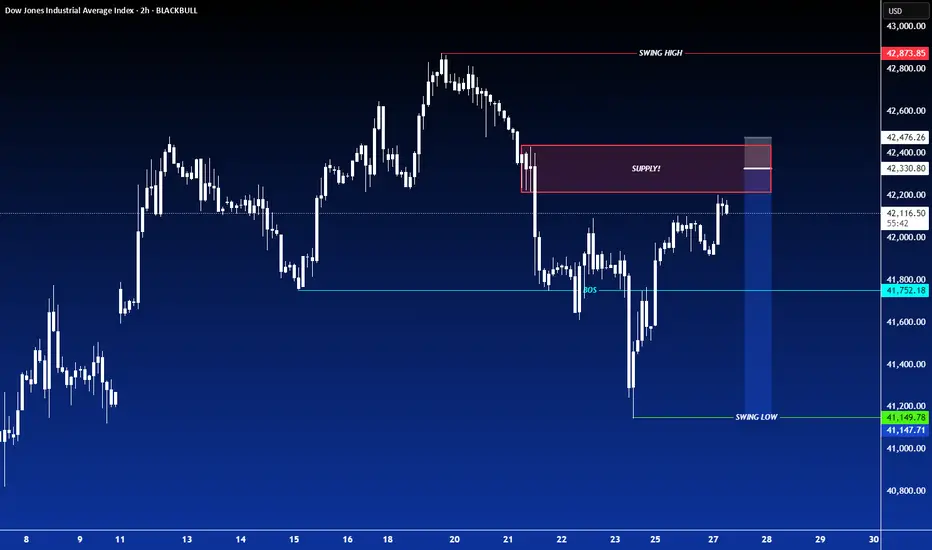
SHORT ON US30US30 Has given us a nice pullback to a major supply area.
I am expecting price to rise a little higher into the supply are then give us a major drop to the previous swing low for over 1000 points!!!
I have placed a sell limit order withing the supply area looking to short us30 for the rest of the week.
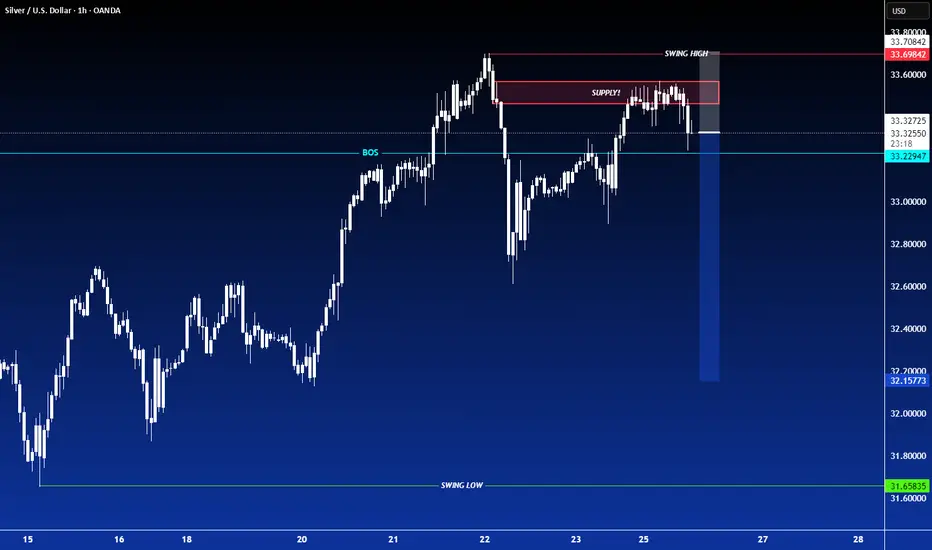
SHORT ON SILVERSilver is coming off a lower high and looks like it will start its run push to go and break previous lows to the downside.
Top M30 XAU/USD Trade Setups for Today – Buy & Sell Opportuniti📊📉📈 Gold (XAU/USD) is currently trading within a key support zone 🟣, retesting after a previous bullish breakout. If the price holds this zone and forms strong bullish candles, we could see a move toward the 3,366 resistance level 🔵 and potentially higher toward 3,389 📈. However, if the price breaks below this zone with strong bearish momentum, a drop toward 3,280 🔽 becomes likely. Watch the price action closely within this zone, as it could lead to a decisive move. ✅ Patience and confirmation are crucial to avoid false breakouts. 💡

GBPJPY SELL Analysis Idea!!!!⸻
Pair: GBPJPY
Timeframe: 1 Hour (1H)
Bias: Bearish (Sell Setup)
⸻
Technical Analysis:
1. Price Structure & Market Context:
• The chart shows a clear downtrend from the previous swing high near 196.000.
• Price has since formed a lower high within the red supply zone, reinforcing bearish pressure.
• Several liquidity grabs and rejections are visible near the red supply zone, indicating sellers are defending this level aggressively.
2. Key Zones & Levels:
• Supply Zone (Red Area): 193.243–193.594 — significant selling pressure observed.
• Buyers Above Zone: Price has failed to sustain above 193.243 despite attempts, confirming bearish strength.
• Break of Structure (BOS): At 192.824, confirming bearish momentum.
• Support Zones (Green Areas):
• First target area: 192.307
• Second target area: 191.272 — potential extended target if momentum continues downward.
3. Entry & Confirmation:
• Current Price: 193.168
• Price is rejecting the supply zone and failing to break above the 193.243 resistance line.
• Confirmation of sell setup co mes from:
• Bearish rejections at supply
• Price forming a lower high (193.100 HL level)
• BOS and retest pattern playing out
4. Trade Plan (Sell Idea):
• Sell Entry: Between 193.150–193.243 (rejection zone)
• Stop Loss: Above 193.594 (invalidate the supply zone rejection)
• Take Profit 1 (TP1): 192.307
• Take Profit 2 (TP2): 191.272 (extended target)
⸻
Confluence Factors:
• Price is respecting supply zone.
• Repeated bearish rejections and liquidity sweeps above key levels.
• BOS supports shift in structure to bearish.
⸻
Conclusion:
GBPJPY is showing strong signs of bearish control, with multiple rejections from the supply zone and a BOS indicating momentum shift. A sell from the current levels offers a good risk-to-reward setup, targeting the support zones below.

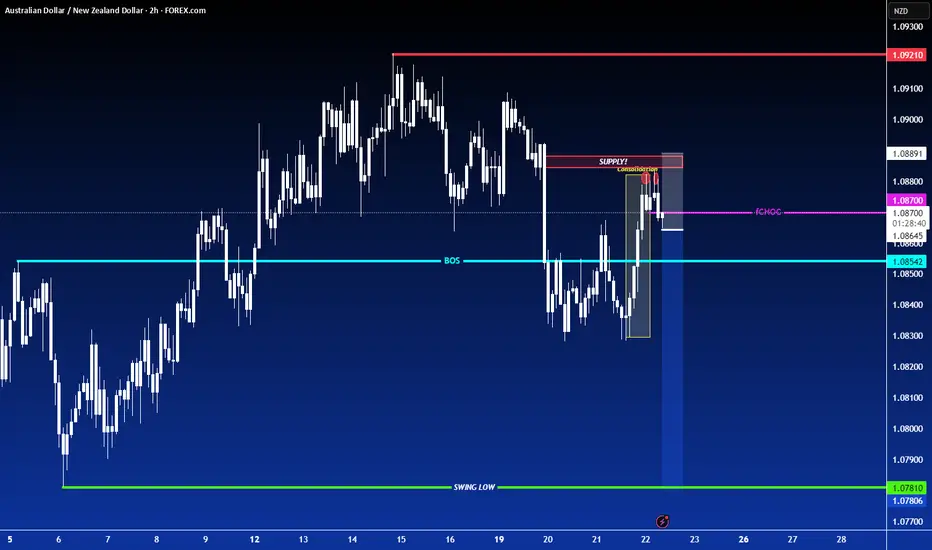
SHORT ON AUD/NZDAUD/NZD has a double top that formed after sweeping the Asian highs.
I will be selling this pair looking to make 50-80 pips.