Gold prices start to cool down - back to 3000✍️ NOVA hello everyone, Let's comment on gold price next week from 04/07/2025 - 04/11/2025
🔥 World situation:
Gold (XAU) prices deepened their decline on Friday, sliding to a seven-day low of $3,015 before rebounding slightly, after remarks from Federal Reserve (Fed) Chair Jerome Powell suggested that inflation may accelerate again due to the impact of tariffs. At the time of writing, XAU/USD is trading at $3,029, representing a 2.70% drop.
Market volatility persisted as tensions escalated in the ongoing trade conflict between the United States (US) and China. In addition, Powell dampened hopes for imminent Fed rate cuts, stating that tariffs are expected to affect the US economy by slowing growth and pushing inflation higher.
According to a Financial Times (FT) report, hedge funds faced their largest margin calls since the Covid-19 pandemic, triggered by President Trump’s Liberation Day announcement.
🔥 Identify:
The FOMO increase in gold prices is starting to show signs of stopping due to concerns about economic recession. Gold prices will continue to decline back to the price range below 3000, stabilizing the market again.
🔥 Technically:
Based on the resistance and support areas of the gold price according to the H4 frame, NOVA identifies the important key areas as follows:
Resistance: $3054, $3076, $3105, $3135
Support : $2998, $2953
🔥 NOTE:
Note: Nova wishes traders to manage their capital well
- take the number of lots that match your capital
- Takeprofit equal to 4-6% of capital account
- Stoplose equal to 2-3% of capital account
- The winner is the one who sticks with the market the longest
Sellsetup
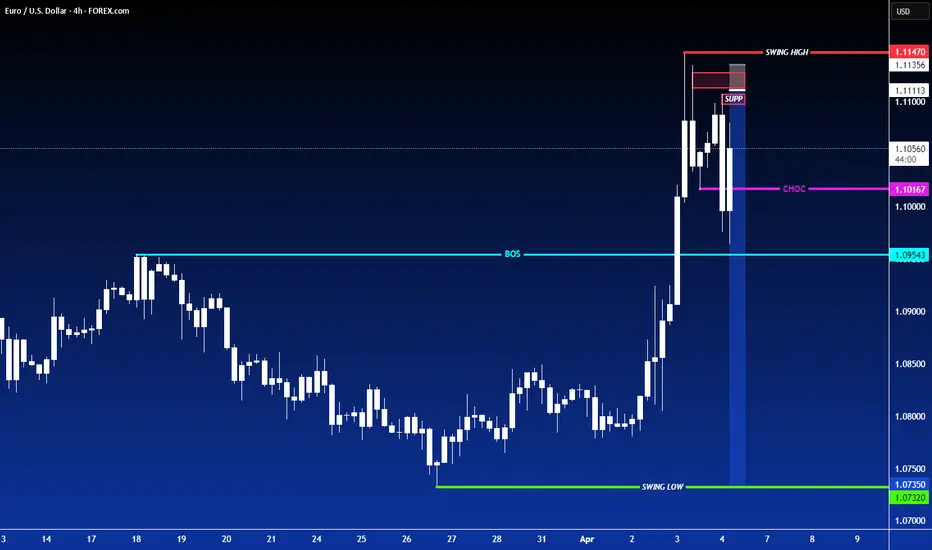
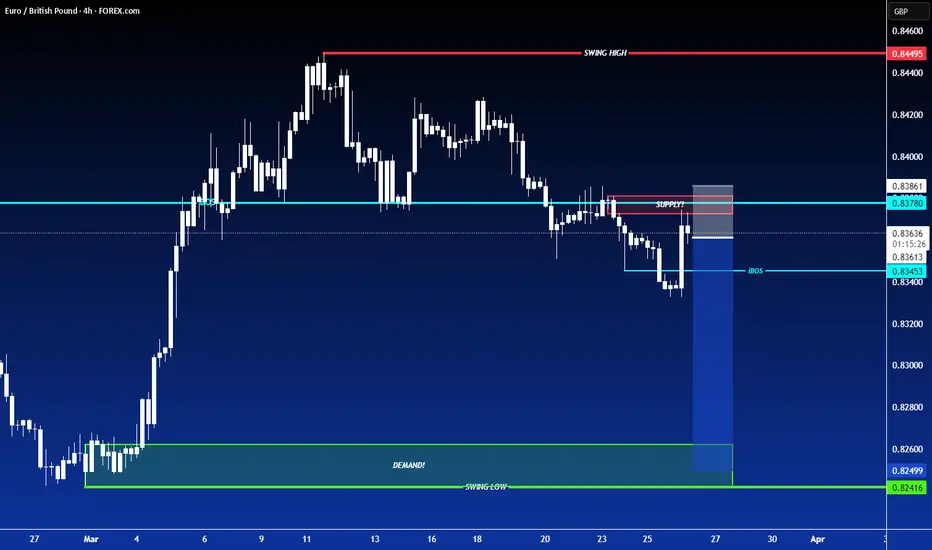
SHORT ON EUR/USDEUR/USD has finally given a change of character to the downside and is currently pulling back into a supply area.
The dollar is gaining strength due to Tariffs and looks like it will rise.
I will be selling EUR/USD with a sell limit order looking to catch over 200-300 pips over the next few days.
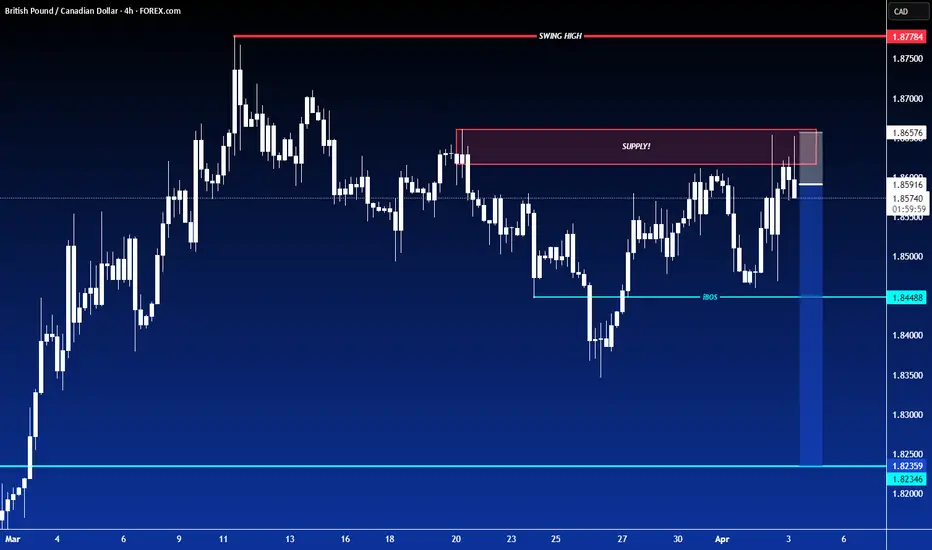
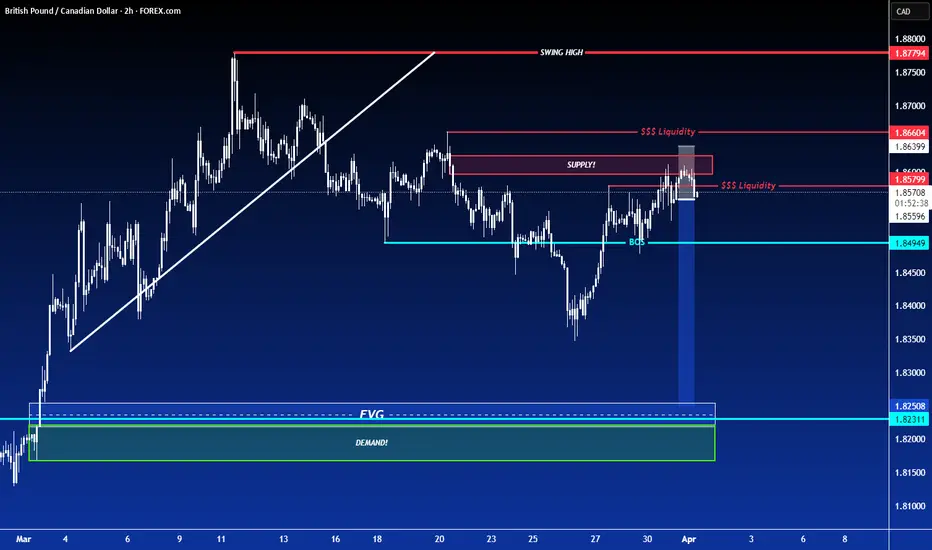
SHORT ON GBP/CADGBP/CAD has pulled back nicely to a Key supply area.
Its providing nice rejection of bullish pressure showing that its respecting the supply zone.
I will be selling GBP/CAD looking to make over 200-300 pips over the next few days.
Gold prices cool after tariff announcement⭐️GOLDEN INFORMATION:
Gold prices (XAU/USD) surged to a new all-time high during the Asian session on Thursday as investors flocked to safe-haven assets amid heightened risk aversion. Market sentiment took a sharp downturn after US President Donald Trump unveiled sweeping reciprocal tariffs on Wednesday evening, igniting fears of a global economic slowdown and a potential US recession.
The announcement triggered a broad sell-off in equity markets, reinforcing the risk-off mood and further fueling demand for gold as a traditional store of value.
⭐️Personal comments NOVA:
Gold hits 3167 peak, buying pressure gradually decreases. Adjustment waiting for new moves from other countries on Trump's tariff policy
⭐️SET UP GOLD PRICE:
🔥 SELL 3165 - 3168 SL 3172
TP1: $3160
TP2: $3150
TP3: $3140
🔥BUY GOLD zone: $3108 - $3110 SL $3103
TP1: $3115
TP2: $3130
TP3: $3140
⭐️Technical analysis:
Based on technical indicators EMA 34, EMA89 and support resistance areas to set up a reasonable SELL order.
⭐️NOTE:
Note: Nova wishes traders to manage their capital well
- take the number of lots that match your capital
- Takeprofit equal to 4-6% of capital account
- Stoplose equal to 2-3% of capital account

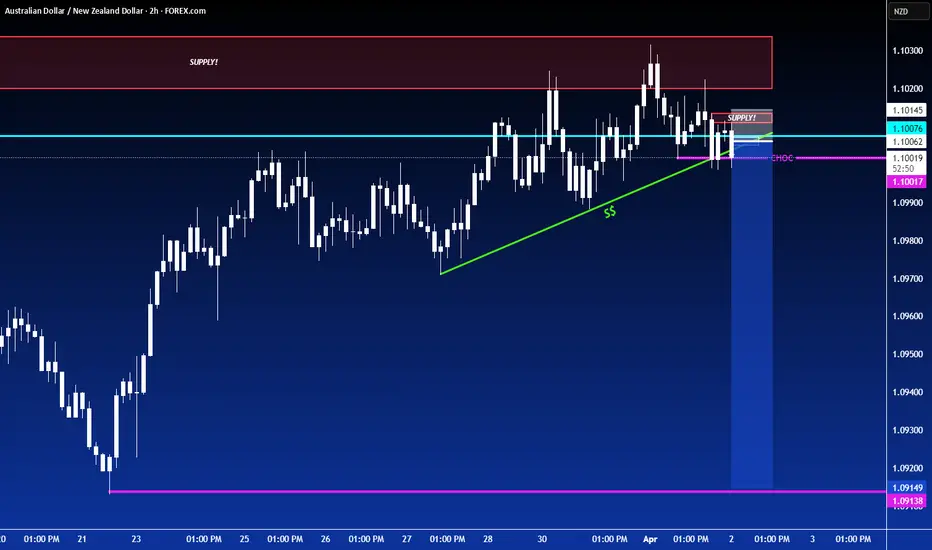
SHORT ON AUD/NZDAUD/NZD has given a perfect setup for a sell.
I has bearish divergence as well as a rising channel/wedge into a Major Supply Area from the Higher TF.
We have also change structure from Up to Down on the Lower Timeframe.
I will be selling AUD/NZD to the pervious swing low / demand area for about 100 pips. OANDA:AUDNZD
SHORT ON GBP/CADPrice has finally changed from up to down on the higher timeframe for GBP/CAD.
It has given us a change of character to the downside with a nice retest of a key supply area.
I will being selling GBP/CAD looking to make 200-300 pips.
No Rate Hike, No Mercy – AUD/USD Selling in Style!Riding the wave of bearish structure, AUD/USD continues to follow the macro trend with laser precision. After the RBA held rates steady, we’re seeing the typical post-news dump play out—fueled by the market’s disappointment and reduced sentiment.
Technically, price respected the 4H Fair Value Gap (FVG) and showed strong displacement to the downside, confirming continuation.
Key Targets:
🔻 0.62311 – Minor liquidity
🔻 0.62185 – 1H Sell-side liquidity
🔻 0.61703 – Ultimate short-term sell-side target
Expecting the market to bleed lower unless major fundamentals flip the bias. Until then... the trend is your bestie.
DYOR 🧠📉

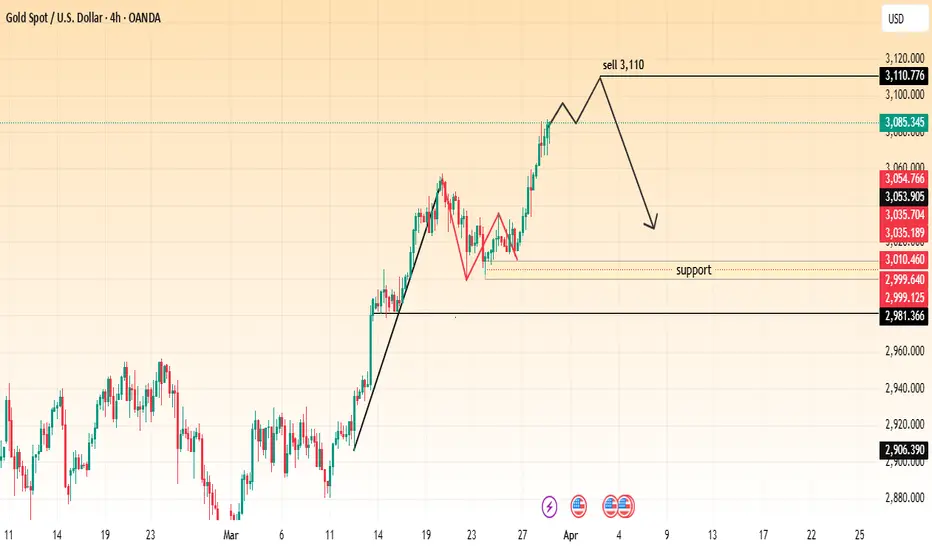
"Gold (XAU/USD) Approaching 3,110 – Sell Setup in Play?"The price is in an uptrend, making higher highs and higher lows.
A potential reversal zone is identified around $3,110, marked as a possible sell entry.
The chart suggests that after reaching $3,110, the price may decline towards the support zone at $3,010 - $2,999.
Confirmation of the sell trade can be considered if price action forms a bearish structure around resistance.
Key support levels are at $3,010, $2,999, and $2,981, which could act as potential take profit targets for short positions.
Trading Strategy:
Sell Entry: Around $3,110, if resistance holds.
Target: $3,010 - $2,999 zone.
Stop Loss: Above $3,120 to manage risk.
This idea follows technical price action, making it crucial to watch for confirmation signals before executing a trade. 🚀📉
CADJPY analysis for a Sell!!!!Here’s a sell-side analysis for CAD/JPY on the 2H chart based on your updated screenshot:
⸻
Pair: CAD/JPY
Timeframe: 2H
Current Price: ~104.656
Market Bias: Short-term bearish shift from previous bullish trend
⸻
Sell Analysis Overview:
1. Bearish Structure Forming Below 105.300–105.600
• Price recently broke below a major support zone (~105.300–105.600), which is now turning into a resistance zone.
• This rejection aligns with the concept of structure flipping — previous support now acting as resistance.
• The marked “Sell Structure Forming Below” zone highlights this key area for short positions on pullbacks.
2. Multiple Rejections at 105.866
• There are clear lower highs forming, with repeated rejections around 105.866 (circled).
• Each attempt to push higher has failed, showing strong bearish pressure and exhaustion from buyers.
3. Breakdown of Key Moving Averages
• Price has closed below both the 50 EMA and 100 EMA, which are beginning to curl downward — a common signal of a trend reversal.
• Momentum has shifted, and sellers are currently in control.
4. Liquidity Grab + Breakdown
• After a false breakout to the upside, price grabbed liquidity around 105.866 and quickly reversed.
• This aligns with smart money behavior: sweeping highs before dropping — a classic bearish trap.
5. Short-Term Target Zone
• The current bearish move has a clear downside target in the 103.600–103.800 zone, which is marked as an “Area of Liquidity”.
• If this zone breaks cleanly, extended targets sit around 101.800–101.400, where fresh demand and buy structure are likely to form.
⸻
Sell Plan & Risk Management:
• Entry Idea: Wait for a pullback into the 105.300–105.600 zone to look for bearish confirmation (e.g., bearish engulfing, rejection wick).
• Stop Loss: Above 105.866 (invalidates structure)
• Take Profit Levels:
• TP1: 103.600 (liquidity zone)
• TP2: 101.800 (demand zone)
• TP3: 101.400 (long-term structure support)
⸻
Final Thoughts:
CAD/JPY is now showing early signs of a bearish trend reversal after a clean breakdown of structure and liquidity sweep at highs. As long as the price remains below 105.600, the bias remains bearish. A bounce from 104.500 could temporarily delay the drop, but deeper downside is likely if that level gives way.

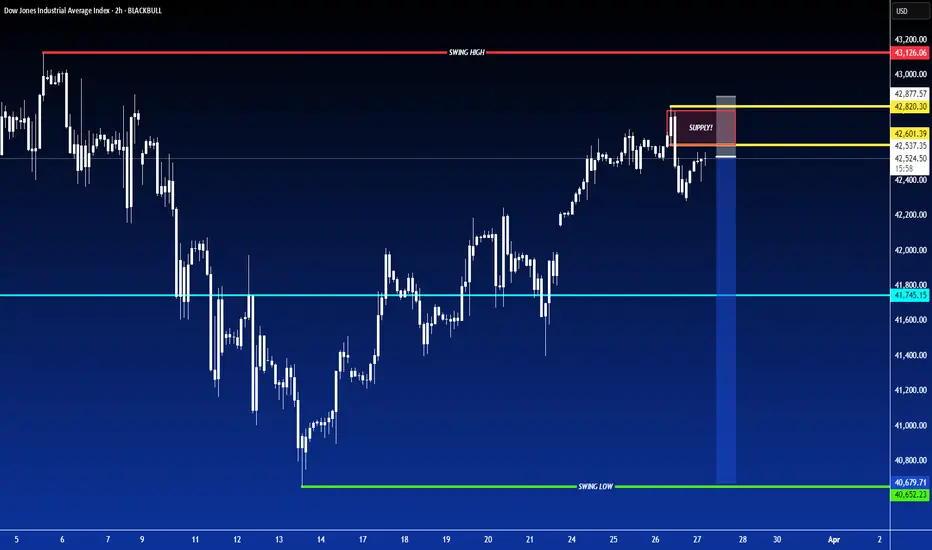
SHORT ON US30US30 Has given a change of character (choc) on the 4hr TF indicating the end of its uptrend pullback on its overall downtrend.
I will be selling US30 to the next level of demand looking to capture over 1000 points.
Nvidia Update New levels to the downside Longs and shortsIn this video I discuss the market structure shift in Nvidia and highlight new levels to be aware of to the downside . Potential here for longs and shorts .
Tools used Fibs, Gann Square , Speed Fan , Order blocks .
Please Like and comment if you have any questions . Have a great Day and thanks for your support

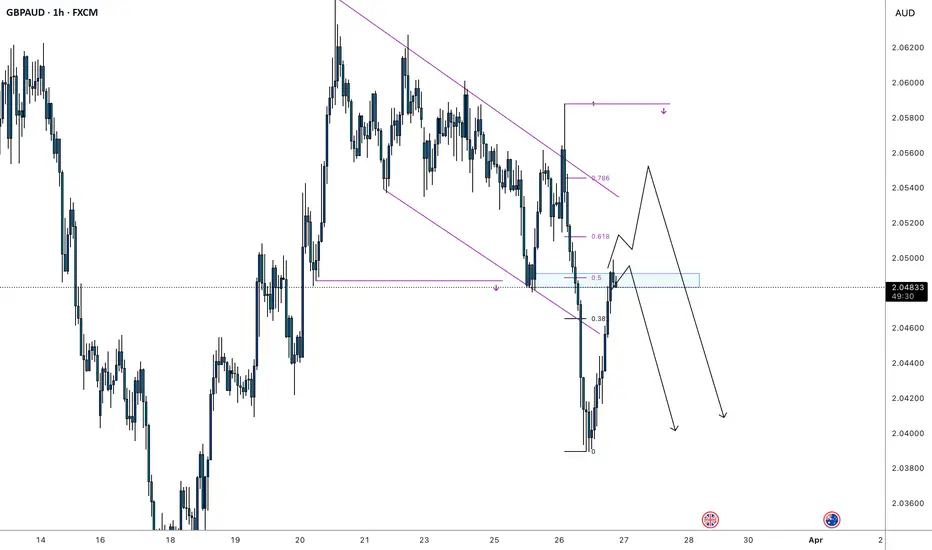
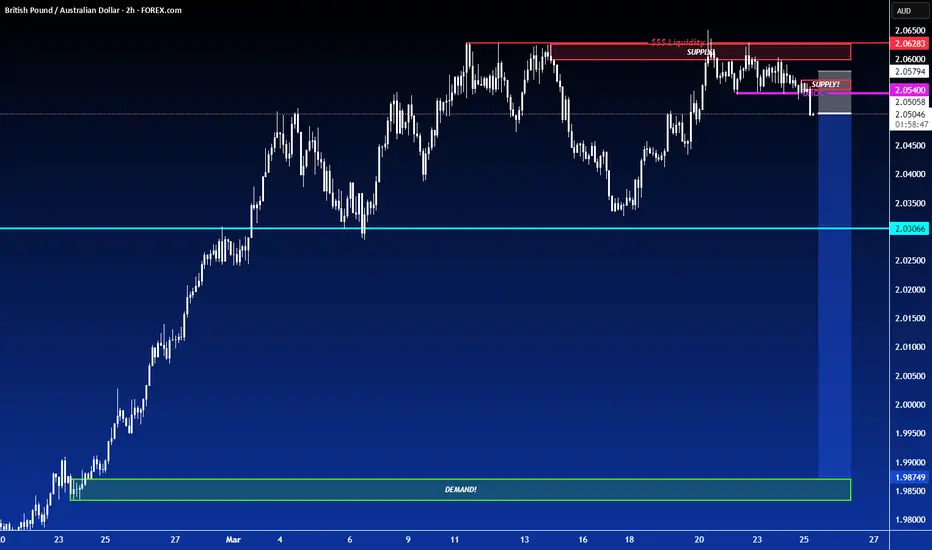
GBPAUDGBPAUD Potential Sell Idea, price fell down from the channel indicating Aggressive selling pressure, Currently Correction from the 50% Retracement of the fresh Sell Moove align with the Previous Keylevel, Indicating break & Retest Pattern
continue downtrend , GOLD⭐️GOLDEN INFORMATION:
Gold price (XAU/USD) holds steady above the key $3,000 level for the second consecutive day on Wednesday, though it struggles to reclaim the previous session’s peak. Ongoing uncertainty surrounding US President Donald Trump’s proposed reciprocal tariffs set for next week continues to bolster demand for the safe-haven metal. At the same time, the US Dollar (USD) remains under pressure following Tuesday’s weaker-than-expected macroeconomic data, providing additional support for gold’s upward momentum.
⭐️Personal comments NOVA:
Gold price continues to decrease, around 2990 - 3000
⭐️SET UP GOLD PRICE:
🔥SELL GOLD zone: $3039 - $3041 SL $3046
TP1: $3030
TP2: $3020
TP3: $3010
🔥BUY GOLD zone: $2992 - $2990 SL $2985
TP1: $3000
TP2: $3008
TP3: $3018
⭐️Technical analysis:
Based on technical indicators EMA 34, EMA89 and support resistance areas to set up a reasonable SELL order.
⭐️NOTE:
Note: Nova wishes traders to manage their capital well
- take the number of lots that match your capital
- Takeprofit equal to 4-6% of capital account
- Stoplose equal to 2-3% of capital account
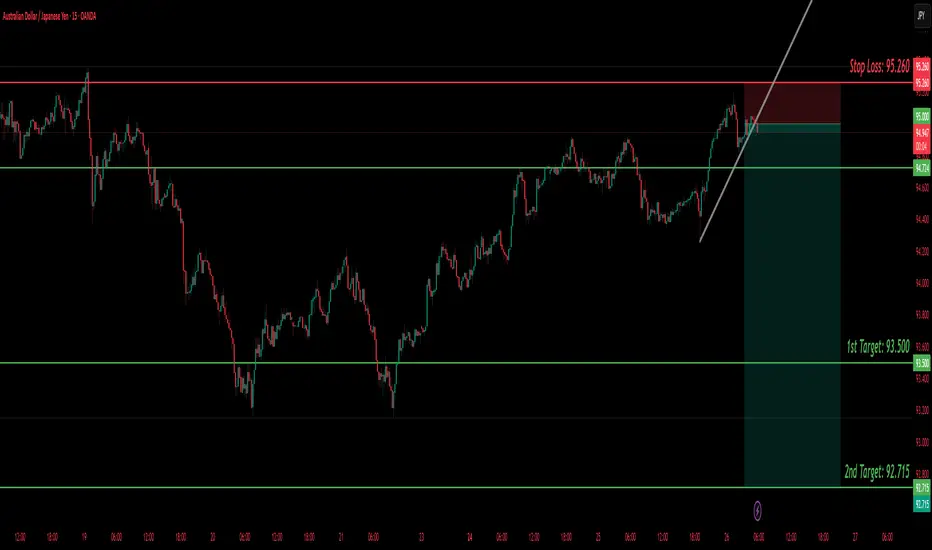
AUD/JPY SELL IDEA (R:R=8.7)Selling AUD/JPY now. I have been waiting for this to close below the trend line. Overall direction is BEARISH according to Monthly timeframe.
Stop Loss is: 95.260
Please move SL to break even when trade is 70+ pips in profit.
1st Target: 93.500
2nd Target: 92.715
Happy Trading! :)
SHORT ON EUR/GBPPrice is currently pulling back from its over uptrend on this pair.
Just following the current downtrend structure looking to make 80-100 pips to the next demand zone or imbalance.
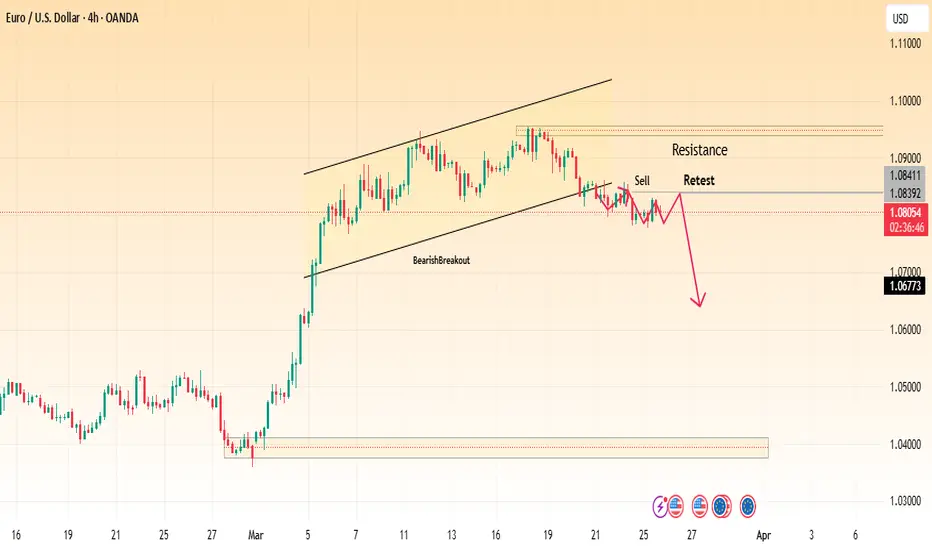
EUR/USD 4H | Bearish Retest Before Drop? The EUR/USD pair has broken below an ascending channel, signaling a potential bearish trend. After the breakdown, price is now retesting the previous support as new resistance, creating a sell opportunity.
🔎 Key Observations:
✅ Resistance Zone: The 1.08392 - 1.08411 level is acting as a strong resistance after the breakdown.
✅ Sell Confirmation: A rejection from this resistance level will confirm the bearish move, with 1.06773 as the next target.
✅ Bearish Expectation: If price fails to reclaim the broken trendline, further downside momentum is expected.
📌 Trading Plan:
🔻 Look for bearish price action signals (e.g., rejections, bearish engulfing candles) at the retest area.
🔻 A confirmed sell setup can target 1.06773 as the next support zone.
🚨 Risk Management Tip: Use stop-loss above 1.08500 to protect against invalidation.
💬 What are your thoughts on this setup? Are you looking for shorts or waiting for more confirmation?
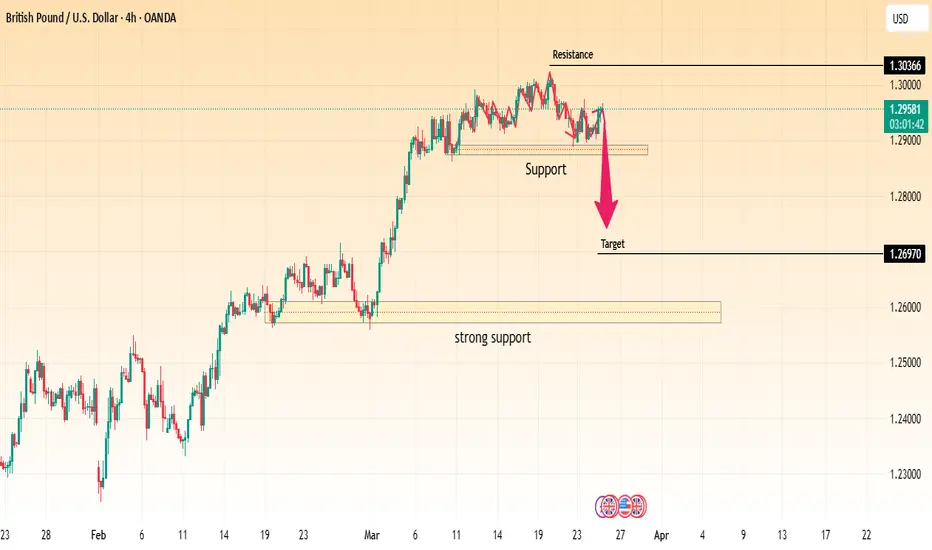
GBP/USD Breakdown – Support Under Pressure, Bearish Target AheadChart Analysis:
The GBP/USD pair is currently trading around 1.29578, facing resistance near 1.30366.
A support zone has been identified around 1.29000, which the price is testing.
If this support level breaks, we could see a bearish move toward the next target near 1.26970.
Strong support is positioned lower, which may act as a key reversal point if the decline continues.
Trading Outlook:
Bearish Scenario: If the price breaks below the current support, a drop toward 1.26970 seems likely.
Bullish Scenario: If GBP/USD holds above support, we may see a retest of resistance at 1.30366.
Conclusion:
Traders should watch for a confirmed breakout or rejection at support before taking positions. A clean break below could trigger a stronger bearish move. 🚨
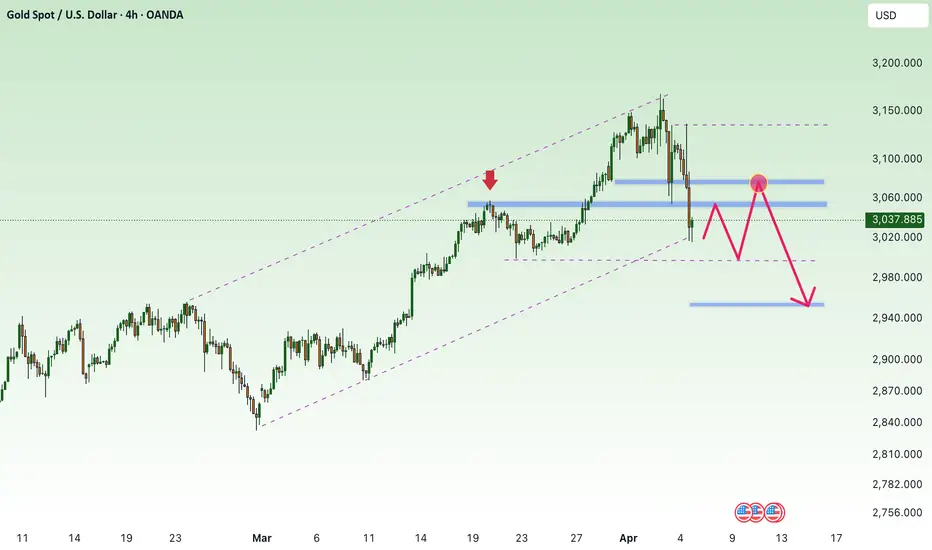
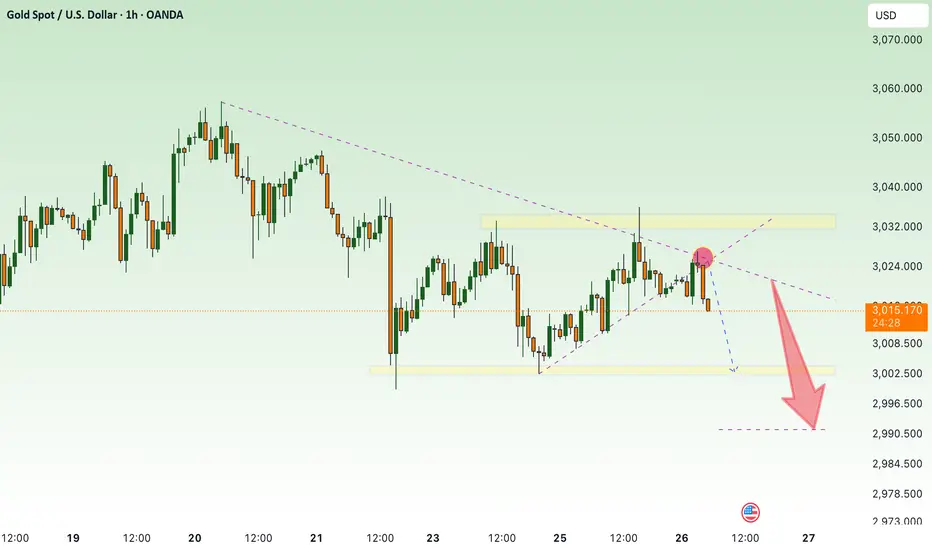
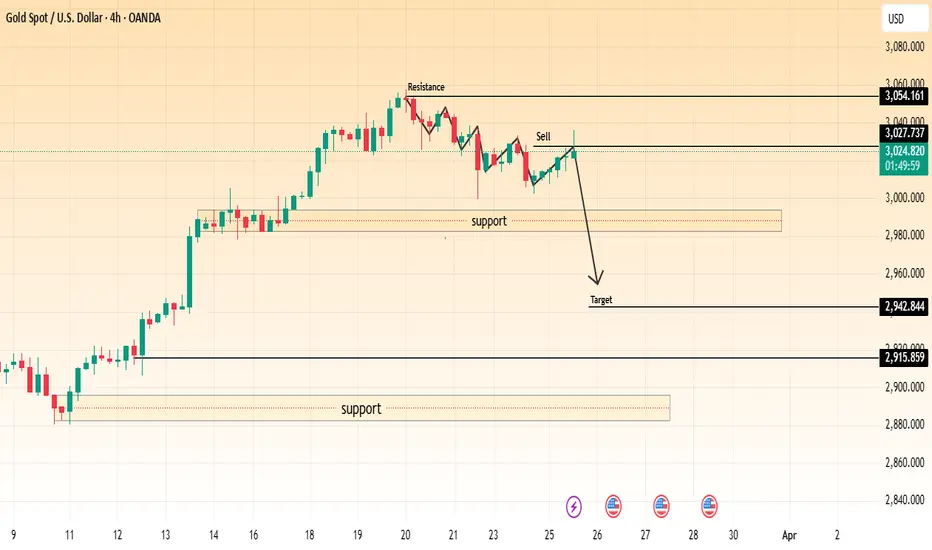
(XAU/USD) Sell Setup |Bearish Move Expected Towards Key SupportAnalysis:
The price has experienced a strong uptrend but is now showing signs of resistance near the 3,054.161 level.
A support level is identified around 3,000, which has been tested multiple times.
A potential sell setup is indicated after the price retested a resistance-turned-support zone around 3,027.737.
The target for the downside move is marked at 2,942.844, aligning with a previous support level.
If bearish momentum continues, a further decline toward 2,915.859 is possible.
Trading Idea:
Sell Entry: Around 3,027-3,030 after confirmation of rejection.
Stop Loss: Above 3,054 (recent resistance).
Take Profit Targets:
TP1: 2,942
TP2: 2,915
Market Sentiment:
The price is reacting to key levels, and if it breaks below 3,000, it could accelerate the bearish move.
A break above 3,054 would invalidate the short setup and could push the price higher.
SHORT ON GBP/AUDGBP/AUD has the same setup as EUR/AUD from my post yesterday.
I am selling GBP/AUD for the same exact reasons.
Looking to catch 600 pips long term but over 200 pips easily this week!
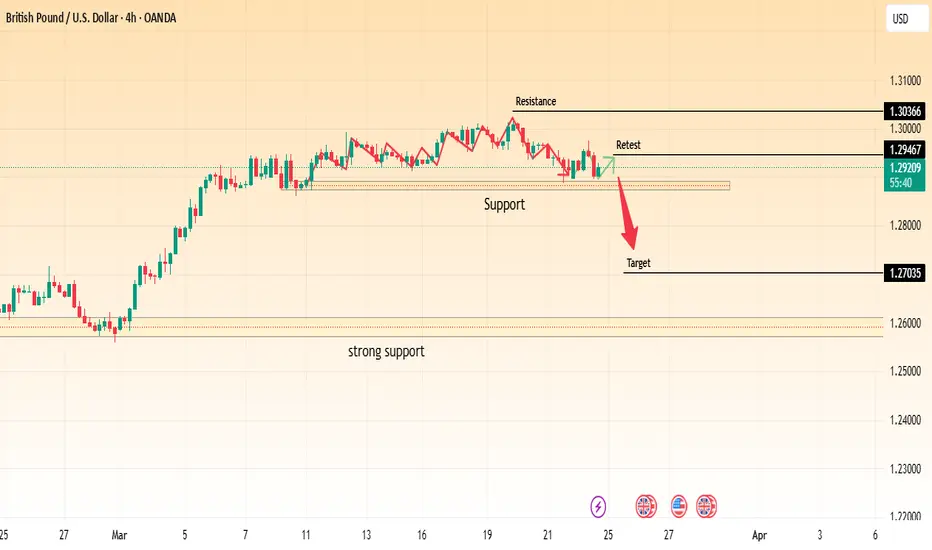
GBP/USD Technical Analysis – Potential Bearish MoveThis 4-hour GBP/USD chart indicates a potential bearish setup. Price has been trading within a range, with resistance around 1.30366 and support near 1.29467.
The price recently retested the support zone, showing signs of weakness.
If the support level fails to hold, a breakdown could push the price towards the 1.27035 target.
A stronger support level is observed further below, around 1.2600, which could act as a key demand zone.
Traders should monitor the price action near the support zone. A clear rejection could signal a potential buy opportunity, while a confirmed breakdown could validate a short trade targeting lower levels.
Key Levels:
🔹 Resistance: 1.30366
🔹 Support: 1.29467
🔹 Target: 1.27035
Would you like any modifications to the analysis? 🚀
BTC/USD – Bearish Rejection, Targeting SupportChart Analysis:
BTC/USD is trading within a descending channel, showing a bearish trend.
Price recently tested the resistance zone but faced rejection.
A strong sell signal is indicated, suggesting a move towards the support level around $79,877.
If price breaks below support, further downside is possible.
Trading Plan:
Sell below resistance with a target at support.
Watch for confirmation signals before entering a position.
If price breaks above resistance, a trend reversal could be possible.

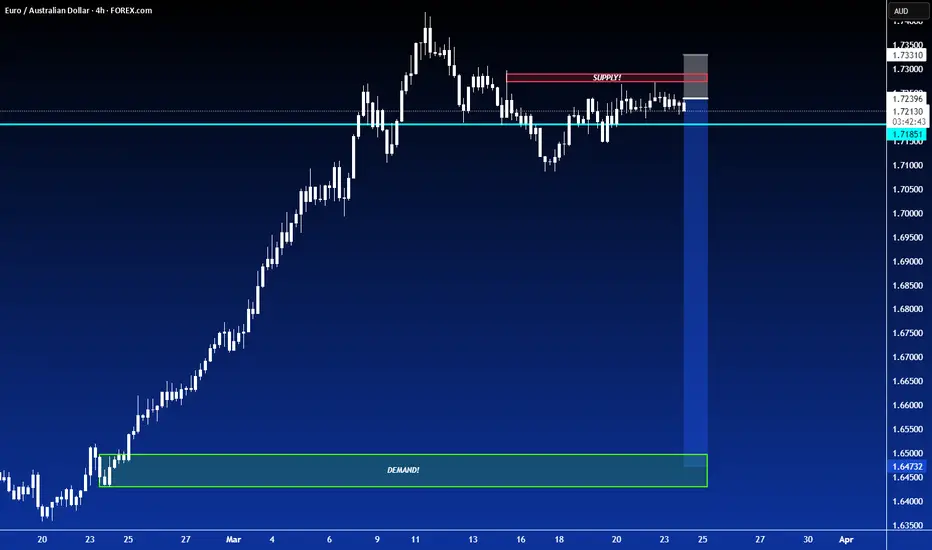
SHORT ON EUR/AUDEUR/AUD is currently at major resistance area.
It has given a nice change of character (choc) to the downside from being over brought for a long time.
I am selling EUR/AUD looking to catch over 500 pips as a swing trade.
Gold declines, accumulate and wait for April news⭐️GOLDEN INFORMATION:
Gold price (XAU/USD) continues its pullback, slipping toward $3,025 in early Asian trading on Monday. The metal retreats from Thursday’s record high, driven by renewed optimism over a potential Ukraine peace deal. However, expectations of Federal Reserve (Fed) rate cuts and lingering economic uncertainties could provide support, limiting further downside for the yellow metal.
⭐️Personal comments NOVA:
Gold is under pressure to sell and take profits in the short term. There is still a lot of liquidity in the 3000 price zone. The price will continue to accumulate around $3000.
⭐️SET UP GOLD PRICE:
🔥SELL GOLD zone: $3031 - $3033 SL $3038
TP1: $3020
TP2: $3010
TP3: $3000
🔥BUY GOLD zone: $2991 - $2993 SL $2986
TP1: $3000
TP2: $3008
TP3: $3017
⭐️Technical analysis:
Based on technical indicators EMA 34, EMA89 and support resistance areas to set up a reasonable SELL order.
⭐️NOTE:
Note: Nova wishes traders to manage their capital well
- take the number of lots that match your capital
- Takeprofit equal to 4-6% of capital account
- Stoplose equal to 2-3% of capital account
