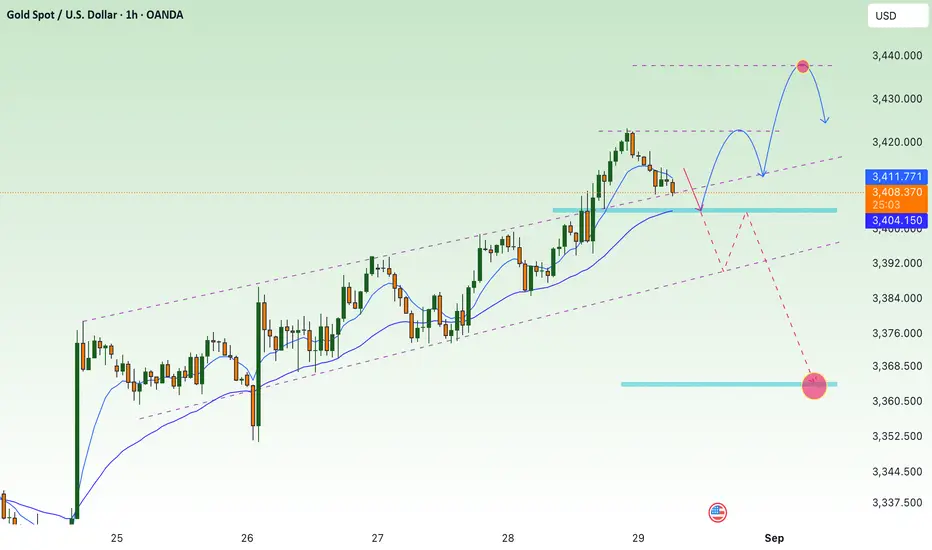
Is the price of gold really going up? 3500?⭐️GOLDEN INFORMATION:
Gold (XAU/USD) slips in Friday’s Asian session, pulling back from a five-week high near $3,425 as profit-taking and strong US GDP and jobless claims data lift the Dollar. Still, growing expectations of a September Fed rate cut, reinforced by dovish comments from NY Fed’s John Williams, help limit the downside for the non-yielding metal.
⭐️Personal comments NOVA:
Gold prices increased thanks to expectations that the FED will cut interest rates in September. However, the large fomo market will cause the market to be too optimistic, requiring adjustments to accumulate before that time.
⭐️SET UP GOLD PRICE:
🔥SELL GOLD zone: 3437- 3439 SL 3444
TP1: $3430
TP2: $3420
TP3: $3410
🔥BUY GOLD zone: $3366-$3364 SL $3359
TP1: $3375
TP2: $3383
TP3: $3390
⭐️Technical analysis:
Based on technical indicators EMA 34, EMA89 and support resistance areas to set up a reasonable SELL order.
⭐️NOTE:
Note: Nova wishes traders to manage their capital well
- take the number of lots that match your capital
- Takeprofit equal to 4-6% of capital account
- Stoplose equal to 2-3% of capital account
Sellsignal
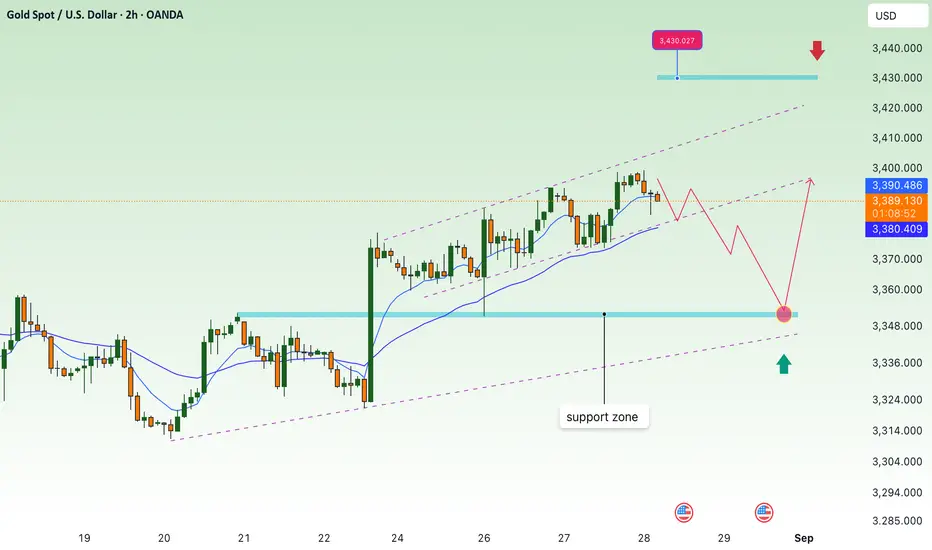
Continue to accumulate below 3400⭐️GOLDEN INFORMATION:
Gold (XAU/USD) dips during Thursday’s Asian session, pulling back from a three-week high near $3,400 as the US Dollar rebounds and traders book profits. Ongoing concerns over Fed independence, following President Trump’s removal of Governor Lisa Cook, lend some support to the safe-haven metal.
Markets now await the second estimate of US Q2 GDP, expected at 3.1%. A stronger print could boost the Greenback and pressure Gold, while focus will shift to Friday’s PCE inflation data for clues on Fed rate-cut prospects
⭐️Personal comments NOVA:
Gold prices continue to accumulate below 3400, according to experts expecting GDP data to support DXY. This could contribute to putting pressure on gold prices.
⭐️SET UP GOLD PRICE:
🔥SELL GOLD zone: 3428- 3430 SL 3435
TP1: $3418
TP2: $3407
TP3: $3392
🔥BUY GOLD zone: $3350-$3352 SL $3345
TP1: $3360
TP2: $3370
TP3: $3380
⭐️Technical analysis:
Based on technical indicators EMA 34, EMA89 and support resistance areas to set up a reasonable SELL order.
⭐️NOTE:
Note: Nova wishes traders to manage their capital well
- take the number of lots that match your capital
- Takeprofit equal to 4-6% of capital account
- Stoplose equal to 2-3% of capital account
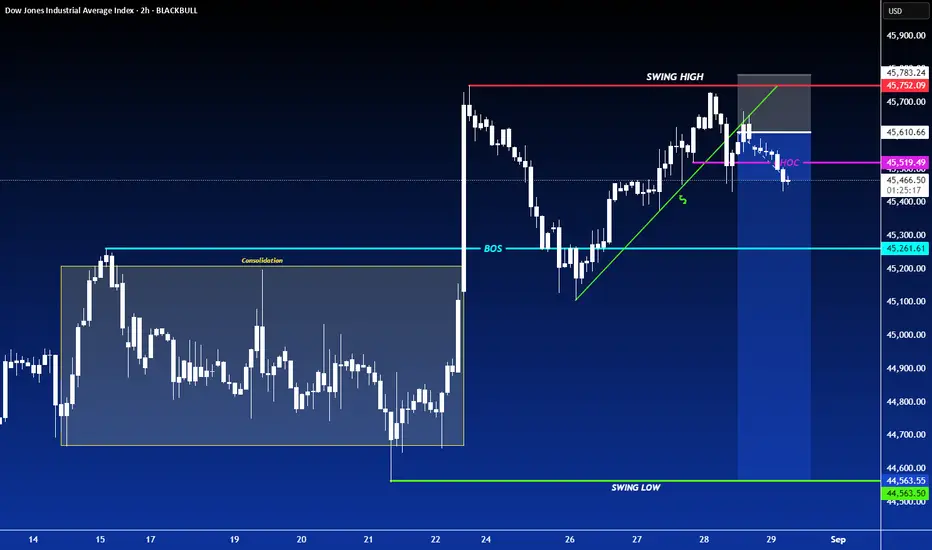
SHORT ON US30US30 has given us a CHOC to the downside after a long time run up.
I will be selling US30 to the consolidation zone looking to catch 1000 points over the next few days.
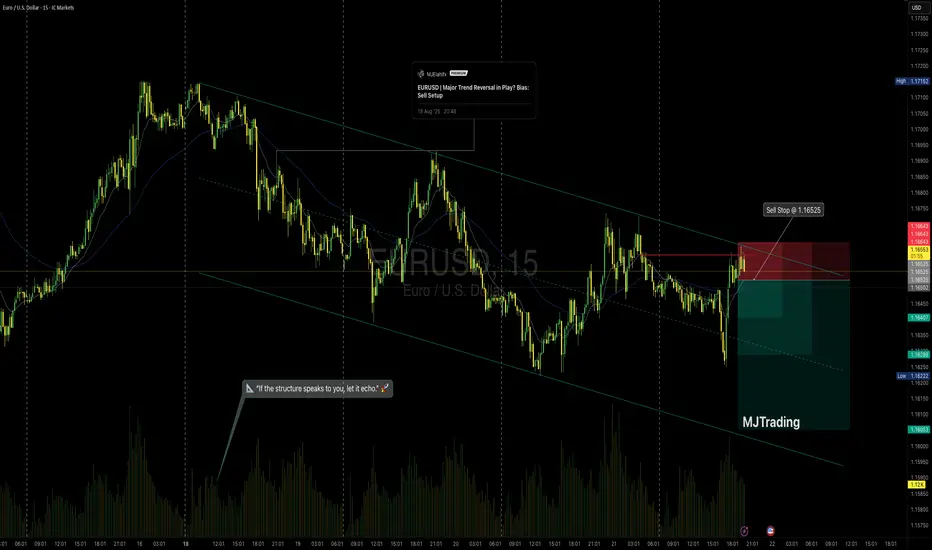
EURUSD | Short Setup | Pending Order💎MJTrading
📸 Viewing Tip:
🛠️ Some layout elements may shift depending on your screen size.
🔗 View the fixed high-resolution chart here:
📝 Trade Setup: FX:EURUSD | Short Bias
Price is respecting the descending channel structure, with the recent rally testing the upper boundary near 1.1660.
🟢 Entry Zone: Pending Order: Sell Stop @ 1.16525
❌ Stop Loss (SL): 1.16643 (channel breakout invalidation)
🎯 Take Profit (TP) Levels
✅ TP1 → 1.16407
📈 TP2 → 1.16289
💰 TP3 - RR4→ 1.16050
#EURUSD #PriceAction #TechnicalAnalysis #Trading #MJTrading
Psychology Always Matters:
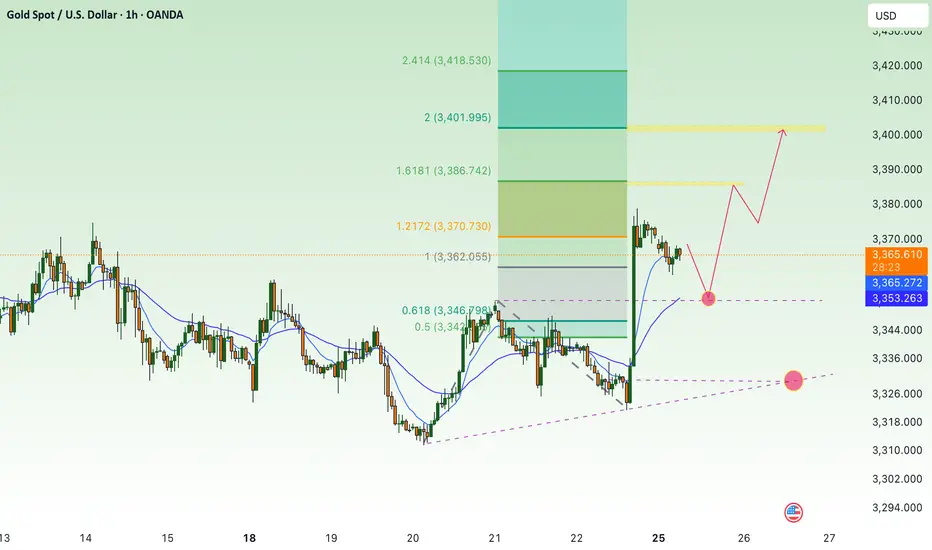
Slight decrease in the new week, accumulation above 3330⭐️GOLDEN INFORMATION:
Fed Chair Jerome Powell signaled openness to a rate cut at the September meeting, though persistent inflation pressures could complicate that outlook. Powell described the US economy as facing a “challenging situation,” noting inflation risks remain skewed to the upside while employment risks lean to the downside.
Following his remarks, traders boosted their bets on a 25 basis-point cut next month to nearly 85%, up from 75% prior to the speech, according to the CME FedWatch tool. Powell’s dovish tone could lend support to gold prices, as lower interest rates diminish the opportunity cost of holding the non-yielding metal.
⭐️Personal comments NOVA:
Gold price decreased and adjusted, pay attention to liquidity zones 3351, 3330
⭐️SET UP GOLD PRICE:
🔥SELL GOLD zone: 3400- 3402 SL 3407
TP1: $3388
TP2: $3373
TP3: $3360
🔥BUY GOLD zone: $3330-$3328 SL $3323
TP1: $3340
TP2: $3350
TP3: $3360
⭐️Technical analysis:
Based on technical indicators EMA 34, EMA89 and support resistance areas to set up a reasonable SELL order.
⭐️NOTE:
Note: Nova wishes traders to manage their capital well
- take the number of lots that match your capital
- Takeprofit equal to 4-6% of capital account
- Stoplose equal to 2-3% of capital account
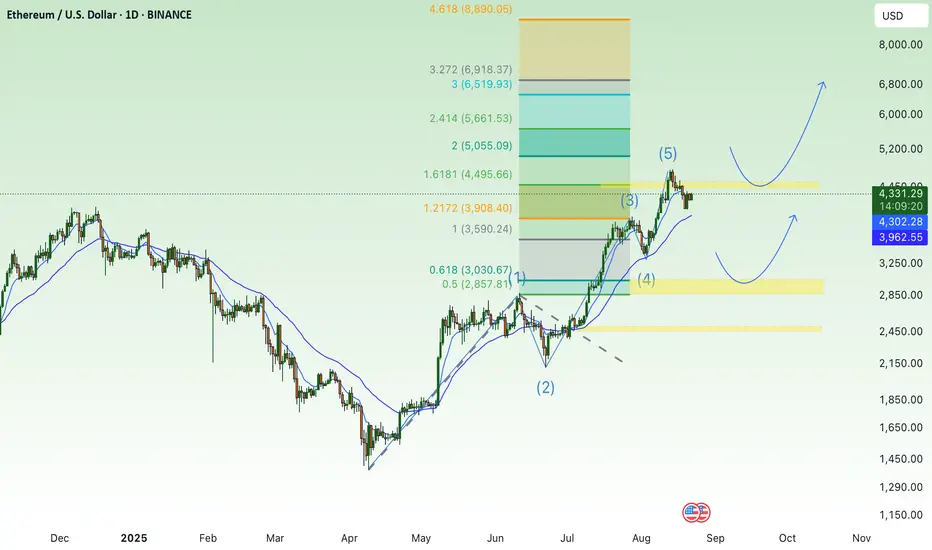
short term adjustment, accumulation for uptrend ETH💎 ETH WEEKEND PLAN UPDATE (August 22 , 2025 )
ETH is in a medium-term uptrend, having just completed wave (5) according to Elliott Wave, and is now undergoing a slight correction.
The current price zone around 4,200 – 4,300 USD is a key area to watch:
• If it holds, ETH may rebound higher.
• If it breaks down, it could retreat to deeper support levels.
Key Levels
Near Resistance:
• 4,500 – 4,600 USD: Strong resistance zone, aligning with wave (5) and Fibonacci 1.618.
• If this level is broken, the next target is 6,000 USD (Fibo 2.618).
Near Support:
• 3,800 – 3,900 USD: Confluence with EMA34 and an intermediate support zone.
• 3,200 – 3,250 USD: Strong support, intersecting EMA200 and key Fibonacci cluster.
• 2,500 – 2,600 USD: Final support, a solid base before the last strong rally.
Trend Outlook
• Short-term: ETH may continue correcting towards support to accumulate before forming a new rally.
• Medium-term: The main trend remains bullish as long as ETH holds above 3,200 USD.
• Long-term: If ETH breaks above 4,600 USD, it is highly likely to target 6,000 USD.
👉 Summary:
ETH is in a consolidation phase after a strong rally. Investors should watch the 3,800 – 3,900 USD zone closely. If it holds, the chance of retesting 4,600 USD and potentially 6,000 USD remains strong.
Selling pressure, gold price drops back to 3300⭐️GOLDEN INFORMATION:
Gold (XAU/USD) remains under pressure for a second consecutive session on Friday, though it continues to trade above Thursday’s swing low. Market participants appear cautious, avoiding large directional positions ahead of Federal Reserve Chair Jerome Powell’s speech at the Jackson Hole symposium later today. His remarks will be closely analyzed for clues on the Fed’s policy outlook, which could shape near-term U.S. Dollar dynamics and provide fresh impetus for the non-yielding metal.
Meanwhile, the Dollar has paused after Thursday’s sharp rally to a two-week high, offering some relief to gold prices. Additionally, strengthening expectations that the Fed will restart its rate-cutting cycle in September—combined with a generally cautious market tone—suggest that bearish positions on XAU/USD warrant caution. Furthermore, the metal’s recent bounce from the 100-day Simple Moving Average highlights the need for confirmation through follow-through selling before anticipating any significant downside move.
⭐️Personal comments NOVA:
H1 frame sees gold price breaking short-term trend, selling pressure as % of interest rate cut expectations decrease
⭐️SET UP GOLD PRICE:
🔥SELL GOLD zone: 3374- 3376 SL 3381
TP1: $3368
TP2: $3352
TP3: $3340
🔥BUY GOLD zone: $3303-$3301 SL $3296
TP1: $3312
TP2: $3323
TP3: $3339
⭐️Technical analysis:
Based on technical indicators EMA 34, EMA89 and support resistance areas to set up a reasonable SELL order.
⭐️NOTE:
Note: Nova wishes traders to manage their capital well
- take the number of lots that match your capital
- Takeprofit equal to 4-6% of capital account
- Stoplose equal to 2-3% of capital account
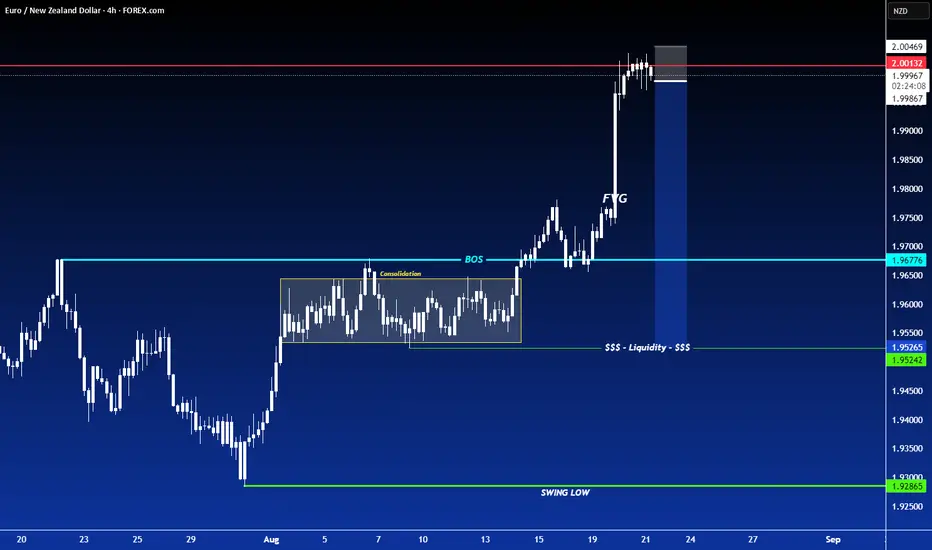
SHORT ON EUR/NZDEUR/NZD has taken out a previous swing high and has started to consolidate.
There is plenty of liquidity to be collected to the downside.
I will be selling EUR/NZD to the next demand level looking to catch 300-400 pips.
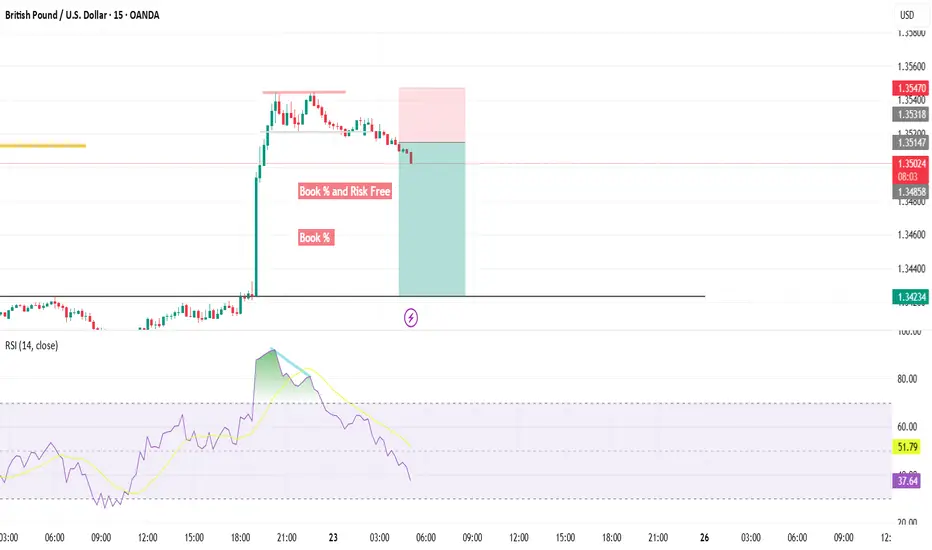
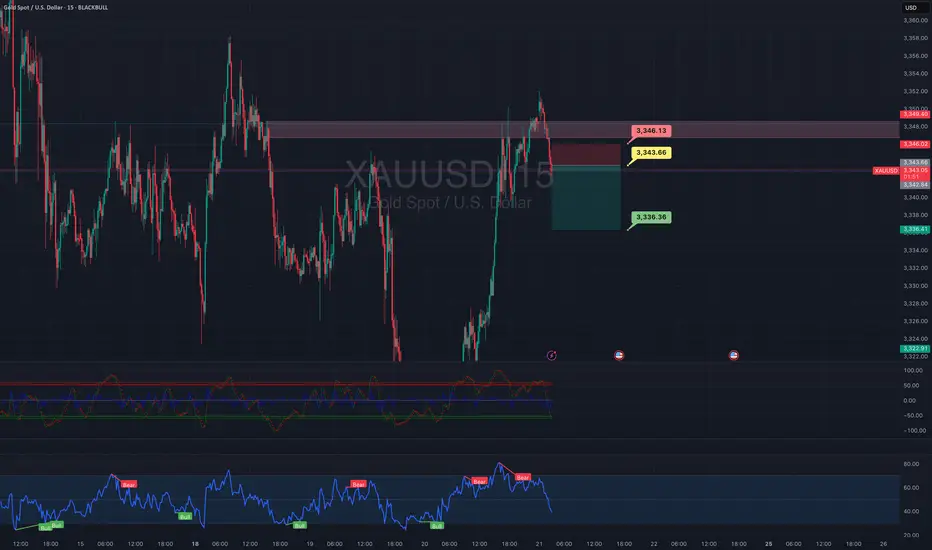
Sell on GOLD with R/R: 1/3 Risk: 1%
Hello guys,
You can risk 1% of your balance on this position. The risk-to-reward ratio is 1:3.
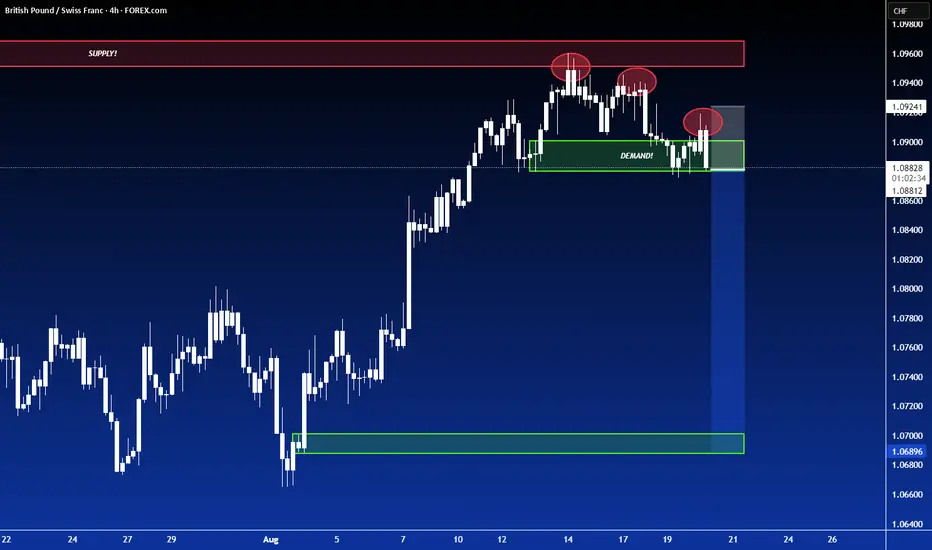
SHORT ON GBP/CHFGBP/CHF has a nice double top and has just created a lower high confirming the pattern to complete price reversal to the downside.
Looking to catch 100-200 pips to the next level of demand.
Gold price drops to 3300, accumulation⭐️GOLDEN INFORMATION:
Gold prices fell on Tuesday as the U.S. Dollar extended modest gains for a second session, while geopolitical optimism weighed on safe-haven demand. XAU/USD is trading near $3,317, with markets eyeing the potential for progress in peace talks following U.S. President Donald Trump’s meetings with Vladimir Putin, Volodymyr Zelenskiy, and European leaders.
Speculation over a possible de-escalation of the Ukraine–Russia conflict has pressured bullion, which typically benefits during times of heightened uncertainty. Last Friday’s Trump-Putin talks laid the groundwork for further dialogue, and on Monday Trump met with Zelenskiy and European counterparts to push for a ceasefire and set the stage for trilateral negotiations between Kyiv and Moscow.
⭐️Personal comments NOVA:
Gold prices under selling pressure ahead of today's FOMC meeting, aiming to fall back to psychological support zone 3300
⭐️SET UP GOLD PRICE:
🔥SELL GOLD zone: 3339- 3341 SL 3346
TP1: $3330
TP2: $3320
TP3: $3310
🔥BUY GOLD zone: $3302-$3300 SL $3295
TP1: $3313
TP2: $3325
TP3: $3337
⭐️Technical analysis:
Based on technical indicators EMA 34, EMA89 and support resistance areas to set up a reasonable SELL order.
⭐️NOTE:
Note: Nova wishes traders to manage their capital well
- take the number of lots that match your capital
- Takeprofit equal to 4-6% of capital account
- Stoplose equal to 2-3% of capital account
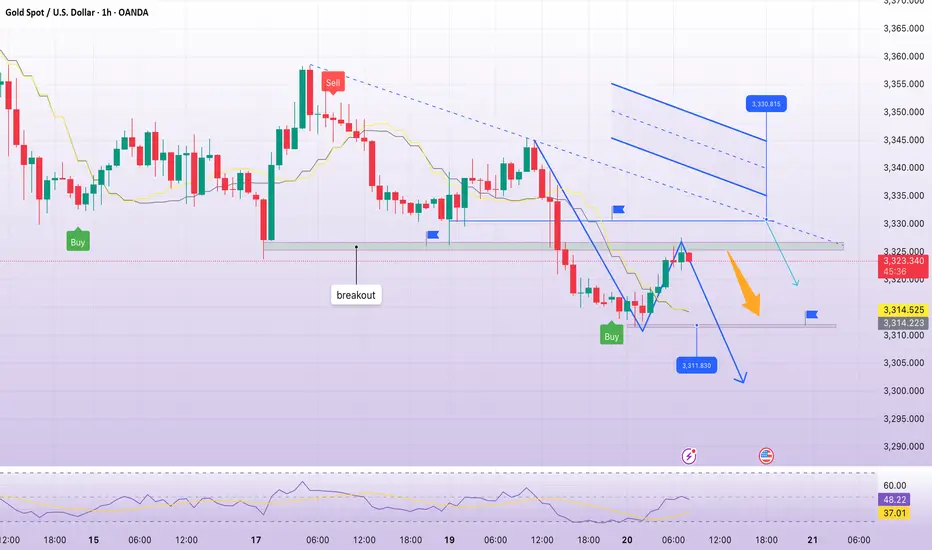
Selling pressure continues to return to 3300Plan XAU day: August 20, 2025
Related Information:!!!
Gold (XAU/USD) slid to its lowest level in nearly three weeks during the Asian session on Wednesday, with bearish sentiment prevailing as market participants await a decisive break below the 100-day Simple Moving Average (SMA) to confirm prospects for further downside. The US Dollar (USD) extended its steady ascent for a third consecutive session, supported by fading expectations of more aggressive monetary easing by the Federal Reserve (Fed), which remains a primary headwind for the non-yielding precious metal.
In addition, renewed optimism over a potential Russia–Ukraine peace agreement has added to the downward pressure on safe-haven gold. Looking ahead, investors will turn their attention to the release of the FOMC meeting minutes, while Fed Chair Jerome Powell’s upcoming remarks at the Jackson Hole Symposium may provide further clarity on the central bank’s policy trajectory. These developments are poised to play a pivotal role in shaping near-term USD demand and guiding the next directional move for the commodity
personal opinion:!!!
Gold price recovered to break through 3327 to gain liquidity and continue the downtrend
Important price zone to consider : !!!
Resistance zone point: 3330 zone
Sustainable trading to beat the market
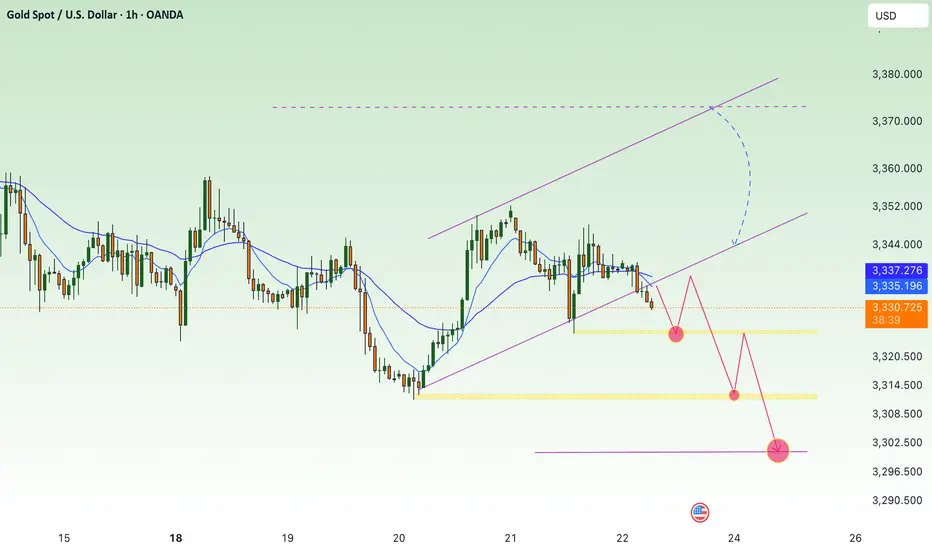
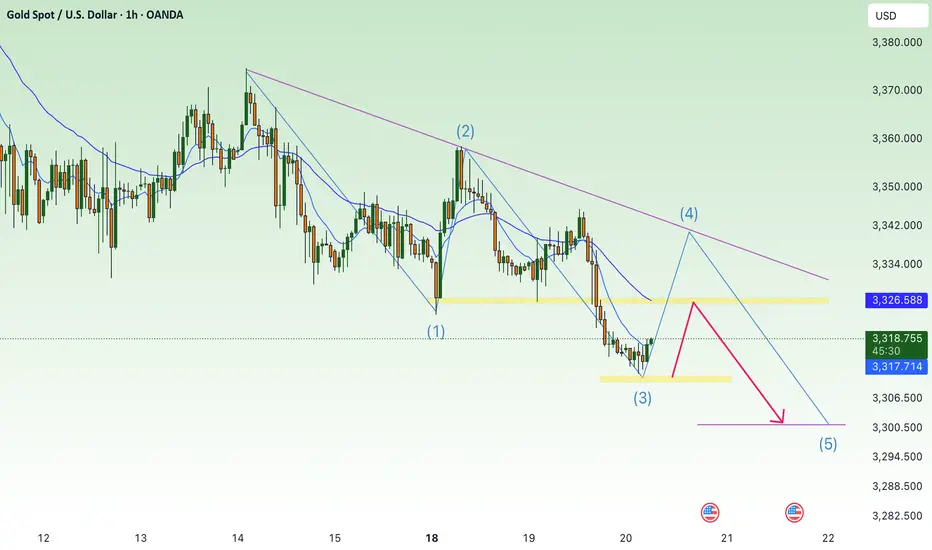
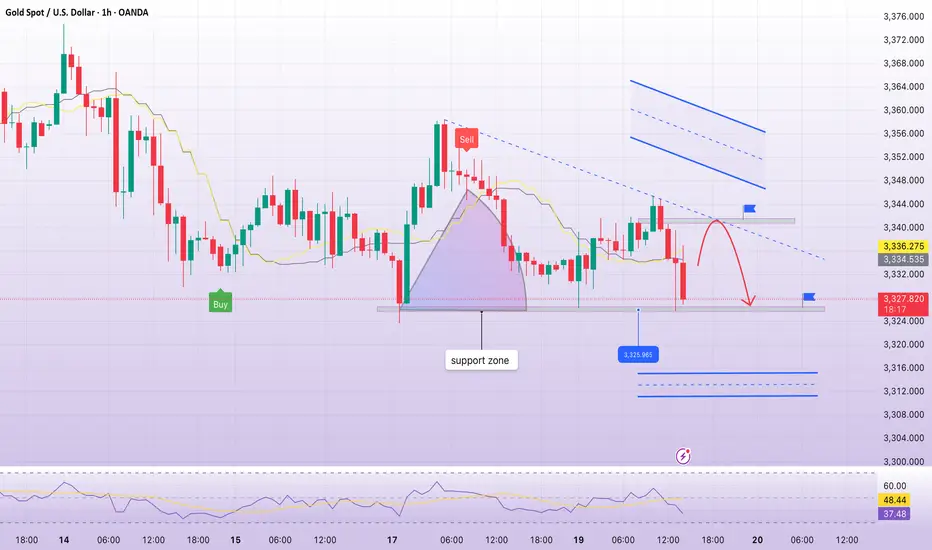
Accumulate, price range 3341 decreases along the trend linePlan XAU day: August 19, 2025
Related Information:!!!
Gold (XAU/USD) has surrendered part of its intraday advance and moved lower during the American session on Tuesday, as the resilience of the US Dollar (USD) weighs on the precious metal. Earlier in the day, Gold rebounded from an overnight dip triggered in the wake of Monday’s White House summit between US President Donald Trump, Ukrainian President Volodymyr Zelenskyy, and key European leaders. Although the talks underscored diplomatic alignment, the absence of a ceasefire has sustained elevated geopolitical uncertainty, thereby offering a degree of support to safe-haven assets.
As of writing, XAU/USD is trading near $3,335, retreating from an intraday peak of approximately $3,345. A stronger US Dollar continues to cap bullish momentum, while slightly softer US Treasury yields—following three consecutive sessions of gains—provide only limited relief for the metal. Looking ahead, market participants will turn their focus to the Jackson Hole Symposium and Wednesday’s release of the FOMC meeting minutes for clearer guidance on the Federal Reserve’s policy outlook. With markets still pricing in a September rate cut, any dovish signals could help re-energize demand for Gold in the sessions to come.
personal opinion:!!!
Support zone 3327, gold price reacted to recover showing that gold trend today is still mainly accumulating and decreasing according to the formed H1 trend line
Important price zone to consider : !!!
Resistance zone point: 3341 zone
Sustainable trading to beat the market
continue to accumulate waiting for FOMC, above 3300⭐️GOLDEN INFORMATION:
Gold (XAU/USD) found dip-buying interest in Tuesday’s Asian session, rebounding from the more than two-week low hit a day earlier. Support for the non-yielding metal comes largely from rising expectations that the Federal Reserve will restart its rate-cutting cycle in September. In addition, a cautious tone across broader markets is fueling safe-haven flows into bullion.
⭐️Personal comments NOVA:
Gold price continues to maintain the accumulation zone above 3300, the market moves sideways waiting for FOMC information
⭐️SET UP GOLD PRICE:
🔥SELL GOLD zone: 3374- 3376 SL 3381
TP1: $3365
TP2: $3355
TP3: $3342
🔥BUY GOLD zone: $3311-$3309 SL $3304
TP1: $3322
TP2: $3333
TP3: $3348
⭐️Technical analysis:
Based on technical indicators EMA 34, EMA89 and support resistance areas to set up a reasonable SELL order.
⭐️NOTE:
Note: Nova wishes traders to manage their capital well
- take the number of lots that match your capital
- Takeprofit equal to 4-6% of capital account
- Stoplose equal to 2-3% of capital account
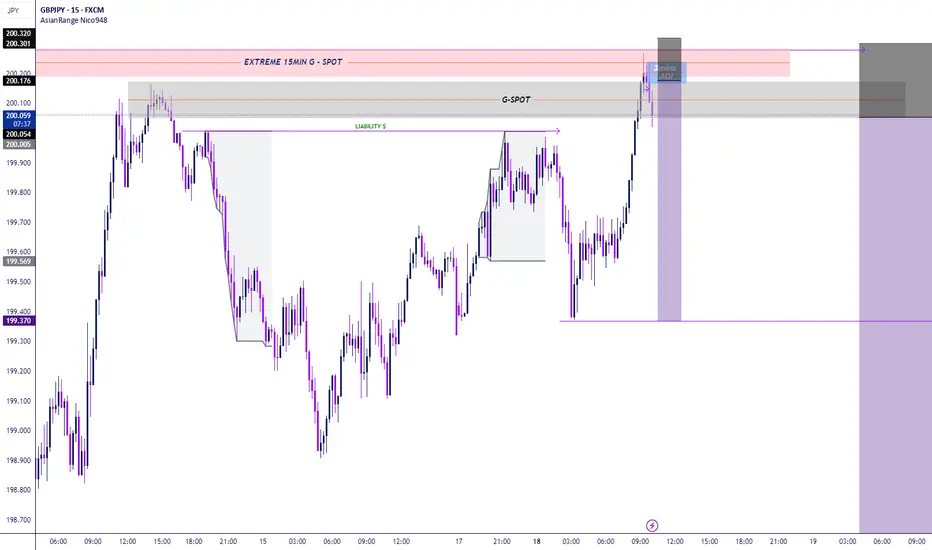
confirmed rejection on GJ In reference to our previous discussion, it is worth noting that the price has recently encountered strong resistance at an extreme 15-minute Area of Interest (AOI). Following this, on the hourly chart, we observed that the price closed within our designated 2-hour G-spot.
To gain further insights, I recommend examining the 5-minute or 3-minute charts, where you will notice a clear shift in trend, along with a 3-minute Order Block (OB) formation.
This presents a solid opportunity for a confirmed entry point. I encourage you to review your charts for a detailed analysis. Happy trading!
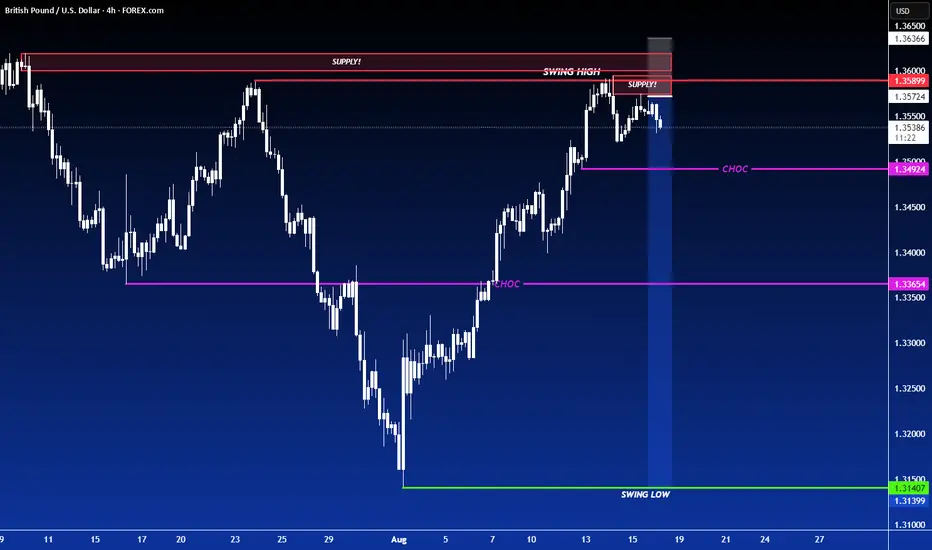
SHORT ON GBP/USDGU is ready to fall after a CHOC to the downside from a major supply area.
Dollar is also strong pushing to the upside which will cause pound to fall in this pair.
Looking to catch 200-400 pips on GU.
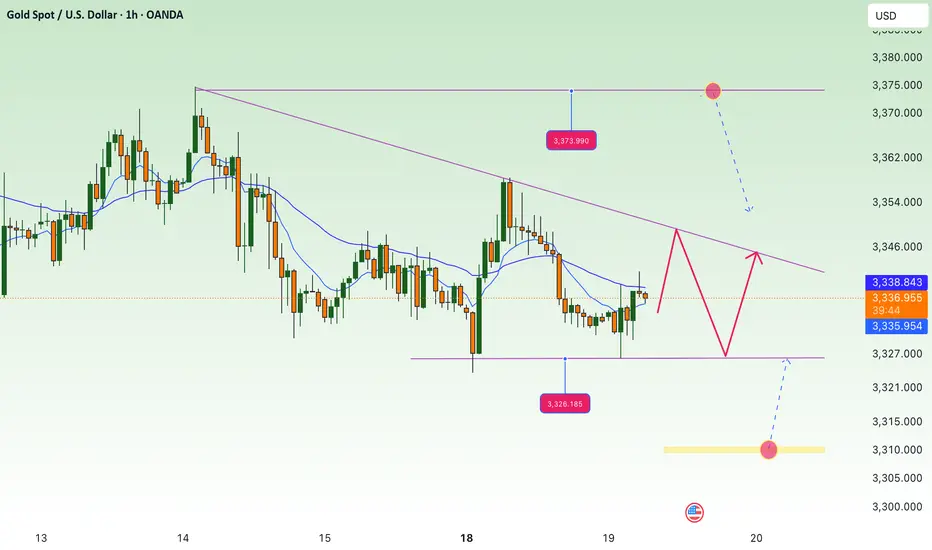
XAU recovers, mostly sideways below 3375⭐️GOLDEN INFORMATION:
Gold (XAU/USD) slipped toward $3,330 in early Asian trading on Monday, pressured by stronger-than-expected U.S. Producer Price Index (PPI) data. Investors now turn their attention to the meeting later today between U.S. President Donald Trump and Ukrainian President Volodymyr Zelenskiy for potential market-moving headlines.
Thursday’s hotter inflation print forced traders to scale back expectations for a September Federal Reserve rate cut, weighing on the yellow metal. The U.S. PPI rose 3.3% year-on-year in July, sharply above June’s 2.4% increase and well beyond the 2.5% forecast, reinforcing headwinds for bullion.
⭐️Personal comments NOVA:
Gold price recovers around 3353, downtrend line. Maintain accumulation below strong resistance zone 3375
⭐️SET UP GOLD PRICE:
🔥SELL GOLD zone: 3374- 3376 SL 3381
TP1: $3365
TP2: $3355
TP3: $3342
🔥BUY GOLD zone: $3312-$3310 SL $3305
TP1: $3322
TP2: $3333
TP3: $3348
⭐️Technical analysis:
Based on technical indicators EMA 34, EMA89 and support resistance areas to set up a reasonable SELL order.
⭐️NOTE:
Note: Nova wishes traders to manage their capital well
- take the number of lots that match your capital
- Takeprofit equal to 4-6% of capital account
- Stoplose equal to 2-3% of capital account
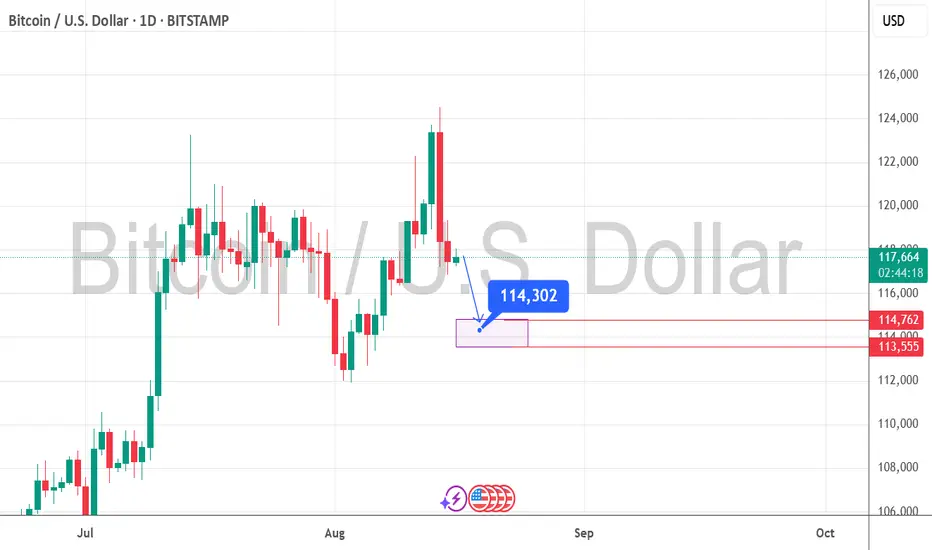
More Downside Expected for BitcoinBased on Bitcoin's recent movements, further downside is expected in this cryptocurrency
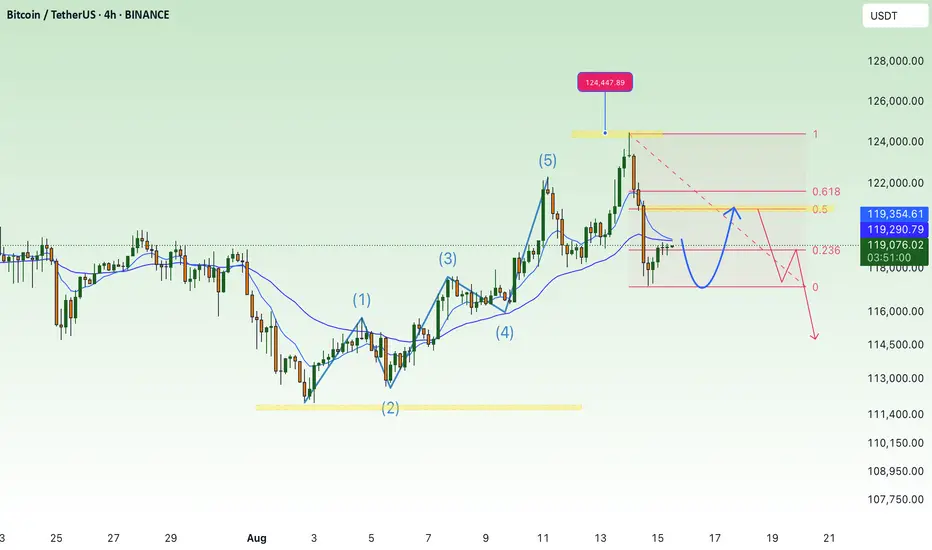
BTC Accumulates and Adjusts Slightly💎 BTC WEEKEND PLAN UPDATE (15/08)
BTC Analysis After PPI
Trading Highlights
After the PPI release, BTC completed its bullish wave and reached a peak of 123.2K, exactly at the 2.618 Fibonacci Extension level – a strong resistance zone that had been anticipated.
Afterward, the price sharply reversed, dropping to the 117K support area – aligning with the main uptrend line and the 0.236 Fibonacci retracement of the most recent bullish wave → this was where we successfully executed a bottom-picking buy.
Current Price Action
The price is now recovering from 117K toward the 120.7K – 121K resistance area (a confluence of the 0.618 Fibonacci retracement, a previous supply zone, and the H4 EMA).
The short-term trend remains a technical rebound after a sharp drop, with no confirmed sustained bullish reversal yet.
Scenarios & Next Trend
• Main Scenario: Price rebounds to 120.7K – 121K → faces selling pressure → sharply reverses downward following a corrective wave toward 116K – 115K (strong support).
• Alternative Scenario: If 121K is broken with high volume, BTC could revisit the 122.9K – 123.2K zone.
Key Levels
• Resistance: 120.7K – 121K / 122.9K – 123.2K
• Support: 117K / 116K – 115K”
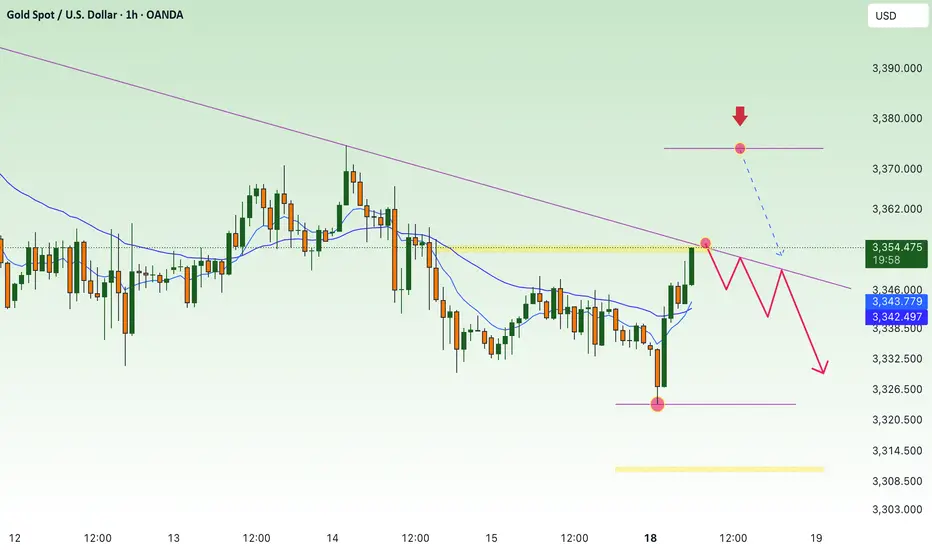
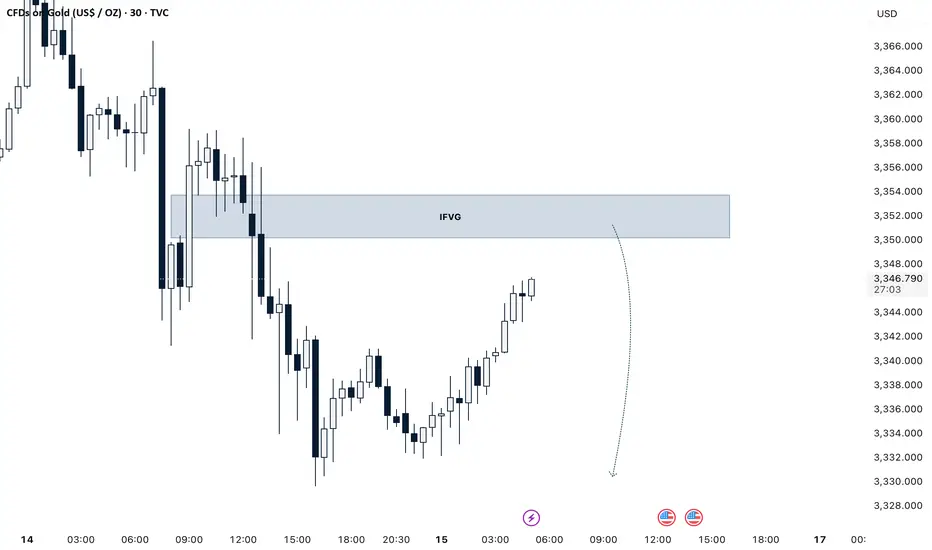
GOLD SHORT TRADE Gold Selling Area 3350 / 3354
Stoploss : 3360
Take Profit Levels : 3345, 3340, 3335, 3330
Reason : IFVG
Gold price pressure down, DXY recovers⭐️GOLDEN INFORMATION:
Gold (XAU/USD) found some buying interest in Friday’s Asian session, rebounding from the two-week low near $3,330 hit the day before. Thursday’s data showed that U.S. producer prices rose in July at the fastest monthly pace since 2022, prompting markets to scale back expectations for a jumbo 50-basis-point Federal Reserve rate cut in September. This has emerged as a major headwind for the non-yielding metal.
Additionally, a generally upbeat risk tone is limiting safe-haven demand, capping gold’s upside. However, fresh selling pressure on the U.S. Dollar has provided some support to the Dollar-denominated commodity.
⭐️Personal comments NOVA:
Gold prices fall after ppi news, negative market sentiment as fears of inflation return will affect September rate cut decision
⭐️SET UP GOLD PRICE:
🔥SELL GOLD zone: 3389- 3391 SL 3396
TP1: $3380
TP2: $3367
TP3: $3350
🔥BUY GOLD zone: $3311-$3309 SL $3304
TP1: $3324
TP2: $3333
TP3: $3348
⭐️Technical analysis:
Based on technical indicators EMA 34, EMA89 and support resistance areas to set up a reasonable SELL order.
⭐️NOTE:
Note: Nova wishes traders to manage their capital well
- take the number of lots that match your capital
- Takeprofit equal to 4-6% of capital account
- Stoplose equal to 2-3% of capital account
EURGBP SELL NOW 5 MIN TIMEFRAME4HR 10 20 ema bearish, on 30 min it's hitting off ema. Targeting imbalance (shown in black line). Impulse correction continuation trading.
