Tesla Update 2 Plan the trade and be PreparedUpdate on the Monthly chart with revised level which is worth noting on your charts and being prepared for . Enjoy the update and thanks for watching
Sellsignal

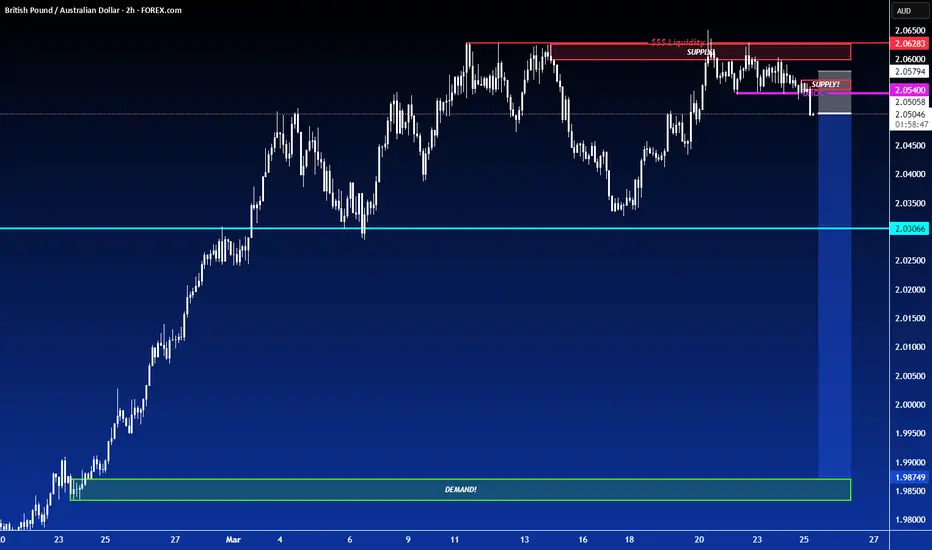
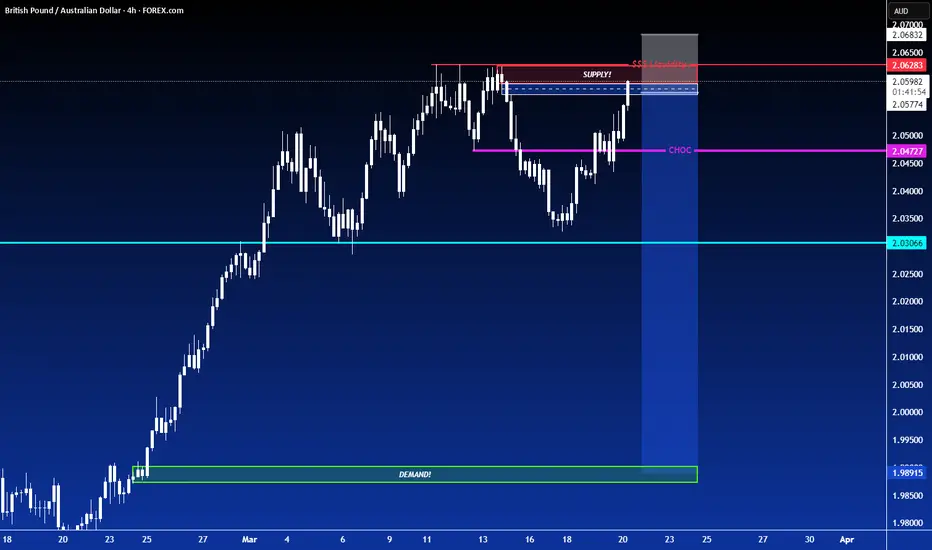
SHORT ON GBP/AUDGBP/AUD has the same setup as EUR/AUD from my post yesterday.
I am selling GBP/AUD for the same exact reasons.
Looking to catch 600 pips long term but over 200 pips easily this week!
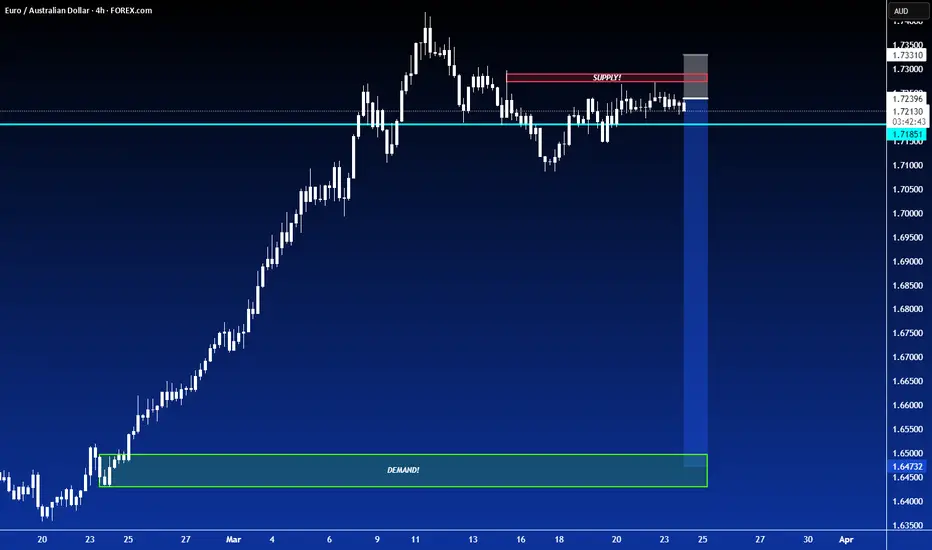
SHORT ON EUR/AUDEUR/AUD is currently at major resistance area.
It has given a nice change of character (choc) to the downside from being over brought for a long time.
I am selling EUR/AUD looking to catch over 500 pips as a swing trade.
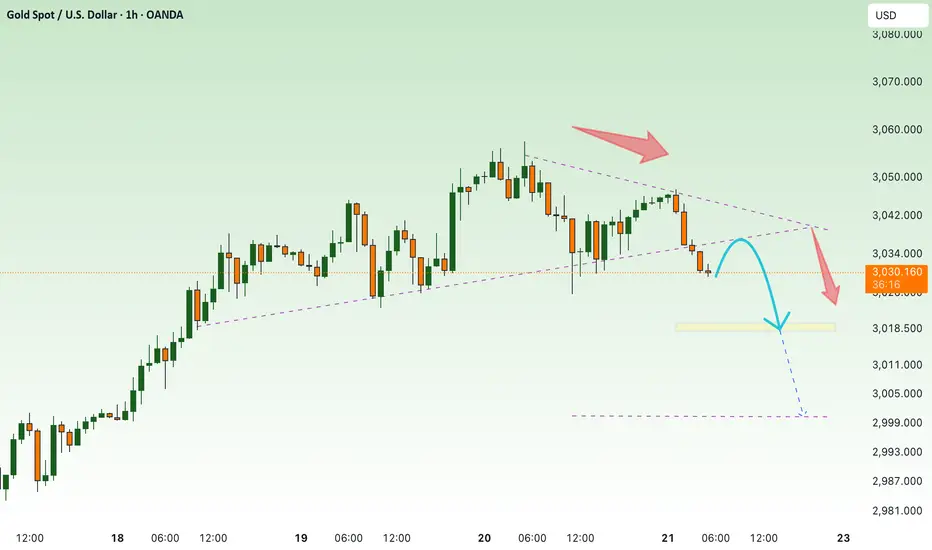
Gold declines, accumulate and wait for April news⭐️GOLDEN INFORMATION:
Gold price (XAU/USD) continues its pullback, slipping toward $3,025 in early Asian trading on Monday. The metal retreats from Thursday’s record high, driven by renewed optimism over a potential Ukraine peace deal. However, expectations of Federal Reserve (Fed) rate cuts and lingering economic uncertainties could provide support, limiting further downside for the yellow metal.
⭐️Personal comments NOVA:
Gold is under pressure to sell and take profits in the short term. There is still a lot of liquidity in the 3000 price zone. The price will continue to accumulate around $3000.
⭐️SET UP GOLD PRICE:
🔥SELL GOLD zone: $3031 - $3033 SL $3038
TP1: $3020
TP2: $3010
TP3: $3000
🔥BUY GOLD zone: $2991 - $2993 SL $2986
TP1: $3000
TP2: $3008
TP3: $3017
⭐️Technical analysis:
Based on technical indicators EMA 34, EMA89 and support resistance areas to set up a reasonable SELL order.
⭐️NOTE:
Note: Nova wishes traders to manage their capital well
- take the number of lots that match your capital
- Takeprofit equal to 4-6% of capital account
- Stoplose equal to 2-3% of capital account

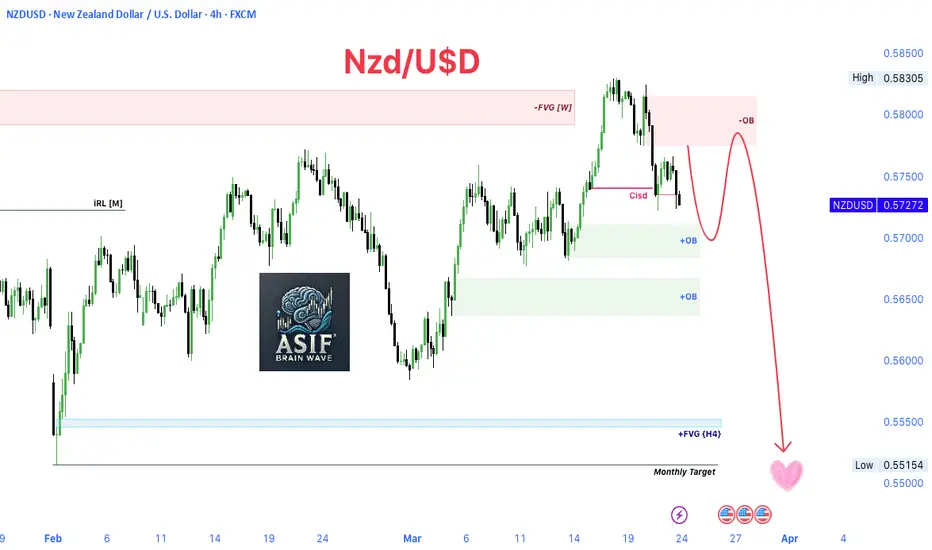
NZD/USD 4H Analysis – Smart Money Perspective🔍 NZD/USD – 4H Smart Money Concept Analysis by "Asif Brain Wave"
Key Zones Marked:
🔴 Weekly Fair Value Gap (FVG) and Order Block (OB) marked as strong resistance zones.
🟢 Two Bullish Order Blocks (+OB) highlighted below – potential areas for retracement or reaction.
🔵 +FVG (H4) near the Monthly Target, indicating a possible price magnet.
Market Structure & Expectation:
A clear CISD (Change in Structure Direction) indicates bearish market behavior.
The red path projection shows:
A potential short-term retracement into the upper OB area.
Followed by a sharp bearish drop toward the monthly target.
💘 Final target near 0.55154, marked with a heart symbol as a visual touch – representing your target zone with a personal flair.
Highlighted Price Levels:
High: 0.58305
Current Price: 0.57272
Projected Target (Low): 0.55154
AUD/USD– Bearish Momentum Unleashed!AUD/USD 🐨💵 – Bearish Momentum Unleashed! 🚨📉
Price rejected from Daily & H4 FVG zones 🔥
Pullback expected… then a potential drop toward 0.61872 💔
Weekly Bias = Bearish ✅
Eyes on liquidity grab below recent lows 👀💣
Are you ready for the move? 💼💸 #ForexTrading #AUDUSD #SmartMoneyConcepts #FVG #PriceAction #LiquidityHunt

Gold price start to adjust yet?⭐️GOLDEN INFORMATION:
Gold prices (XAU/USD) face renewed selling pressure during the Asian session on Friday, retreating toward the $3,030 level in recent trading, inching closer to the previous session’s low. The US Dollar (USD) maintains its upward trajectory for the third consecutive day, prompting some profit-taking on the precious metal ahead of the weekend. However, a confluence of supportive factors is likely to keep bullion resilient, positioning it for a third consecutive week of gains.
⭐️Personal comments NOVA:
Breaking the trend, has gold price really been in the weekend price adjustment rhythm? According to NOVA, it has started. Before the tax policies in early April, the market needs a little balance in terms of liquidity on the selling side.
⭐️SET UP GOLD PRICE:
🔥SELL GOLD zone: $3040 - $3042 SL $3047
TP1: $3030
TP2: $3020
TP3: $3010
🔥BUY GOLD zone: $3019 - $3017 SL $3014 scalping
TP1: $3023
TP2: $3030
TP3: $3040
🔥BUY GOLD zone: $3000 - $3002 SL $2995
TP1: $3010
TP2: $3020
TP3: $3030
⭐️Technical analysis:
Based on technical indicators EMA 34, EMA89 and support resistance areas to set up a reasonable SELL order.
⭐️NOTE:
Note: Nova wishes traders to manage their capital well
- take the number of lots that match your capital
- Takeprofit equal to 4-6% of capital account
- Stoplose equal to 2-3% of capital account
SMCI -- more weakness ahead near term!looking for additional sell sequences to fill gap targets at 33.7 and 31.5 levels as we approach tariffs being implemented on 4/2/25.
holding put options for 4/17 expiration

SHORT ON GBP/AUDGBP/AUD Is currently at a major resistance level.
I has given a change of character (choc) to the downside and has also mitigated a fvg to the downside.
I will be selling GBP/AUD to the next demand level for over 500 pips.
This is a swing trade that may take a few days to play out.
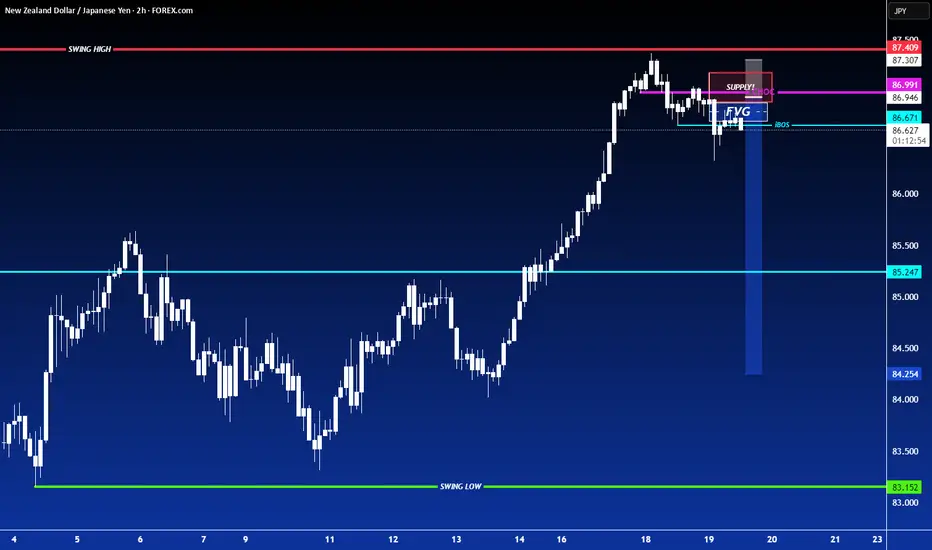
SHORT ON NZD/JPYNZD/JPY Has rejected a major resistance area and is breaking structure to the downside.
The JPY index is looking strong from a major demand level. XXX/JPY pairs do the opposite of whatever the index does.
Therefore I will be selling NZD/JPY looking to catch over 200 pips easy.
SHORT ON CAD/JPYCAD/JPY is currently at a major resistance level/zone and has formed a minor double top just breaking the neckline on the lower timeframes.
I will be selling cad/jpy to the next major swing low for about 200 pips.

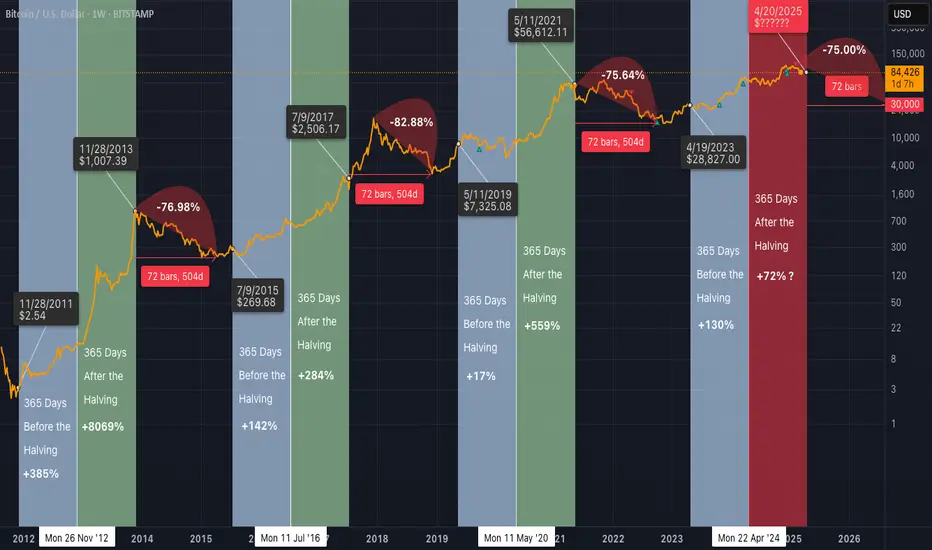
Bitcoin’s Final Surge? One Month Before the Post-Halving Drop!Bitcoin Halving Cycles: What History Tells Us About 2025
The Bitcoin halving is a highly anticipated event that occurs approximately every four years, reducing the block reward by 50% ⛏️. This supply shock has historically been a major catalyst for price movements. By analyzing previous cycles, we can attempt to forecast what might happen in the upcoming halving cycle of 2025.
Historical Performance of Bitcoin Halving Cycles
First Halving (2012)
365 Days Before Halving: 📈 +385%
365 Days After Halving: 🚀 +8069%
Peak-to-Trough Decline After Peak: 🔻 -76.98%
Second Halving (2016)
365 Days Before Halving: 📈 +142%
365 Days After Halving: 🚀 +284%
Peak-to-Trough Decline After Peak: 🔻 -82.88%
Third Halving (2020)
365 Days Before Halving: 📈 +17%
365 Days After Halving: 🚀 +559%
Peak-to-Trough Decline After Peak: 🔻 -75.64%
Current Cycle and 2025 Halving Expectations
- Last Halving Date: 📅 April 15, 2024
- 365 Days Before Halving: Bitcoin gained 📈 +130% from $28,827 (April 2023) to around $65,000.
- Projected 365 Days After Halving (April 2025): If history rhymes, we could see a price increase of around 📊 +72%, with a potential closure at the current Peak of $110,000.
- Post-Peak Decline Estimate: Previous post-halving peaks saw declines of 📉 75%–82%. With Bitcoin's all-time high around $110,000, a 🔻 75% drawdown would target a bottom of ~$30,000 before the next recovery cycle.
Key Takeaways
Bitcoin's price tends to rally leading up to the halving, but the largest gains historically occur in the year following the halving. 📊
Post-bull run drawdowns are severe with past declines ranging from 🔻 -75% to -82%.
While the Pre and Post-Halving theory suggests that the decline starts around 365 days after the halving, the full bear market typically unfolds between ⏳ 486 to 510 days post-halving. This aligns with the ⛓️ 70,000-block mark post-halving, as Bitcoin halvings occur approximately every 210,000 blocks. This means that while the peak may occur within a year after the halving, the deep bearish phase historically becomes evident around 1.3 to 1.4 years after the halving, reinforcing the long-term cyclical nature of Bitcoin’s market trends 🔄.
Final Thoughts
Bitcoin halving events are pivotal moments in the crypto market cycle 🔥. The data suggests that 2025 could see significant gains, but we should also be prepared for the inevitable correction that follows 📉.
What are your thoughts on the upcoming cycle? Share your insights in the comments!
Disclaimer
This article is for informational and educational purposes only and does not constitute financial, investment, or trading advice. The historical performance of Bitcoin halving cycles does not guarantee future results, and past trends may not necessarily repeat. Cryptocurrency markets are highly volatile, and investing in Bitcoin or any other asset carries risks, including the potential loss of capital.
Readers should conduct their own research, assess their risk tolerance, and consult with a licensed financial advisor before making any investment decisions. The information provided is based on publicly available data and historical observations, which may be subject to change.
Sources:
Nakamoto, S. (2008). Bitcoin: A Peer-to-Peer Electronic Cash System.
Bitcoin block time and halving data: Blockchain.com
Historical Bitcoin price data: CoinMarketCap
Bitcoin halving cycles and trends: Messari
Market performance metrics: Glassnode
By reading this article, you acknowledge that you are solely responsible for your own financial decisions and that the author assumes no liability for any losses incurred from trading or investing. 🚀
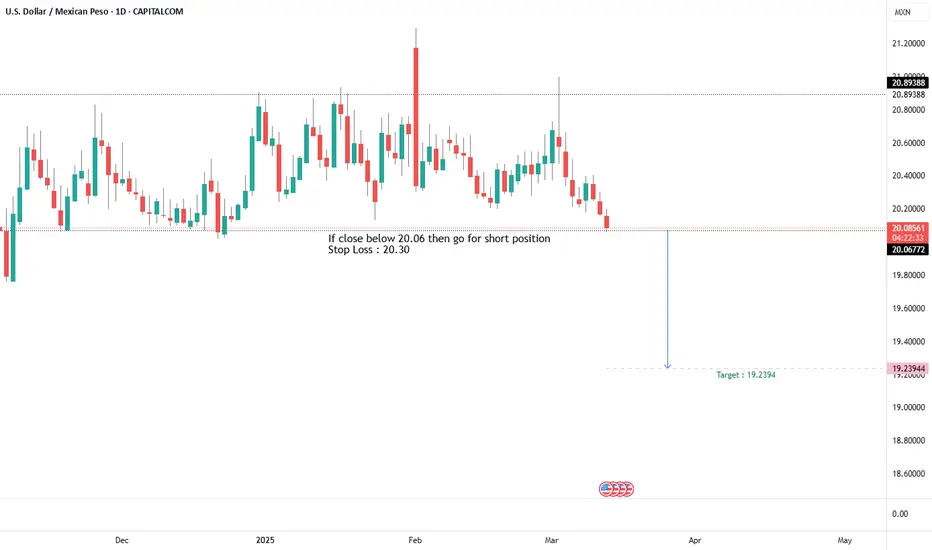
wait and watch... if breakout below then go for short. It seems that USD MNX is on breakout. If it close below then go for short.
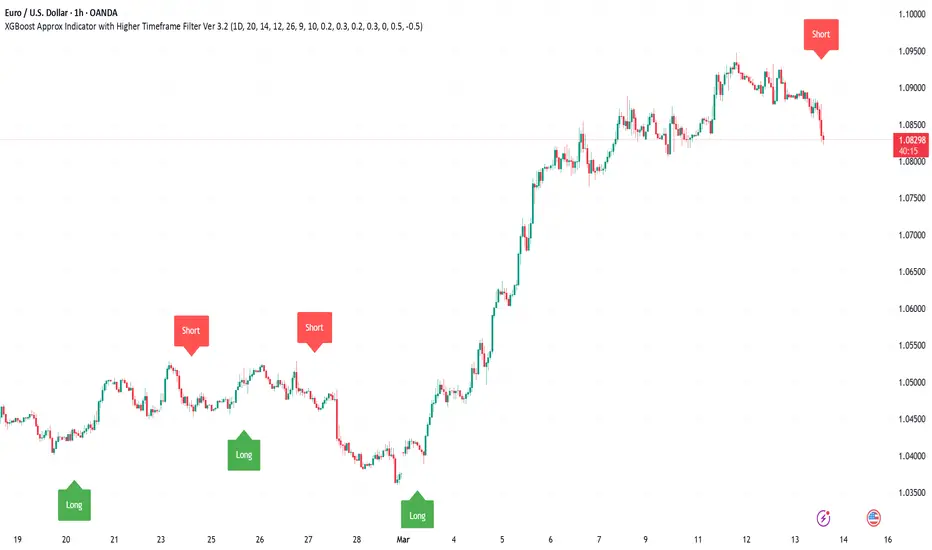
EURUSD gains bearish momentumAfter Trumpinho stated increasing he may increase wine taxes in case Canada do the same on whiskey. The financial turbulence is just winding up, as US PPI data appaered lower as previously expected. All EUR based pairs are turned down.
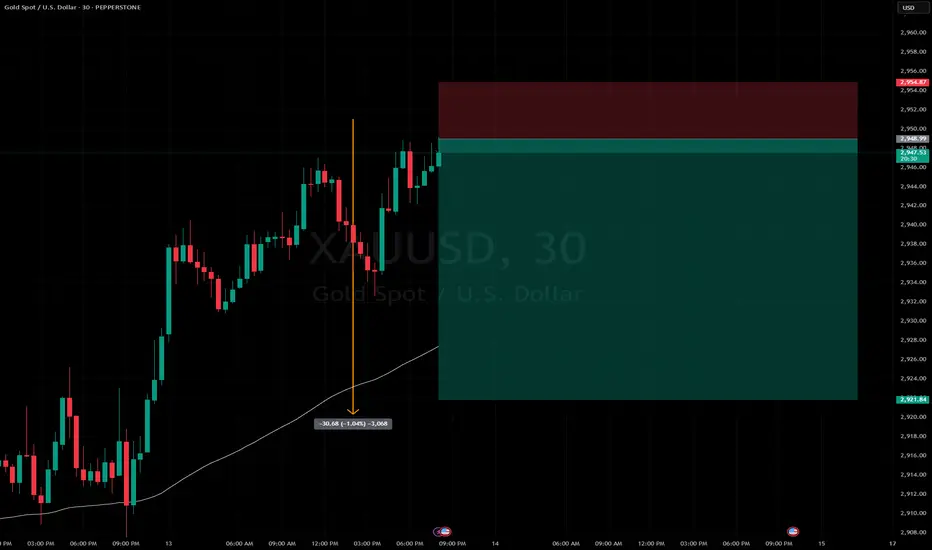
Bearish thesis for GOLD for the weekend XAU had been on a steady Bullish Run , Rightfully so.
if any asset deserves to appreciate in its price while doing the most amount of Good, its GOLD
But we traders , look for technical opportunities
that's where this trade idea comes in.
- Gold is pressuring its recent range with limited bullish strength
- also its its most popular cross - USD gaining substantial momentum the last 2 Quarters can make room for a correction before the trend continues to the upside.
therefore falling back on pure technical calculations leads us back to our excel sheets for daily range projections which put our range to be exactly 1.03% or 3034 /303* pips depending your brokerage metrics.
which leads me to make this 1:4 Trade idea for this week.
cheers.
Gold price recovers, waiting for CPI inflation data today⭐️Smart investment, Strong finance
⭐️GOLDEN INFORMATION:
The US 10-year Treasury yield rebounds, rising six basis points to 4.282% as markets focus on potential Federal Reserve rate cuts.
Meanwhile, US real yields—measured by the 10-year Treasury Inflation-Protected Securities (TIPS), which typically move inversely to gold prices—climb 5.5 basis points to 1.963%, posing a headwind for the non-yielding metal.
The Atlanta Fed’s GDP Now model projects a -2.4% contraction for Q1 2025, marking the first negative reading since the COVID-19 pandemic.
⭐️Personal comments NOVA:
Recovering in the sideway price range below 2930
⭐️SET UP GOLD PRICE:
🔥SELL GOLD zone: $2928 - $2930 SL $2935
TP1: $2920
TP2: $2910
TP3: $2900
🔥BUY GOLD zone: $2894 - $2896 SL $2889
TP1: $2900
TP2: $2910
TP3: $2920
⭐️Technical analysis:
Based on technical indicators EMA 34, EMA89 and support resistance areas to set up a reasonable SELL order.
⭐️NOTE:
Note: Nova wishes traders to manage their capital well
- take the number of lots that match your capital
- Takeprofit equal to 4-6% of capital account
- Stoplose equal to 2-3% of capital account
Bears dominate gold continues today⭐️Smart investment, Strong finance
⭐️GOLDEN INFORMATION:
Gold prices (XAU/USD) find support near the $2,880 level during Tuesday’s Asian session, drawing dip-buyers and partially recovering from the previous day’s drop to a one-week low.
Investor sentiment remains cautious amid uncertainty over US President Donald Trump’s trade policies and their potential impact on the global economy. The prevailing risk-off mood, compounded by geopolitical tensions, continues to fuel demand for the safe-haven metal
⭐️Personal comments NOVA:
US economy plummets, fears of recession due to rising trade tensions
⭐️SET UP GOLD PRICE:
🔥SELL GOLD zone: $2915 - $2917 SL $2922
TP1: $2910
TP2: $2900
TP3: $2890
🔥BUY GOLD zone: $2860 - $2862 SL $2855
TP1: $2870
TP2: $2880
TP3: $2890
⭐️Technical analysis:
Based on technical indicators EMA 34, EMA89 and support resistance areas to set up a reasonable SELL order.
⭐️NOTE:
Note: Nova wishes traders to manage their capital well
- take the number of lots that match your capital
- Takeprofit equal to 4-6% of capital account
- Stoplose equal to 2-3% of capital account
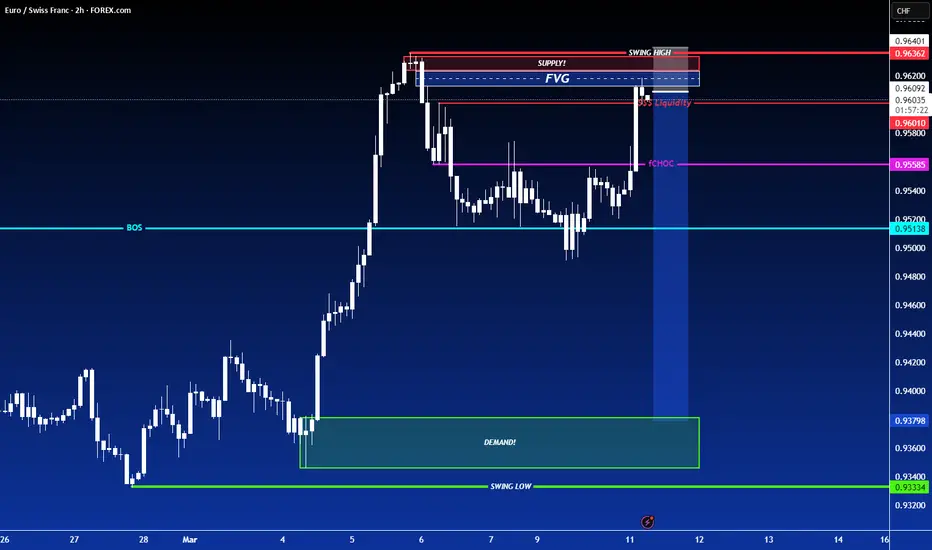
SHORT ON EUR/CHFEUR/CHF is currently at a major resistance level and his recently mitigated a FVG sitting in the same zone.
Price has been rising in what seems like forever on this pair, we finally have gotten our change of character (choc) to the downside with sweeps of liquidity and fvg's now balanced out.
I expect price to fall to the next demand level where plenty of liquidity sits.
I am selling EUR/CHF now looking to make over 200 pips to the downside.
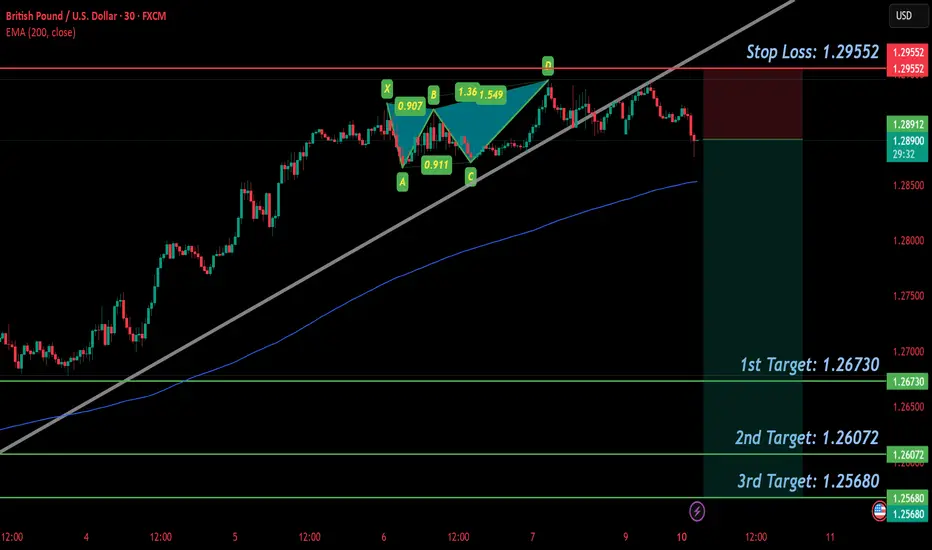
GBP/USD SELL IDEA (R:R=5)Selling GBP/USD now. I placed a sell earlier at 1.29276 after seeing a wonderful BUTTERFLY form on the 30 min chart. Already starting to form lower highs and lower lows on smaller timeframes.
Stop Loss is: 1.29552
(Due to SL hunting)
Please move SL to break even when trade is 100+ pips in profit.
1st Target: 1.26730
2nd Target: 1.26072
3rd Target: 1.25680
Happy Trading! :)
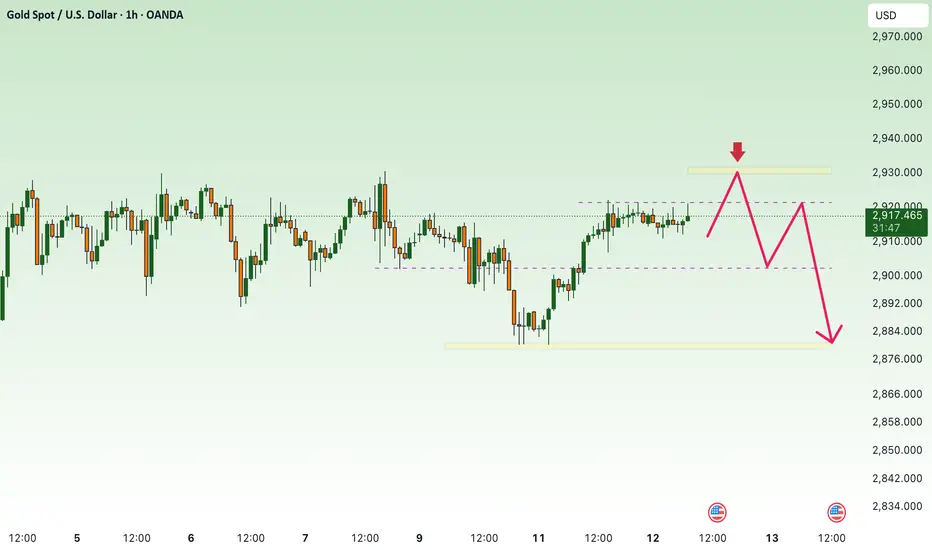
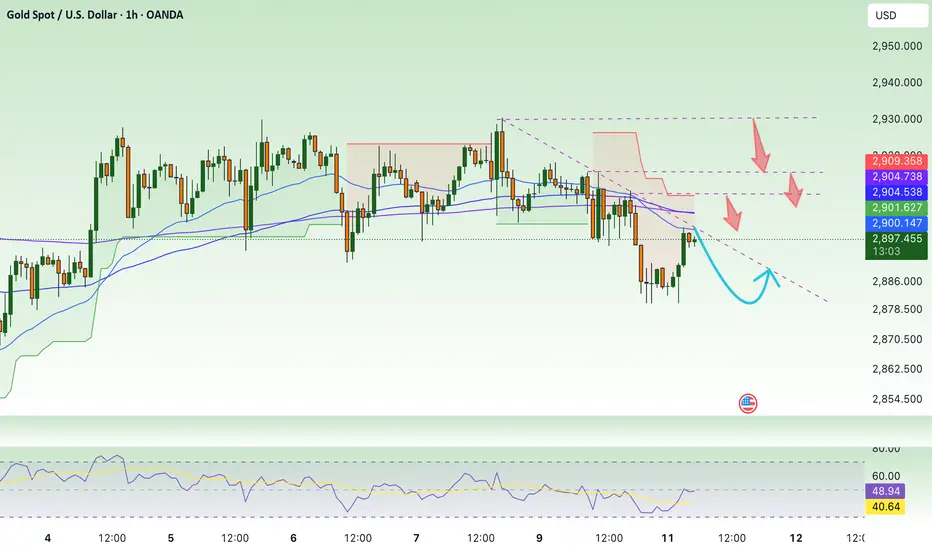
H1 bearish pattern appears , XAU / USD ⭐️Smart investment, Strong finance
⭐️GOLDEN INFORMATION:
The US labor market showed signs of slowing last month, reinforcing expectations that the Federal Reserve will proceed with multiple rate cuts this year. This sentiment pressured the US Dollar while boosting the price of USD-denominated commodities.
Data from the US Bureau of Labor Statistics (BLS) on Friday revealed that Nonfarm Payrolls (NFP) rose by 151,000 in February, following January’s upwardly revised 125,000 (previously 143,000), falling short of the 160,000 market forecast.
Meanwhile, the Unemployment Rate edged up to 4.1% from 4.0% in January, while annual wage inflation, measured by Average Hourly Earnings, ticked higher to 4.0% from 3.9%, though it was revised down from an initial 4.1%.
⭐️Personal comments NOVA:
Gold price is sideways around 2910 at the beginning of the week, H1 frame shows head and shoulders pattern, downtrend
⭐️SET UP GOLD PRICE:
🔥SELL GOLD zone: $2928 - $2930 SL $2935
TP1: $2920
TP2: $2910
TP3: $2900
🔥BUY GOLD zone: $2891 - $2893 SL $2886
TP1: $2900
TP2: $2910
TP3: $2920
⭐️Technical analysis:
Based on technical indicators EMA 34, EMA89 and support resistance areas to set up a reasonable SELL order.
⭐️NOTE:
Note: Nova wishes traders to manage their capital well
- take the number of lots that match your capital
- Takeprofit equal to 4-6% of capital account
- Stoplose equal to 2-3% of capital account

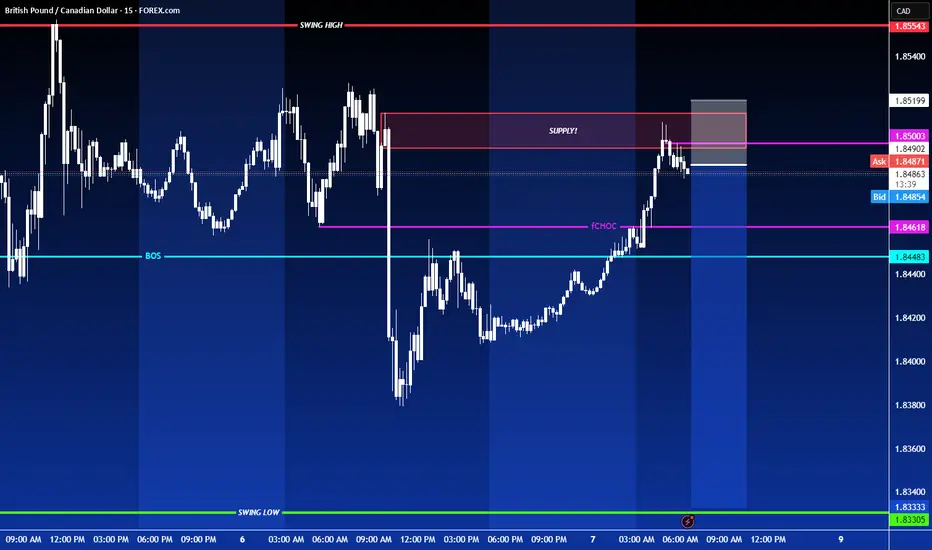
SHORT ON GBP/CADGBP/CAD is rejecting a key supply area on the 15min after continuing to make (Lower Highs) on the Higher Time Frames.
There has been a change in market structure from Up to down on the lower timeframe signaling a possible drop.
GBP/CAD is highly over brought and I believe its ready to fall.
I will be selling GBP/CAD to the next swing low for about 100-150 pips. OANDA:GBPCAD
USD/JPY SHORTSorry for the late one but this was a good trade and if you guys got involved that's a amamzing return.
Keep upto date by following my trades and stay tunes for more signals
This analysis is based on the provided image and should not be considered financial advice. Trading involves risks, and it is essential to conduct your own research and consult with a financial advisor before making any trading decisions.

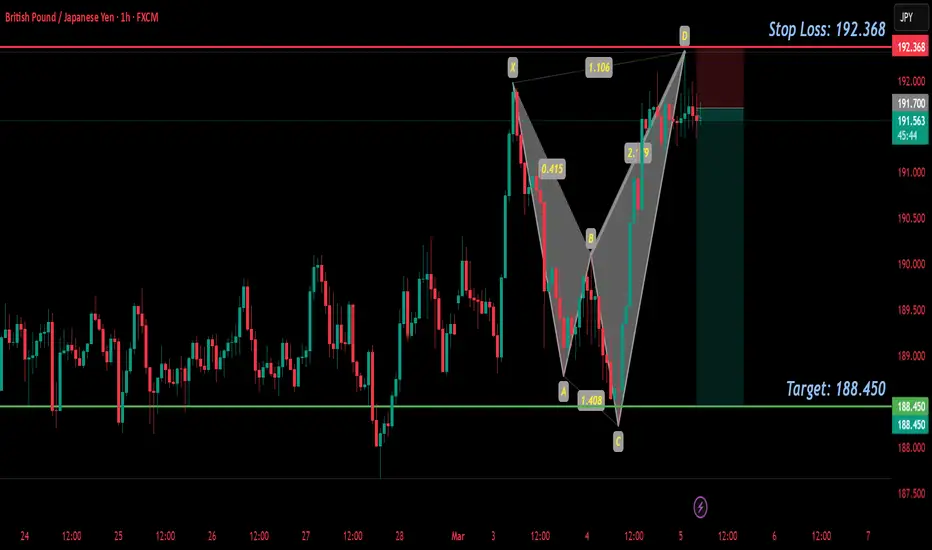
GBP/JPY SELL IDEA (R:R=4.8)I just placed a sell order for GBP/JPY at 191.700. We have a wonderful X BAT that just formed on the 1 HOUR chart.
Please trade with proper risk management, since we have news announcements coming out at 8:15 AM EST today.
ADP Non-Farm Employment Change
Stop Loss: 192.368 (Daily High)
Take Profit: 188.450
Happy Trading!