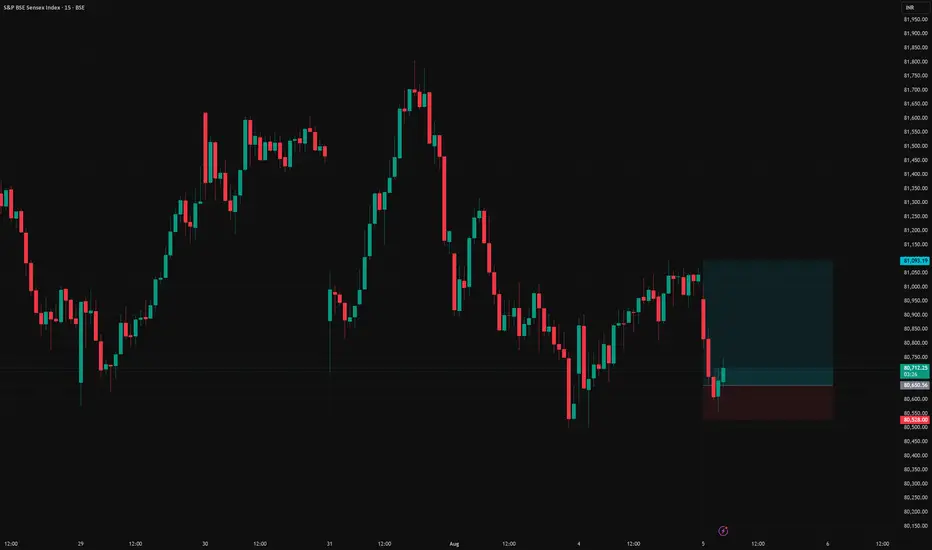
Sensex long setupSensex long setup
Entry - 80651
Stop loss - 80528.00
Target - 81093
Risk Reward - 1:3.6
Sensexexpiry
Trap Set at the Top? Sensex Sell-Side Objective = 81,886Sensex is currently trading at 82,220 and showing early signs of a potential sell-side move based on Smart Money dynamics. After grabbing buy-side liquidity above recent highs, we’ve now entered a distribution phase.
Price has shown rejection from a premium zone, and a market structure shift is forming on lower timeframes — all pointing toward a probable move to the sell-side liquidity pool near 81,886.
This zone aligns with Smart Money's objective to tap resting liquidity below recent swing lows before any major reversal. Caution is advised for longs. Wait for confirmation if you're planning to ride the short move with the institutions. 🎯💼

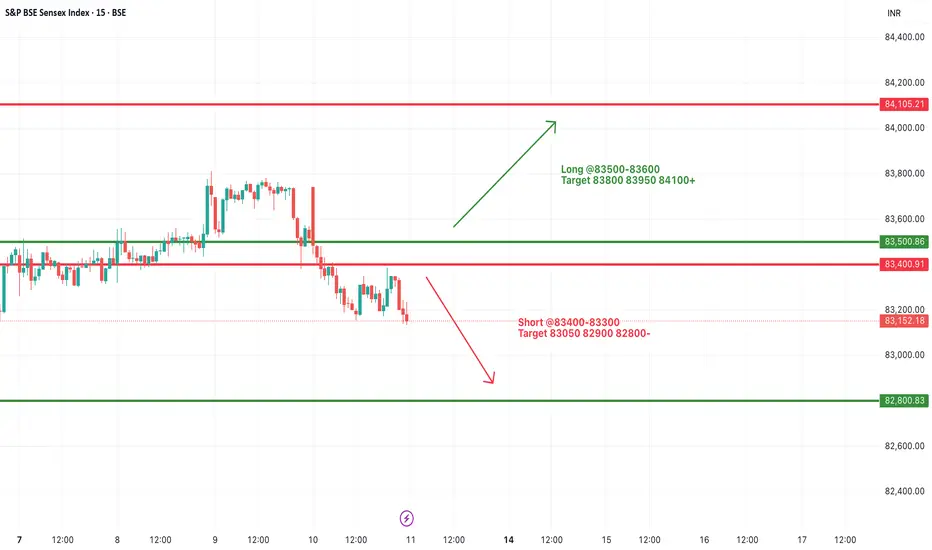
#SENSEX Intraday Support and Resistance Levels - 11/07/2025Sensex is expected to open flat after a consolidation phase and weak closing in the previous session. The index is currently hovering near the support zone of 83400–83300. If Sensex breaks and sustains below this level, further downside may unfold toward 83050, 82900, and 82800. This level should be watched closely as a decisive break may trigger increased selling pressure.
On the upside, a recovery and breakout above 83500–83600 could indicate a potential reversal. Sustaining above this zone can lead the index to rally toward 83800, 83950, and possibly 84100+. However, the price action near this resistance band will be crucial for any confirmation of bullish strength.
Overall, the sentiment remains weak with a bearish bias unless a strong breakout happens on the upside. Traders should remain cautious and focus on these breakout levels for intraday opportunities with proper risk management.
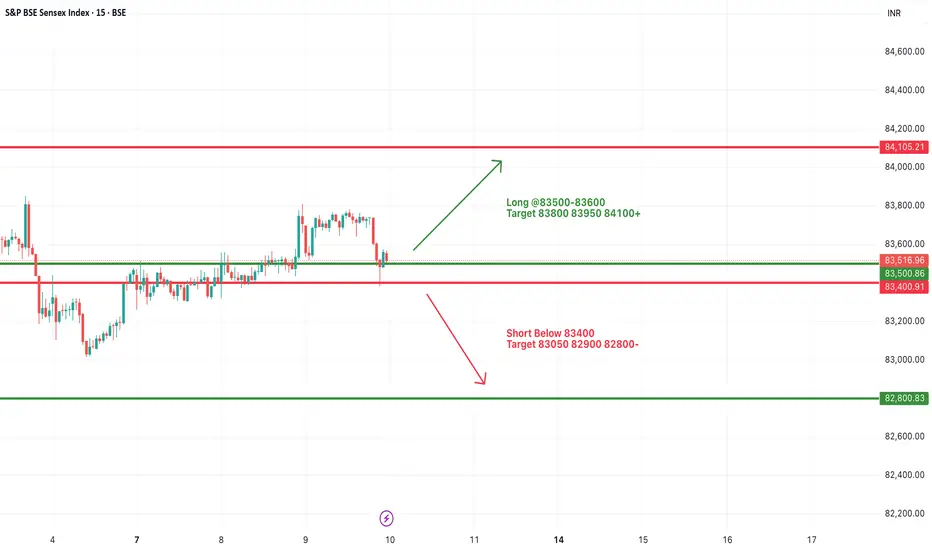
#SENSEX Intraday Support and Resistance Levels - 10/07/2025Sensex is expected to open flat today, continuing the consolidation observed in the past few sessions. The price action remains range-bound with key support near 83400 and resistance around 83600 levels.
Currently, Sensex is hovering near its critical range with buyers and sellers struggling for control. A breakout above the 83500–83600 zone may trigger fresh bullish momentum with targets at 83800, 83950, and 84100+. Sustained movement above 84100 could signal a stronger trend reversal.
On the downside, a breakdown below the 83400 level could lead to weakness, with immediate targets at 83050, 82900, and 82800-.
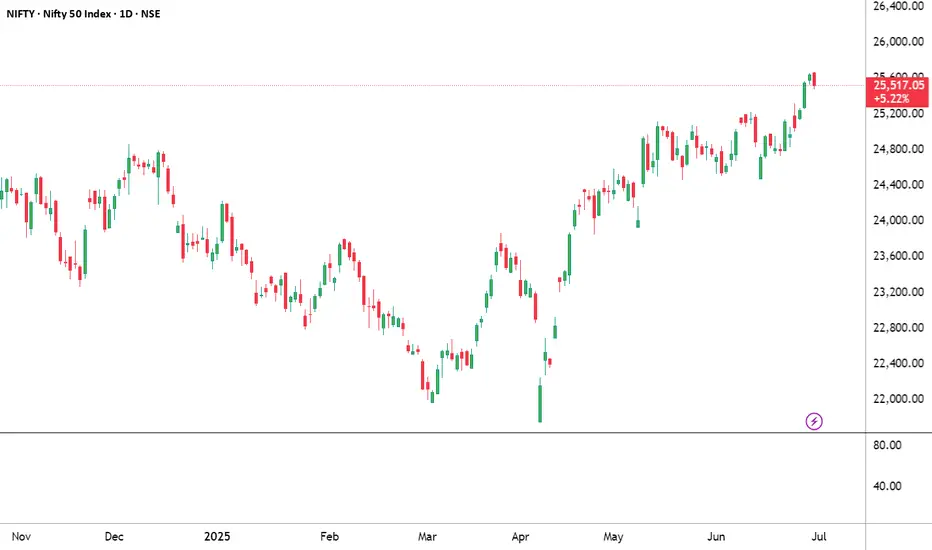
NIFTY THIS WEEK? What's the plan
"There’s more hidden in a candle chart than most headlines will ever reveal.”
If you look at this NIFTY chart casually, you’ll see just another uptrend. But if you feel the price — really look into the structure — you’ll notice something deeper:
We’re not just in a rally. We’re in a breakout after base-building. And that’s a very different game.
What I Noticed This Week:
1. Strong Follow-Through
NIFTY didn’t just pop — it’s sustaining gains. Each green candle is following the next without hesitation. That means institutions are buying, not just retailers reacting.
2. Previous Resistance = Gone
Look back at 25,200–25,300. That zone rejected price multiple times. Now? It’s broken clean, with a bullish Marubozu-style candle. That’s a confirmation, not just a fluke.
3. No Panic Selling Yet
Usually, breakouts invite profit booking. This one? Sellers are quiet. When there's no rejection at new highs, it tells you confidence is strong.
But Here’s What You Must Watch:
Are we near psychological exhaustion? Markets can get euphoric and overextend - even in strong trends. Volume Spike or Divergence? If volumes dry or RSI starts diverging, stay alert.
Global cues & Bank Nifty:
If Bank Nifty stalls, NIFTY will slow too. Watch correlation.
What This Means for You:
Trend is strong, but smart traders plan exits in upmoves - not panic in downmoves.
Ask yourself:
Do you have entries based on structure?
Are you overexposed at highs, hoping for more?
Are you following momentum blindly or with plan?
Personal Reflection:
I’ve learned this the hard way:
“Buying strength is good. But riding strength without a stop loss is just greed in disguise.”
So this week:
Observe, don’t chase.
Track - don’t blindly enter.
There’s always another breakout. But there’s only one portfolio.
Sensex Expiry Analysis – 7th January 2025
Sensex Expiry Analysis – 7th January 2025
Market Sentiment:
Overall Bias: Slightly bearish with range-bound possibilities unless a breakout/breakdown occurs.
Key Levels:
Resistance Levels: 78,000 (Immediate), 78,400 (Major).
Support Levels: 77,400 (Immediate), 77,200 (Critical).
Rationale for the Trade Setups:
Intraday Sell Setup:
A breakdown below 77,400 will trigger selling pressure, with targets at 77,200 and 77,000 due to high put writing and liquidity below.
Confidence Level: High, supported by FII/DII bearish positions and price action.
Intraday Buy Setup:
A breakout above 78,000 may trigger a gamma squeeze, with rapid movement toward 78,400 and 78,500 due to unwinding of call positions.
Confidence Level: Moderate, requires confirmation with volume.
Key Observations:
Option Chain Analysis:
Strong call writing at 78,000, making it a crucial resistance.
Heavy put writing at 77,400, indicating immediate support.
Implied Volatility (IV):
Slight increase (+2%), indicating expectations of higher volatility.
Gamma Squeeze Potential:
Above 78,000: Possible sharp upside move to 78,500.
Below 77,200: Potential downside acceleration to 77,000.
Execution Plan:
Buy Above 78,000: Wait for a 15-minute candle close above 78,000 with volume confirmation.
Sell Below 77,400: Enter on a clear breakdown below 77,400 with strong momentum.
Additional Notes:
Maintain tight stop-losses due to expiry-day volatility.
FIIs are net bearish in index futures; this reinforces the downside bias.
Range-bound expiry is possible if the index remains between 77,400-78,000.
Disclaimer:
The information provided is for educational and informational purposes only and should not be construed as financial or trading advice.Please consult with a certified financial advisor and use your discretion before making any trading decisions.

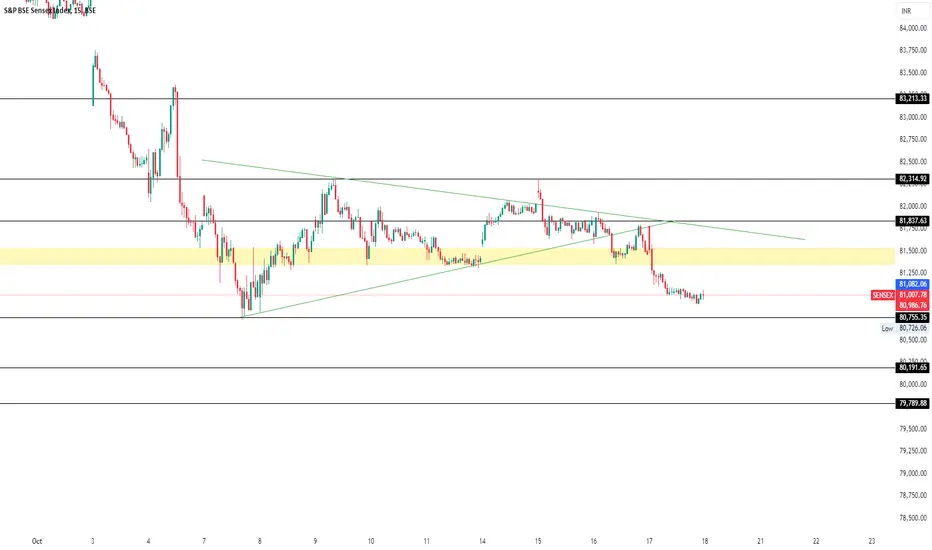
Sensex Analysis for Tomorrow 18/10/24Sensex Analysis for Tomorrow 18/10/24
Pls Use Brokers chart for live price updation in Sensex
Yellow Zone is major Resistance Level.
All The important are given with horizontal black line.
Sensex (SENSEX) AnalysisFollow and Boost the post, Thanks.
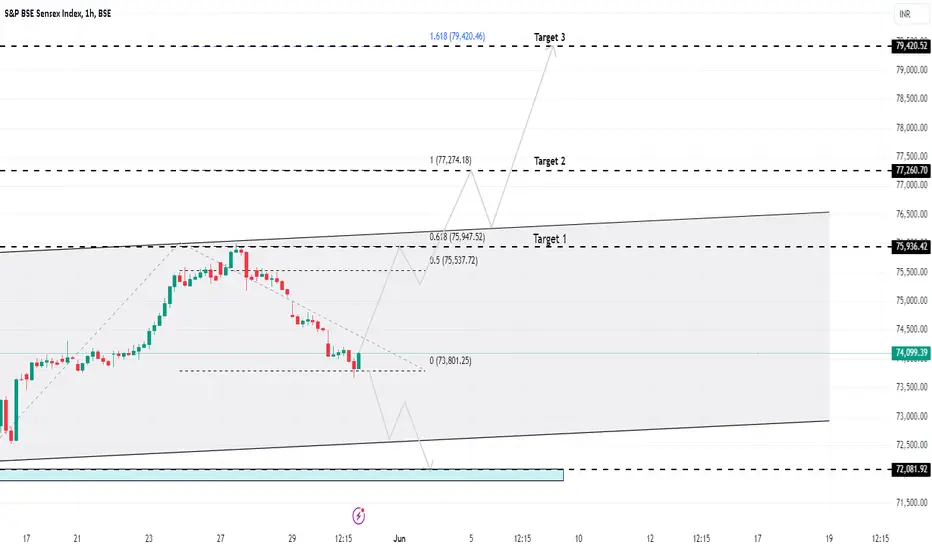
Based on the 1-hour chart for the S&P BSE Sensex Index, here is the summary and analysis:
Key Levels:
- Current Price: 73,885.60
- Retracement Levels:
- 0.5 Retracement: 75,537.72
- 0.618 Retracement: 75,947.52
- Targets:
- Target 1: 75,936.42
- Target 2: 77,260.70
- Target 3: 79,420.46
Chart Analysis:
1. Retracement Phase: The chart shows the Sensex Index in a retracement phase from a recent high, moving towards lower levels.
2. Support and Resistance Levels: The chart indicates potential support around the 0% retracement level at 73,801.25 and resistance levels at the key Fibonacci retracement levels.
3. Ascending Channel: The index appears to be trading within an ascending channel, indicating a general upward trend despite the current retracement.
Potential Scenarios:
1. Bullish Scenario:
- If the index finds support around the current level (73,801.25), it could start rebounding towards the upper targets.
- The first significant resistance to watch for is the 0.5 retracement level at 75,537.72, followed by the 0.618 retracement level at 75,947.52.
- Breaking above these levels could lead the index towards Target 1 (75,936.42), Target 2 (77,260.70), and eventually Target 3 (79,420.46).
2. Bearish Scenario:
- If the index fails to hold the support around 73,801.25, it might continue to fall towards the lower boundary of the ascending channel.
- Further decline could lead to testing the lower support level around 72,081.92.
Trading Strategy:
1. Watch for Support: Monitor the price action closely around the current level (73,801.25). Look for signs of a reversal or strong buying interest at this level.
2. Buy Position: Consider entering a long position if the index shows a strong bounce from the support level with increasing volume and bullish candlestick patterns.
3. Stop-Loss: Place a stop-loss slightly below the support level at 73,801.25 to manage risk in case of a further decline.
4. Target: Aim for the targets identified (75,936.42, 77,260.70, and 79,420.46) for the long position.
Conclusion:
- The S&P BSE Sensex Index is currently in a retracement phase within an overall ascending trend. The key support level to watch is around 73,801.25. If the index finds support and rebounds, it could move towards the identified targets. Conversely, a break below the support level could lead to further downside. Monitoring the price action and volume around these key levels will be crucial for making informed trading decisions.
Sensex Intraday Setup for Friday 15 March,2024I have posted two charts: the First is to understand the Intraday, and the second is my short-term view. Today is the weekly closing and the day that decides the market trend for next week. 72,500 is the last hope for the Bulls and a very critical zone, so keep an eye on these levels. They can help you play for the maximum today or in the upcoming days.
Intraday Range: 72,900 to 73,400 ( A more comprehensive range and good for the Options sellers who love to sell Options
Long above 73,400 for the target of 73,700/73,900
Short Below: 72,900 for the target to 72,600/72,500
Trade Accordingly
