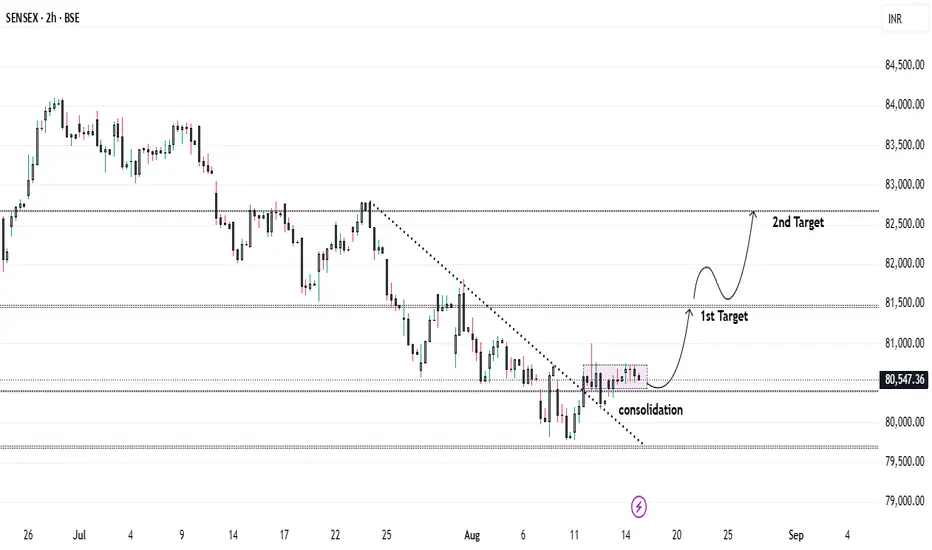
Can SENSEX Hit 82,600? Breakout + GST Reforms Explained.The SENSEX has successfully broken its downtrend and is now consolidating after a healthy retest, indicating strength and stability at current levels.
Key Macro Triggers
📊 Inflation Cooling:
* July CPI fell sharply to1.55%, the lowest since June 2017😮
* Food Inflation came in at -1.76%, down from -1.06% in June, signaling strong disinflationary trends.
This cooling inflation provides the RBI more room for policy support, boosting overall market sentiment.
⚖️ Policy Catalyst – GST Reforms by Diwali 2025:
In his Independence Day speech, PM Modi highlighted “Next-Gen GST Reforms,” which could act as a major structural trigger for the markets:
* 12% GST slab ➝ May shift to 5% 💡
* 28% GST slab ➝ May shift to 18% 📉
* New 40% slab** for sin goods (tobacco, beer, etc.)
These reforms, if implemented, would lower tax burdens, increase consumption, and improve corporate profitability**, setting the stage for a sustained equity rally.
Trade Setup – SENSEX
With strong macro tailwinds and technical breakout confirmation, we can look for long trades in the index:
* Entry: Current consolidation zone
* Stop Loss: Below recent retest level
* Target 1: 81,500
* Target 2: 82,600
⚠️ Risk Note:
While domestic triggers look favorable, Trump’s additional tariff policies could weigh on global risk sentiment and temporarily hinder momentum in Indian equities.
Sensexprediction
Sensex Intraday Analysis on May 12, 2025A bearish intraday trend is likely on May 12, 2025. The Sensex may find support at 79,067 (Support 1) and 78,250 (Support 2).
However, gap openings in either direction could invalidate this analysis. Traders are advised to rely on technical indicators before taking positions. Effective risk management remains essential.

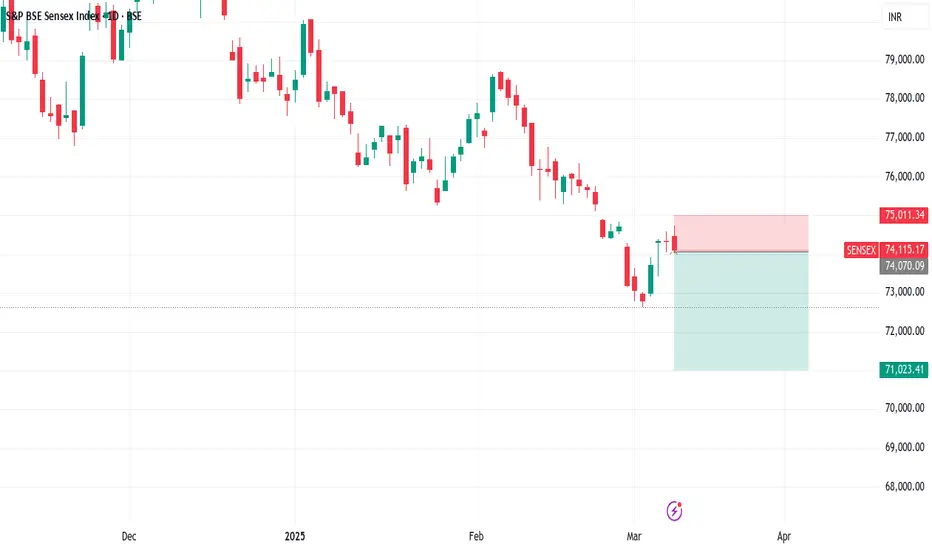
Sensex New LowAs per my anlaysis Sensex now low somewhere 71,000 ,its take maybe time but as per my view coming soon on day time frem ,its going to touch new low for this year 2025 , then after going upside .
Sensex Expiry Analysis – 7th January 2025
Sensex Expiry Analysis – 7th January 2025
Market Sentiment:
Overall Bias: Slightly bearish with range-bound possibilities unless a breakout/breakdown occurs.
Key Levels:
Resistance Levels: 78,000 (Immediate), 78,400 (Major).
Support Levels: 77,400 (Immediate), 77,200 (Critical).
Rationale for the Trade Setups:
Intraday Sell Setup:
A breakdown below 77,400 will trigger selling pressure, with targets at 77,200 and 77,000 due to high put writing and liquidity below.
Confidence Level: High, supported by FII/DII bearish positions and price action.
Intraday Buy Setup:
A breakout above 78,000 may trigger a gamma squeeze, with rapid movement toward 78,400 and 78,500 due to unwinding of call positions.
Confidence Level: Moderate, requires confirmation with volume.
Key Observations:
Option Chain Analysis:
Strong call writing at 78,000, making it a crucial resistance.
Heavy put writing at 77,400, indicating immediate support.
Implied Volatility (IV):
Slight increase (+2%), indicating expectations of higher volatility.
Gamma Squeeze Potential:
Above 78,000: Possible sharp upside move to 78,500.
Below 77,200: Potential downside acceleration to 77,000.
Execution Plan:
Buy Above 78,000: Wait for a 15-minute candle close above 78,000 with volume confirmation.
Sell Below 77,400: Enter on a clear breakdown below 77,400 with strong momentum.
Additional Notes:
Maintain tight stop-losses due to expiry-day volatility.
FIIs are net bearish in index futures; this reinforces the downside bias.
Range-bound expiry is possible if the index remains between 77,400-78,000.
Disclaimer:
The information provided is for educational and informational purposes only and should not be construed as financial or trading advice.Please consult with a certified financial advisor and use your discretion before making any trading decisions.

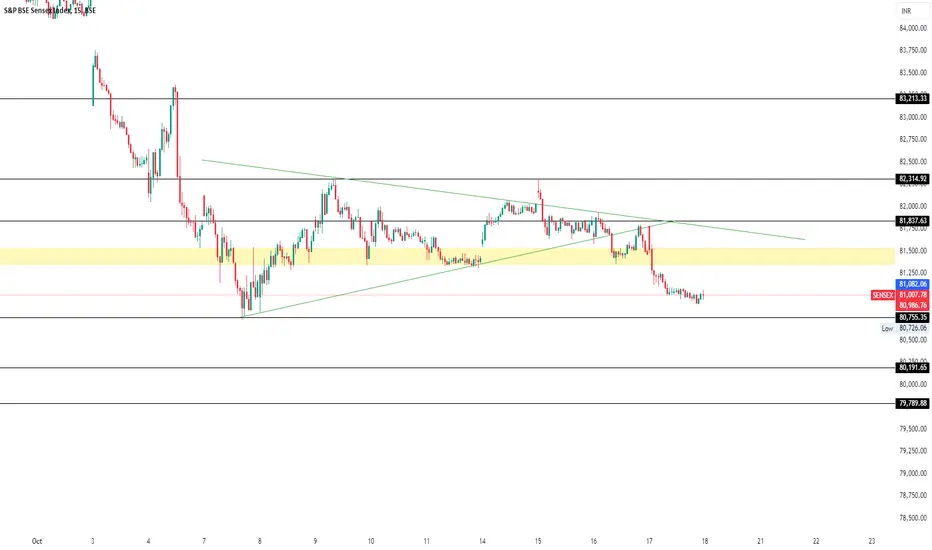
Sensex Analysis for Tomorrow 18/10/24Sensex Analysis for Tomorrow 18/10/24
Pls Use Brokers chart for live price updation in Sensex
Yellow Zone is major Resistance Level.
All The important are given with horizontal black line.
Sensex (SENSEX) AnalysisFollow and Boost the post, Thanks.
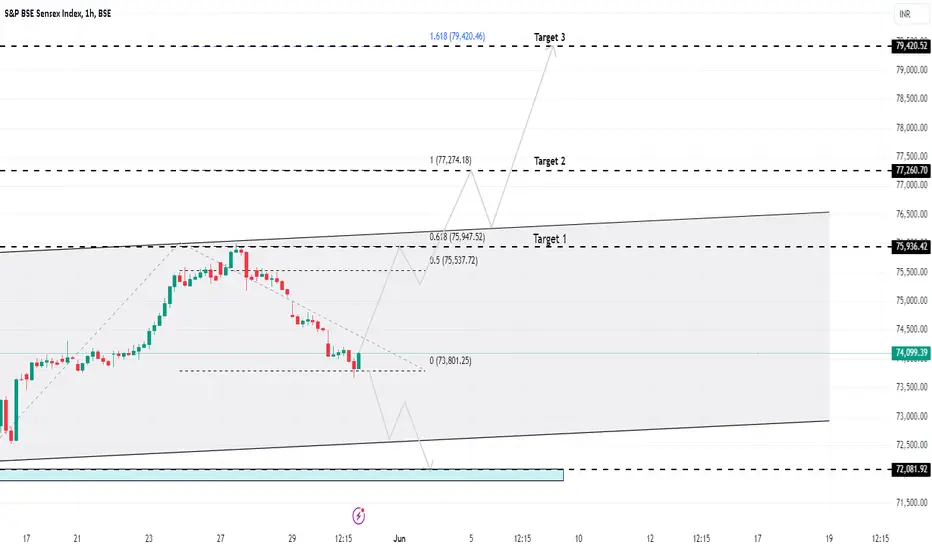
Based on the 1-hour chart for the S&P BSE Sensex Index, here is the summary and analysis:
Key Levels:
- Current Price: 73,885.60
- Retracement Levels:
- 0.5 Retracement: 75,537.72
- 0.618 Retracement: 75,947.52
- Targets:
- Target 1: 75,936.42
- Target 2: 77,260.70
- Target 3: 79,420.46
Chart Analysis:
1. Retracement Phase: The chart shows the Sensex Index in a retracement phase from a recent high, moving towards lower levels.
2. Support and Resistance Levels: The chart indicates potential support around the 0% retracement level at 73,801.25 and resistance levels at the key Fibonacci retracement levels.
3. Ascending Channel: The index appears to be trading within an ascending channel, indicating a general upward trend despite the current retracement.
Potential Scenarios:
1. Bullish Scenario:
- If the index finds support around the current level (73,801.25), it could start rebounding towards the upper targets.
- The first significant resistance to watch for is the 0.5 retracement level at 75,537.72, followed by the 0.618 retracement level at 75,947.52.
- Breaking above these levels could lead the index towards Target 1 (75,936.42), Target 2 (77,260.70), and eventually Target 3 (79,420.46).
2. Bearish Scenario:
- If the index fails to hold the support around 73,801.25, it might continue to fall towards the lower boundary of the ascending channel.
- Further decline could lead to testing the lower support level around 72,081.92.
Trading Strategy:
1. Watch for Support: Monitor the price action closely around the current level (73,801.25). Look for signs of a reversal or strong buying interest at this level.
2. Buy Position: Consider entering a long position if the index shows a strong bounce from the support level with increasing volume and bullish candlestick patterns.
3. Stop-Loss: Place a stop-loss slightly below the support level at 73,801.25 to manage risk in case of a further decline.
4. Target: Aim for the targets identified (75,936.42, 77,260.70, and 79,420.46) for the long position.
Conclusion:
- The S&P BSE Sensex Index is currently in a retracement phase within an overall ascending trend. The key support level to watch is around 73,801.25. If the index finds support and rebounds, it could move towards the identified targets. Conversely, a break below the support level could lead to further downside. Monitoring the price action and volume around these key levels will be crucial for making informed trading decisions.
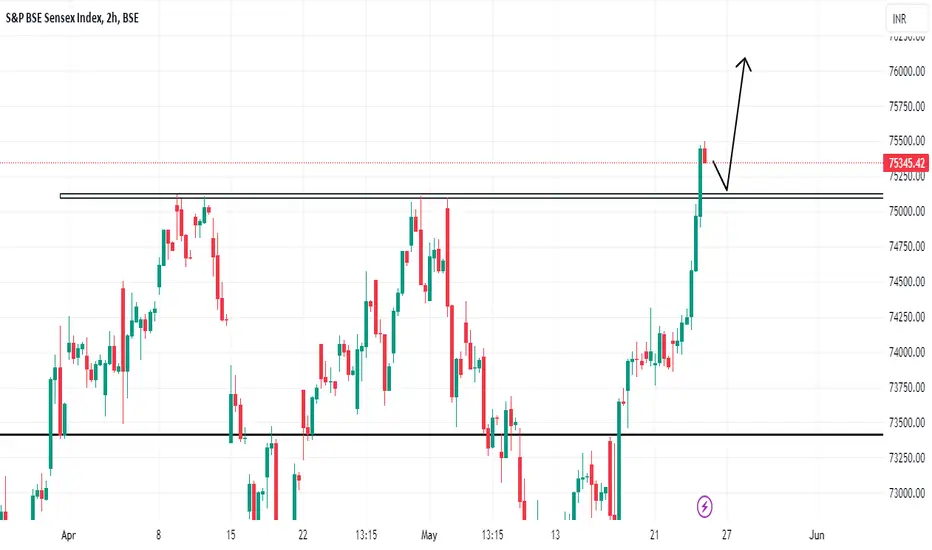
SENSEXThe SENSEX has decisively surpassed a key resistance level, signaling a potential upward trend.