NZDUSD to find buyers at previous resistance?NZDUSD - 24h expiry
Indecisive price action has resulted in sideways congestion on the intraday chart.
Momentum is flat, highlighting the lack of clear direction.
Risk/Reward would be poor to call a buy from current levels.
A move through 0.6225 will confirm the bullish momentum.
The measured move target is 0.6280.
We look to Buy at 0.6200 (stop at 0.6176)
Our profit targets will be 0.6260 and 0.6270
Resistance: 0.6250 / 0.6275 / 0.6280
Support: 0.6200 / 0.6175 / 0.6150
Risk Disclaimer
The trade ideas beyond this page are for informational purposes only and do not constitute investment advice or a solicitation to trade. This information is provided by Signal Centre, a third-party unaffiliated with OANDA, and is intended for general circulation only. OANDA does not guarantee the accuracy of this information and assumes no responsibilities for the information provided by the third party. The information does not take into account the specific investment objectives, financial situation, or particular needs of any particular person. You should take into account your specific investment objectives, financial situation, and particular needs before making a commitment to trade, including seeking advice from an independent financial adviser regarding the suitability of the investment, under a separate engagement, as you deem fit.
You accept that you assume all risks in independently viewing the contents and selecting a chosen strategy.
Where the research is distributed in Singapore to a person who is not an Accredited Investor, Expert Investor or an Institutional Investor, Oanda Asia Pacific Pte Ltd (“OAP“) accepts legal responsibility for the contents of the report to such persons only to the extent required by law. Singapore customers should contact OAP at 6579 8289 for matters arising from, or in connection with, the information/research distributed.
Setup

DAX to breakdown at overbought extremes?GER40 - 24h expiry
Although the bulls are in control, the stalling positive momentum indicates a turnaround is possible.
Current prices have reacted from a low of 16662, however, we expect further losses to follow.
Price action resulted in a new all-time high at 17004.
An Evening Doji Star formation has been posted at the high.
A break of the recent low at 16662 should result in a further move lower.
Daily signals for sentiment are at overbought extremes.
We look to Sell a break of 16658 (stop at 16758)
Our profit targets will be 16418 and 16348
Resistance: 16793 / 16850 / 16950
Support: 16720 / 16662 / 16600
Risk Disclaimer
The trade ideas beyond this page are for informational purposes only and do not constitute investment advice or a solicitation to trade. This information is provided by Signal Centre, a third-party unaffiliated with OANDA, and is intended for general circulation only. OANDA does not guarantee the accuracy of this information and assumes no responsibilities for the information provided by the third party. The information does not take into account the specific investment objectives, financial situation, or particular needs of any particular person. You should take into account your specific investment objectives, financial situation, and particular needs before making a commitment to trade, including seeking advice from an independent financial adviser regarding the suitability of the investment, under a separate engagement, as you deem fit.
You accept that you assume all risks in independently viewing the contents and selecting a chosen strategy.
Where the research is distributed in Singapore to a person who is not an Accredited Investor, Expert Investor or an Institutional Investor, Oanda Asia Pacific Pte Ltd (“OAP“) accepts legal responsibility for the contents of the report to such persons only to the extent required by law. Singapore customers should contact OAP at 6579 8289 for matters arising from, or in connection with, the information/research distributed.

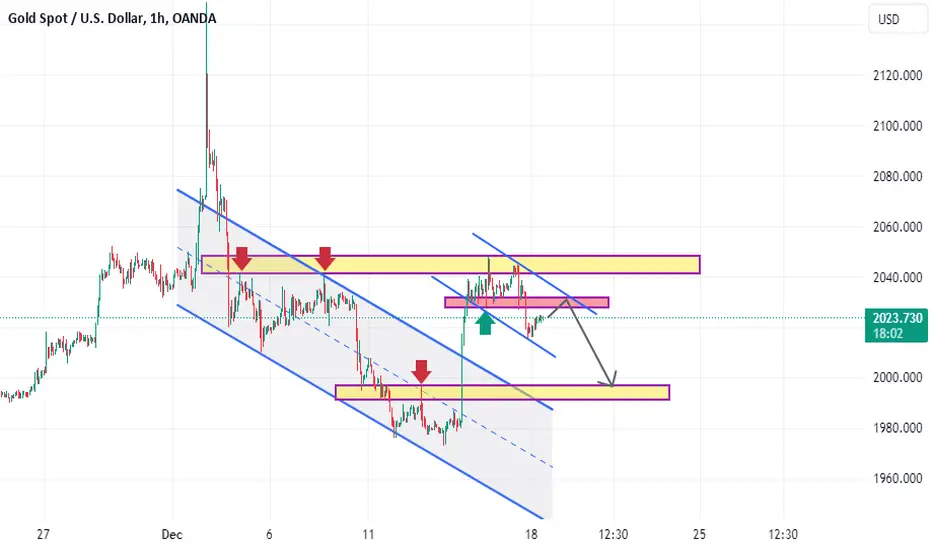
XAUUSD : Short Trade , 1hHello traders, we want to check the XAUUSD chart. After the price has broken the descending channel to the top, it has reached the specified resistance level and could not break this level and had a fall. We expect the price to continue its downward trend after the pullback until around the price of 2030 and fall to around the price of 1997. Good luck.
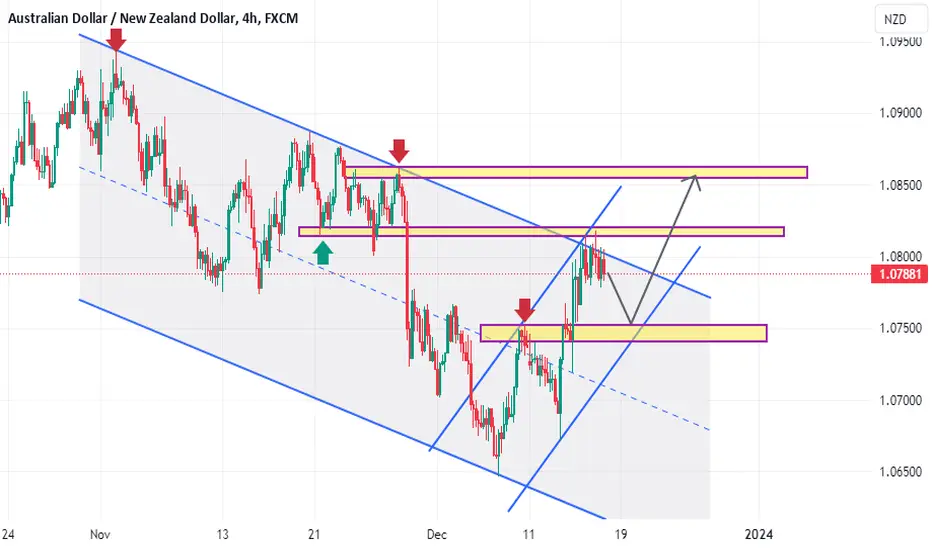
AUDNZD : Long Trade , 4hHello traders, we want to check the AUDNZD chart. The overall trend of the market is bearish and the price has reached the ceiling of the descending channel as well as the indicated key level. We expect the price to have a correction up to around 1.07500 and if the price fails to break this level, the price will maintain its upward trend and grow up to around 1.08600. Good luck.
EURCHF : Long Trade , 4hHello traders, we want to check the EURCHF chart. After reaching the specified support level, the price has started an upward trend. We expect the price to maintain its upward trend and the price will grow to around 0.95400. good luck.

USDCAD : Long Trade , 4hHello traders, we want to check the USDCAD chart. The price is moving in a descending channel and has reached a key level that the price has reacted to several times in the past. We expect this level to play the role of a support level and the price will grow to around 1.34900. Good luck.

AUDUSD : Short Trade , 4hHello traders, we want to check the AUDUSD chart. The price is moving in an ascending channel and has reached the indicated key level. We expect this level to act as a resistance level and the price will fall to around 0.66200. If the price cannot break this support level, we expect it to maintain its upward trend and the price will test the specified resistance level again. Good luck.

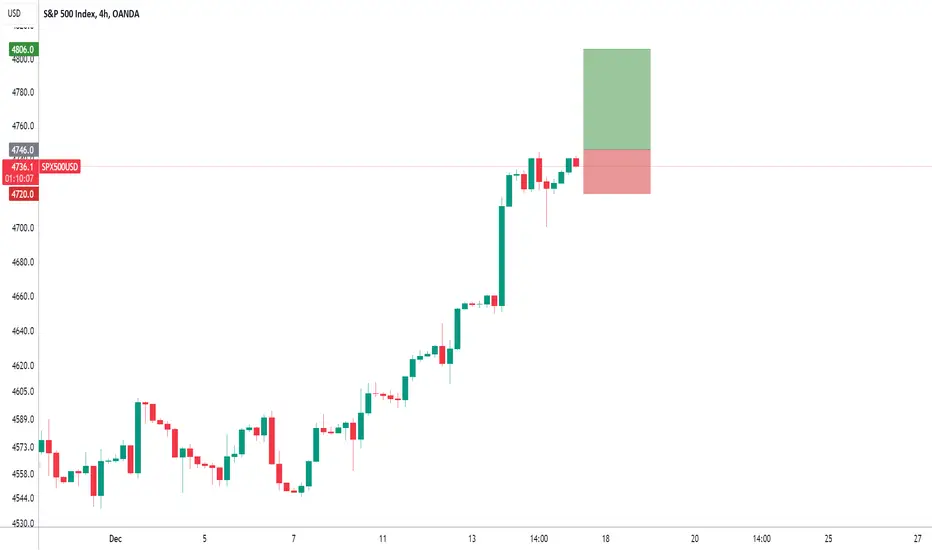
SPX500 to retest all time high?US500 - Intraday
Price action continues to trade around the all-time highs.
There is no indication that the rally is coming to an end.
A break of the recent high at 4744 should result in a further move higher.
Short-term momentum is bullish.
We look for gains to be extended today.
We look to Buy a break of 4746 (stop at 4720)
Our profit targets will be 4806 and 4826
Resistance: 4744 / 4770 / 4820
Support: 4720 / 4693 / 4650
Risk Disclaimer
The trade ideas beyond this page are for informational purposes only and do not constitute investment advice or a solicitation to trade. This information is provided by Signal Centre, a third-party unaffiliated with OANDA, and is intended for general circulation only. OANDA does not guarantee the accuracy of this information and assumes no responsibilities for the information provided by the third party. The information does not take into account the specific investment objectives, financial situation, or particular needs of any particular person. You should take into account your specific investment objectives, financial situation, and particular needs before making a commitment to trade, including seeking advice from an independent financial adviser regarding the suitability of the investment, under a separate engagement, as you deem fit.
You accept that you assume all risks in independently viewing the contents and selecting a chosen strategy.
Where the research is distributed in Singapore to a person who is not an Accredited Investor, Expert Investor or an Institutional Investor, Oanda Asia Pacific Pte Ltd (“OAP“) accepts legal responsibility for the contents of the report to such persons only to the extent required by law. Singapore customers should contact OAP at 6579 8289 for matters arising from, or in connection with, the information/research distributed.
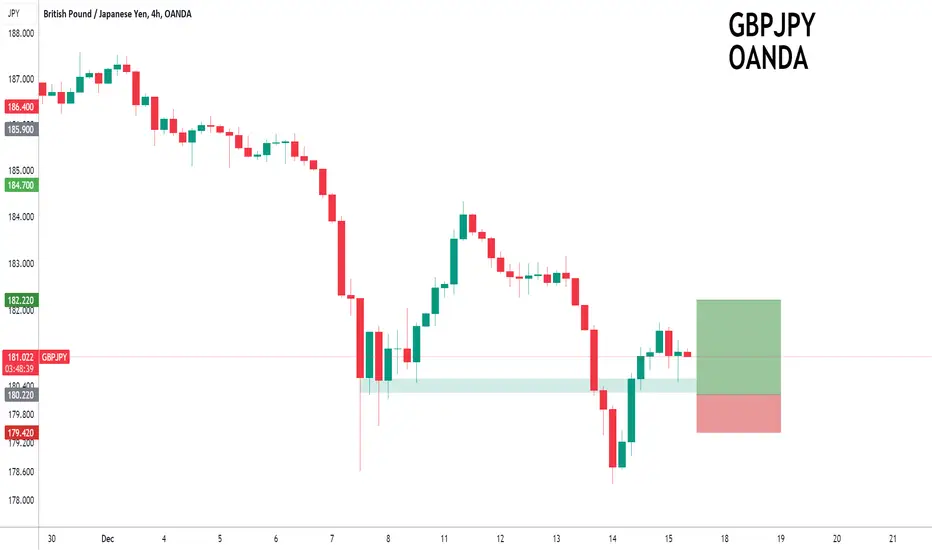
GBPJPY to turnaround?GBPJPY - Intraday
Posted a Bullish Hammer Bottom on the Daily chart.
This is positive for short term sentiment and we look to set longs at good risk/reward levels for a further correction higher.
Preferred trade is to buy on dips.
Although the anticipated move higher is corrective, it does offer ample risk/reward today.
Further upside is expected although we prefer to buy into dips close to the 180.22 level.
We look to Buy at 180.22 (stop at 179.42)
Our profit targets will be 182.22 and 182.62
Resistance: 182.10 / 183.35 / 184.60
Support: 180.30 / 178.00 / 175.15
Risk Disclaimer
The trade ideas beyond this page are for informational purposes only and do not constitute investment advice or a solicitation to trade. This information is provided by Signal Centre, a third-party unaffiliated with OANDA, and is intended for general circulation only. OANDA does not guarantee the accuracy of this information and assumes no responsibilities for the information provided by the third party. The information does not take into account the specific investment objectives, financial situation, or particular needs of any particular person. You should take into account your specific investment objectives, financial situation, and particular needs before making a commitment to trade, including seeking advice from an independent financial adviser regarding the suitability of the investment, under a separate engagement, as you deem fit.
You accept that you assume all risks in independently viewing the contents and selecting a chosen strategy.
Where the research is distributed in Singapore to a person who is not an Accredited Investor, Expert Investor or an Institutional Investor, Oanda Asia Pacific Pte Ltd (“OAP“) accepts legal responsibility for the contents of the report to such persons only to the extent required by law. Singapore customers should contact OAP at 6579 8289 for matters arising from, or in connection with, the information/research distributed.
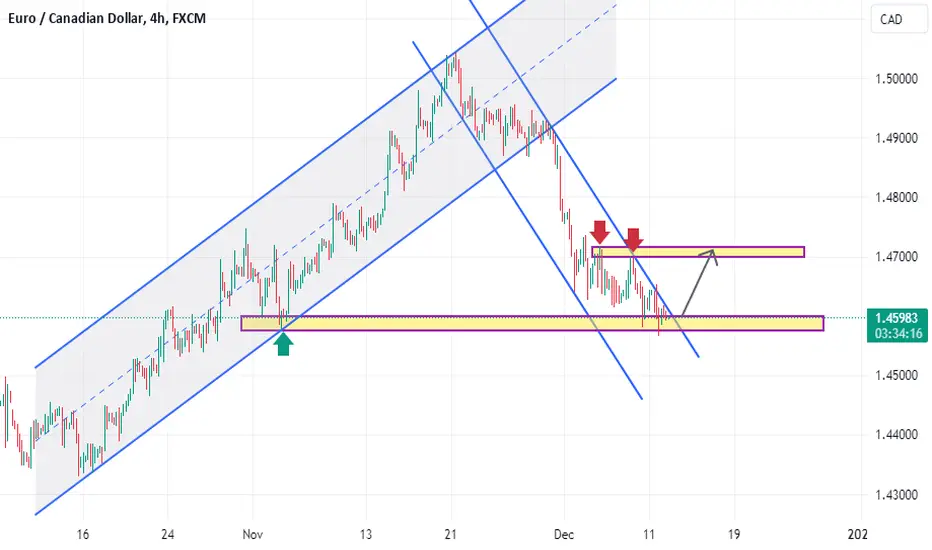
EURCAD : Long Trade , 4hHello traders, we want to check the EURCAD chart. The price has broken the ascending channel and is currently moving in a descending channel. The price has reached the indicated key level and we expect this level to stop the downward trend of the price. If the price cannot break this level downwards and break the descending channel upwards, our first target will be the price of 1.47000. Good luck.
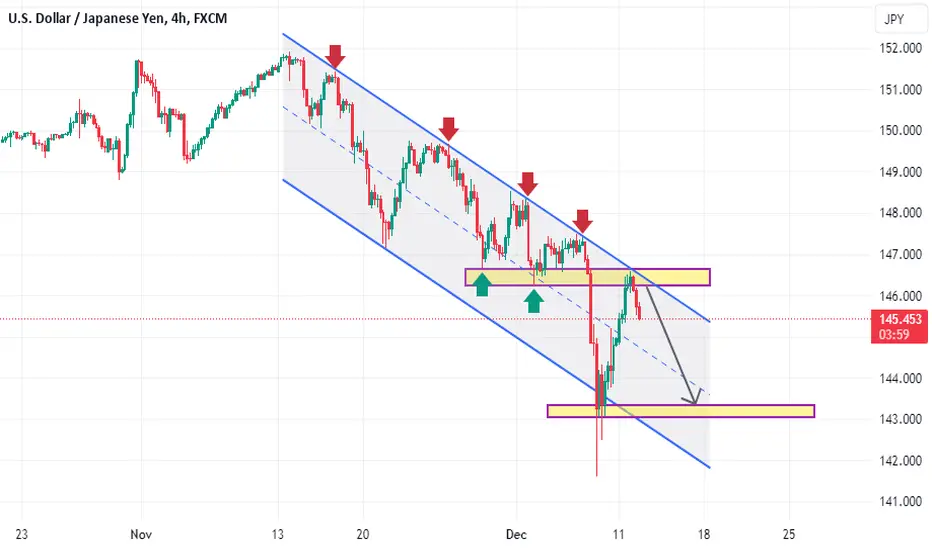
USDJPY : Short Trade , 4hHello traders, we want to check the USDJPY chart. The price is moving in a descending channel and has pulled back to the indicated key level. We expect this level to play the role of a resistance level and maintain the downward trend of the price and the price will fall to around 143.300. Good luck.
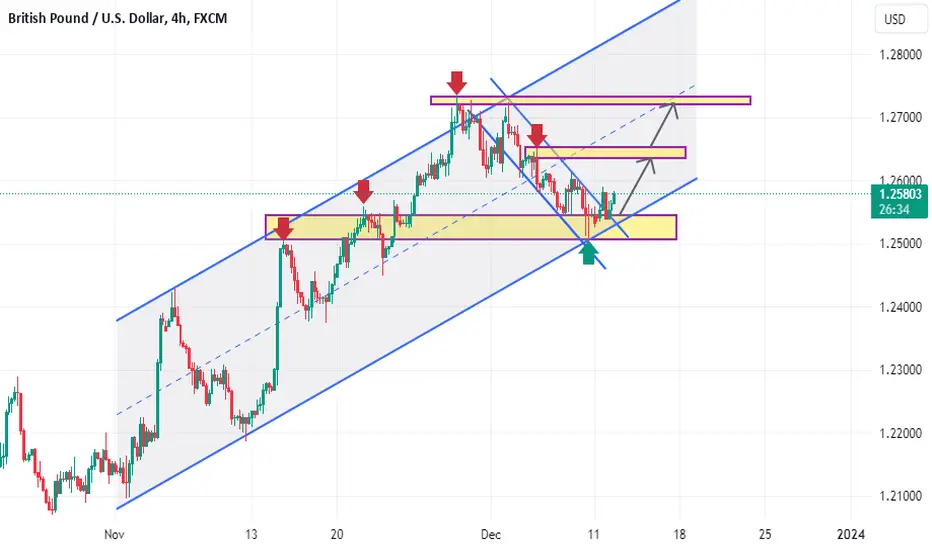
GBPUSD : Long Trade , 4hHello traders, we want to check the GBPUSD chart. The price is moving in an ascending channel and has pulled back to the indicated key level and has also broken the small descending channel to the upside. We expect the price to grow up to around 1.26400 and if it can break this level, the next price target will be 1.27300. Good luck.
USDCAD : Short Trade , 4hHello traders, we want to check the USDCAD chart. The price is moving in a descending channel and has pulled back to a key level that the price has reacted to several times in the past. We expect this level to play the role of a support level and maintain the downward trend of the price. We expect the price to fall to around 1.34900. Good luck.

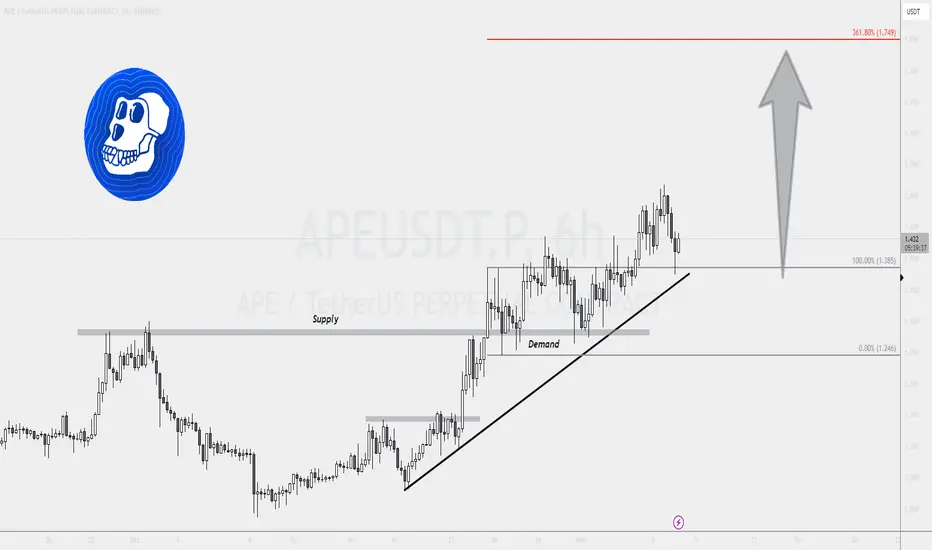
Don't Miss Out on APEUSDT's Upcoming Gains!APEUSDT: Unveiling the Next Profit Potential
🔅APEUSDT is poised to become the next major winner, as per our meticulous analysis. While we can't divulge all the details just yet, it presents an ideal buying opportunity on the technical front.
🔅Firstly, an intriguing transformation unfolds as the supply zone seamlessly transitions into a demand area, resulting in the creation of a new higher high. The ongoing pullback journey now finds APE brushing against a crucial uptrend trendline, thus unfurling a compelling buying opportunity coupled with a favorable risk-to-reward ratio.
🔅Rest assured, we've already posted the entire trade setup in our dedicated channel and will provide timely updates as the market dictates. As it stands, our sentiment remains overwhelmingly bullish on APEUSDT.
Charting UNFIUSDT Course for 80% Potential Gain!🔅 UNFI Overview:
UNFIUSDT exhibits a robust bullish trend, supported by several compelling factors.
🔅Higher Highs and Higher Lows:
A consistent pattern validating the long-term uptrend.
🔅 Critical Supply Zone Breakout:
In September 2023, a decisive break above the vital supply zone at $7.5 occurred.
🔅Wedge Pattern Formation:
Following the breakout, UNFI experienced an extended correction forming a wedge pattern.
🔅Wedge Breakout and Retest:
Heavy buying pressure led to a breakout from the wedge, followed by a re-test of the $7.5 zone (now a demand zone).
🔅Clean Bounce Off 61.8% Fibonacci Support:
The most recent price action shows a significant bounce off the 61.8% Fibonacci support, enhancing the likelihood of an uptrend continuation.
🔅 Trade Setup:
Given these factors, we've shared a buy signal in our channel. Anticipating a potential 80% rally, the stage is set for an exciting opportunity. Are you prepared to seize it?

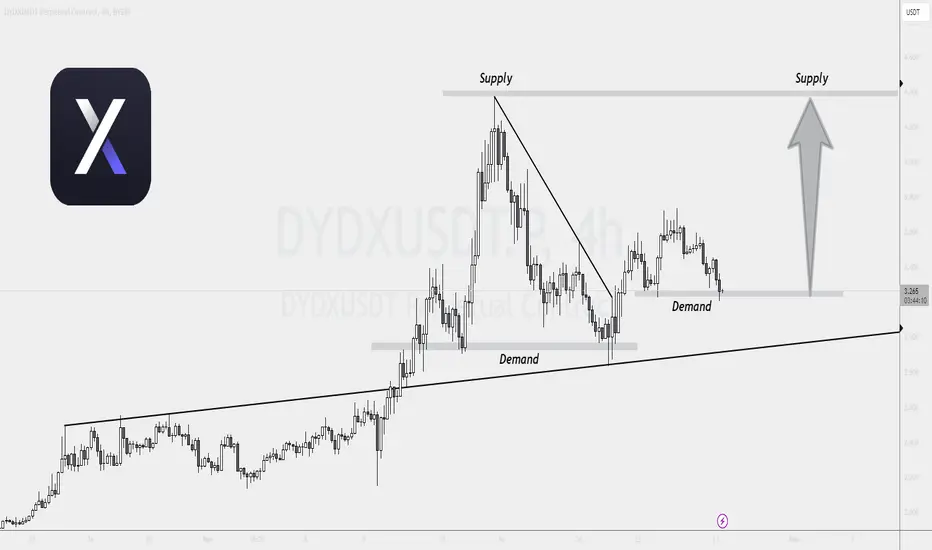
DYDXUSDT Demand Formation and Potential UpsideDYDXUSDT exhibited a significant breakthrough, breaching the resistance trendline, which subsequently transitioned into a support trendline. Concurrently, a notable formation of a demand zone near the psychologically critical level of $3.00 became apparent. Following a bounce off the support trendline, DYDXUSDT managed to surpass the downtrend trendline, potentially forming a double bottom during the current pullback phase.
This specific price action indicates a potential focal point for buyers, particularly as the price respects this demand area. Maintaining this level of support leads us to anticipate a retest of the $4.4 supply zone.
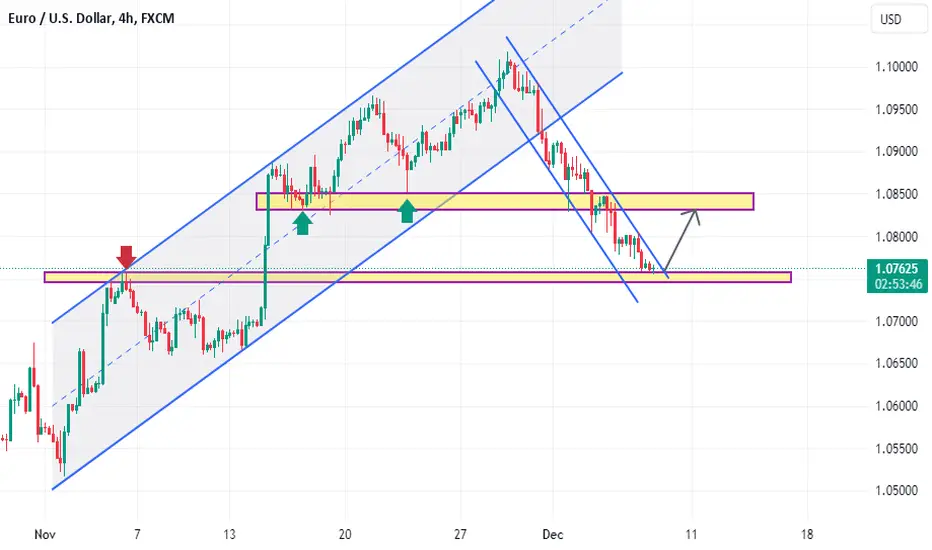
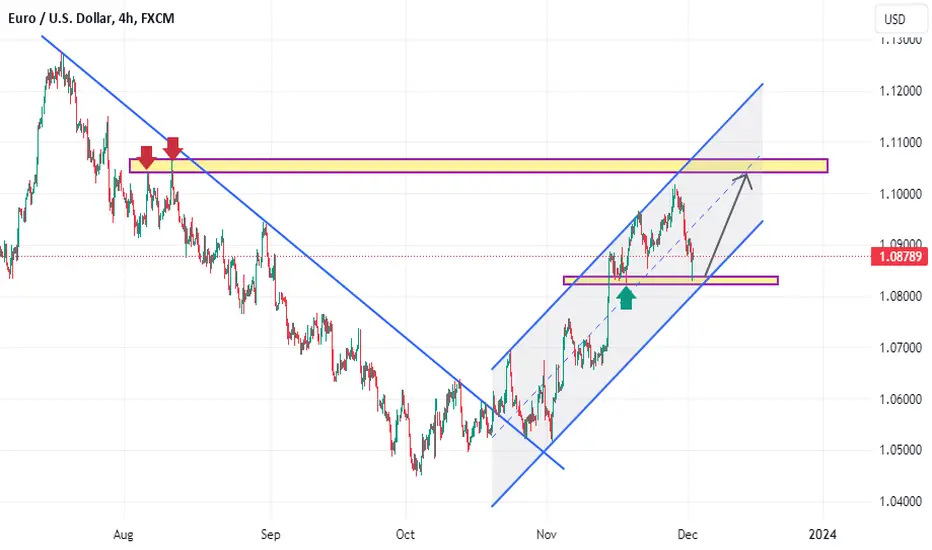
EURUSD : Long Trade , 4hHello traders, we want to check the EURUSD chart. The price has broken the ascending channel and is currently moving in a descending channel. The price has reached the specified key level and if it cannot break this level and this level plays the role of a support level, we expect the price to grow up to around 1.08400. Good luck.
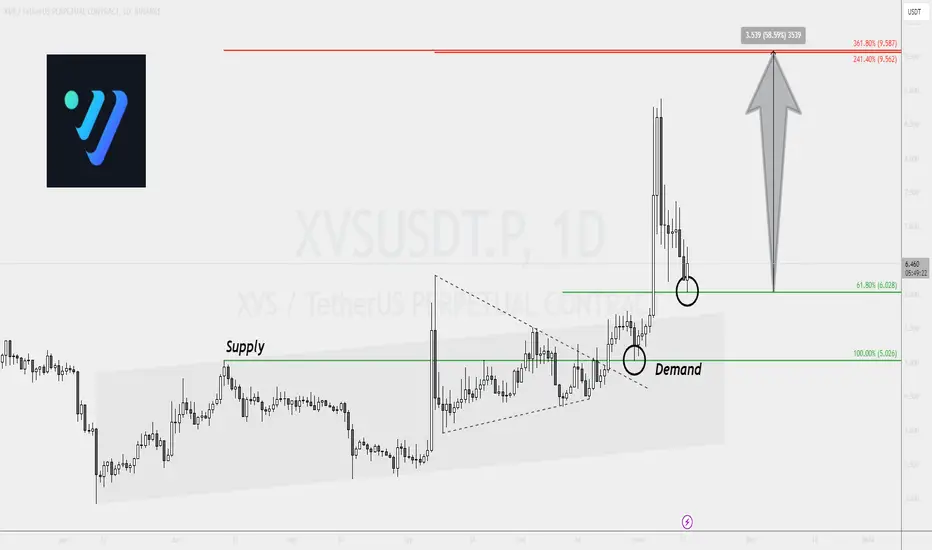
XVSUSDT 60% Surge Anticipation🔅XVSUSDT exhibits strong uptrend signals. In November, a breakout from the triangle pattern, coupled with a rebound from the demand area, marked the initial phases of an uptrend. Subsequently, a robust breakout above the ascending channel showcased sustained buying pressure.
🔅Despite a significant pullback, XVS found support at the 61.8% Fibonacci retracement level, potentially indicating the conclusion of the correctional phase. The continuation of an uptrend is likely if the current support holds, aiming for a new higher high.
🔅The key resistance at the $10 psychological level, confirmed by a double Fibonacci level, is the next target. A successful reach would translate to a 60% price surge for XVSUSDT. Investors should monitor the support level for trend confirmation and potential entry points.
EURUSD : Long Trade , 4hHello traders, we want to check the EURUSD chart. The price is moving in an ascending channel and has pulled back to the indicated key level. If the price cannot break this level and stabilize above this level, we expect the upward trend to be maintained and the price to grow to around 1.10500. Good luck.
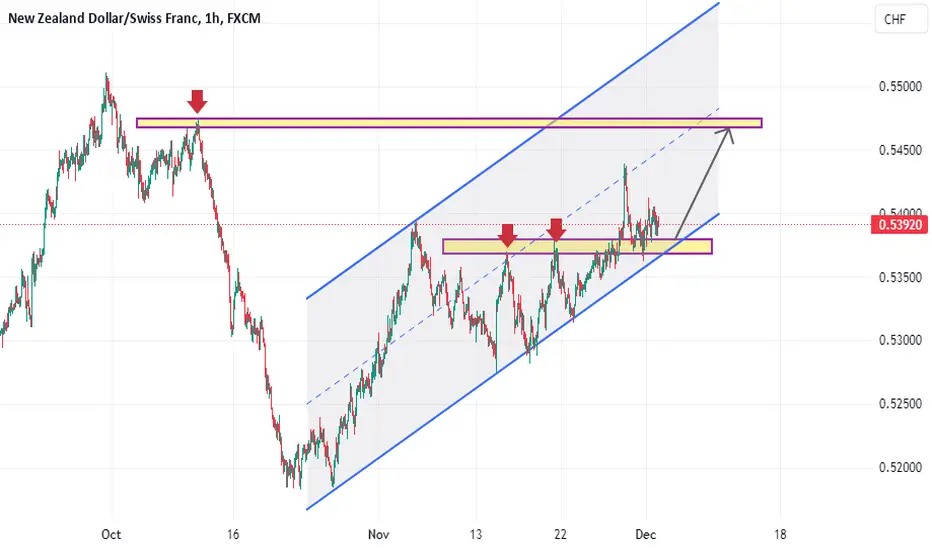
NZDCHF : Long Trade , 1hHello traders, we want to check the NZDCHF chart. The price is moving in an ascending channel and has pulled back to the indicated key level. We expect this level to play the role of a support level and maintain the upward trend of the price and the price will grow to around 0.54700. Good luck.
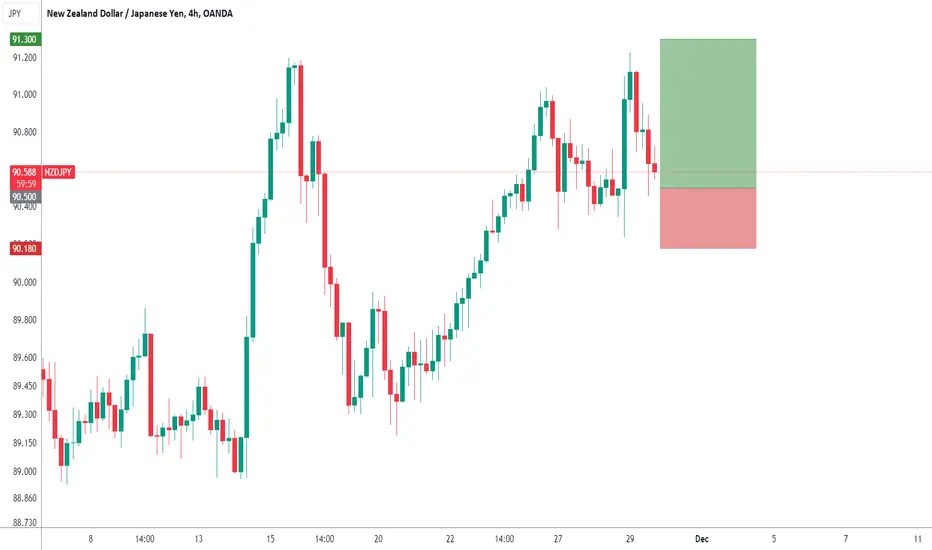
NZDJPY to continue in the upward move?NZDJPY - 24h expiry
There is no clear indication that the upward move is coming to an end.
A lower correction is expected.
Risk/Reward would be poor to call a buy from current levels.
A move through 90.75 will confirm the bullish momentum.
The measured move target is 91.50.
We look to Buy at 90.50 (stop at 90.18)
Our profit targets will be 91.30 and 91.50
Resistance: 91.00 / 91.40 / 91.50
Support: 90.50 / 90.25 / 90.00
Risk Disclaimer
The trade ideas beyond this page are for informational purposes only and do not constitute investment advice or a solicitation to trade. This information is provided by Signal Centre, a third-party unaffiliated with OANDA, and is intended for general circulation only. OANDA does not guarantee the accuracy of this information and assumes no responsibilities for the information provided by the third party. The information does not take into account the specific investment objectives, financial situation, or particular needs of any particular person. You should take into account your specific investment objectives, financial situation, and particular needs before making a commitment to trade, including seeking advice from an independent financial adviser regarding the suitability of the investment, under a separate engagement, as you deem fit.
You accept that you assume all risks in independently viewing the contents and selecting a chosen strategy.
Where the research is distributed in Singapore to a person who is not an Accredited Investor, Expert Investor or an Institutional Investor, Oanda Asia Pacific Pte Ltd (“OAP“) accepts legal responsibility for the contents of the report to such persons only to the extent required by law. Singapore customers should contact OAP at 6579 8289 for matters arising from, or in connection with, the information/research distributed.
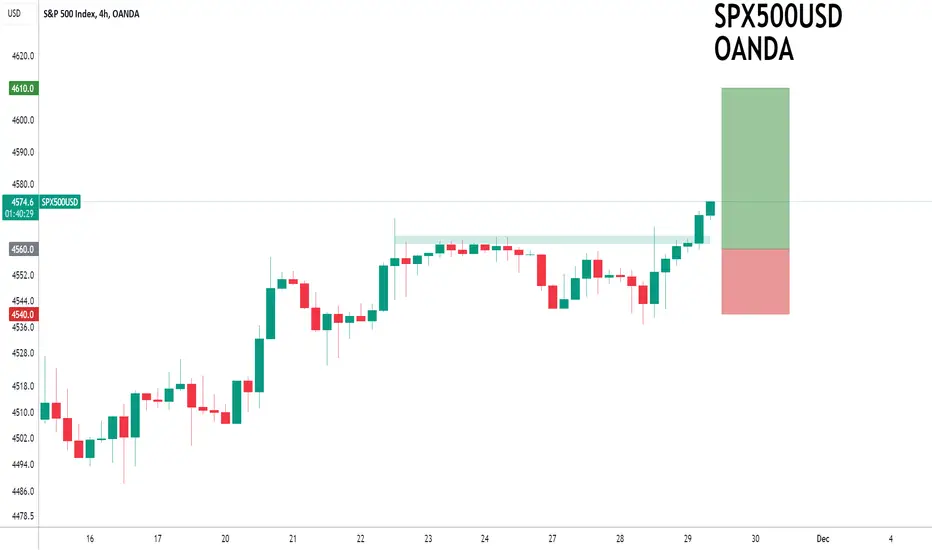
SPX500 to find support at previous resistance?US500 - 24h expiry
The rally was sold and the dip bought resulting in mild net gains yesterday.
An overnight positive theme in Equities has led to a higher open this morning.
Previous resistance located at 4610.
Dips continue to attract buyers.
Previous resistance at 4560 now becomes support.
We look to Buy at 4560 (stop at 4540)
Our profit targets will be 4610 and 4625
Resistance: 4600 / 4610 / 4650
Support: 4560 / 4537 / 4504
Risk Disclaimer
The trade ideas beyond this page are for informational purposes only and do not constitute investment advice or a solicitation to trade. This information is provided by Signal Centre, a third-party unaffiliated with OANDA, and is intended for general circulation only. OANDA does not guarantee the accuracy of this information and assumes no responsibilities for the information provided by the third party. The information does not take into account the specific investment objectives, financial situation, or particular needs of any particular person. You should take into account your specific investment objectives, financial situation, and particular needs before making a commitment to trade, including seeking advice from an independent financial adviser regarding the suitability of the investment, under a separate engagement, as you deem fit.
You accept that you assume all risks in independently viewing the contents and selecting a chosen strategy.
Where the research is distributed in Singapore to a person who is not an Accredited Investor, Expert Investor or an Institutional Investor, Oanda Asia Pacific Pte Ltd (“OAP“) accepts legal responsibility for the contents of the report to such persons only to the extent required by law. Singapore customers should contact OAP at 6579 8289 for matters arising from, or in connection with, the information/research distributed.
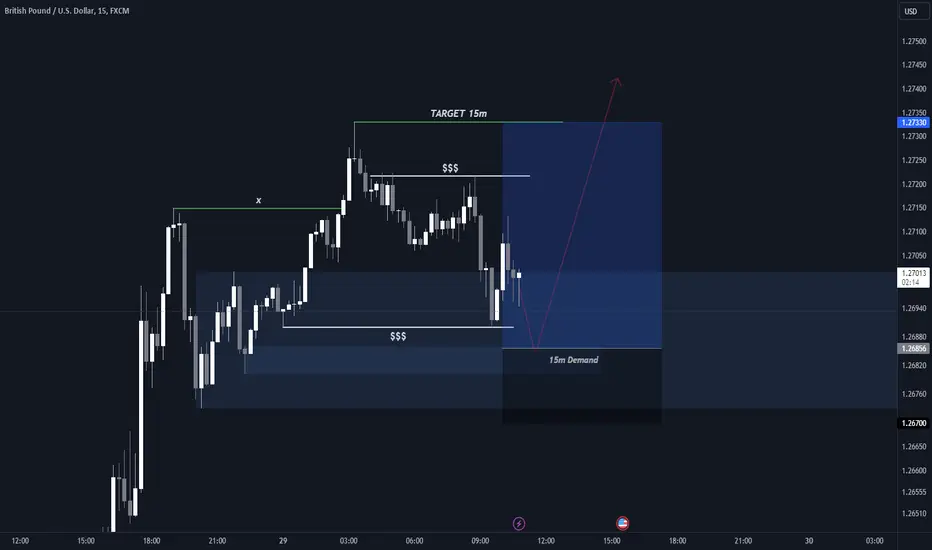
GBPUSD Simple 3RR SetupThis is a simple 3RR Long Setup on GU. We can see a bullish trend on the 15m chart and I am using liquidity that is build up around the 15m Demand Zone.
Use your own risk management.