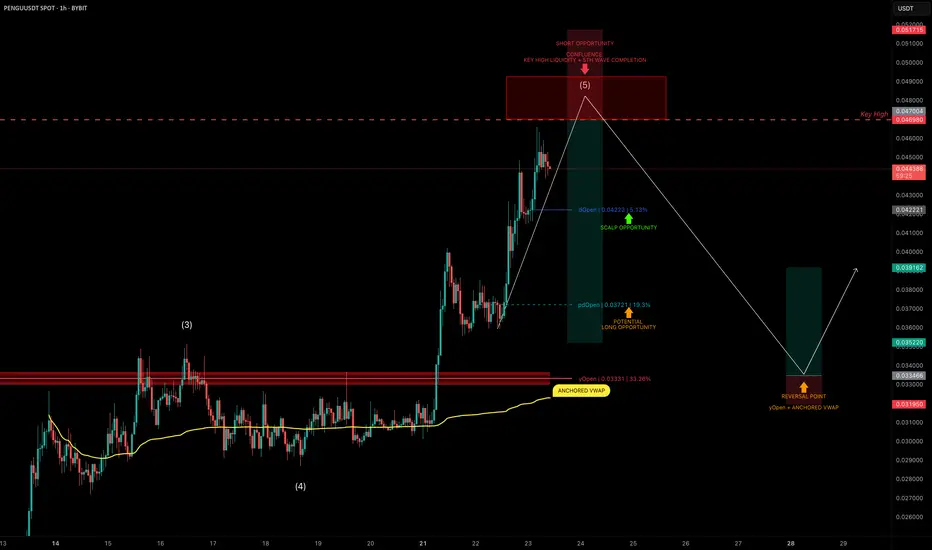
PENGU Topping Out? Targeting 30% Downside After Liquidity SweepPENGU has had an explosive run, but it now looks to be nearing completion of wave 5 of its current Elliott impulse.
We’re approaching a key high at $0.04698, a likely liquidity grab zone — and potentially a great area to position for a short trade.
🧩 Short Setup Overview
➡️ Wave 5 Completion Incoming:
Price is showing signs of exhaustion as it approaches $0.04698, where liquidity is likely stacked above the previous high.
➡️ SFP Trigger Zone:
Watch for a swing failure pattern (SFP) at $0.04698 — confirmation for a potential short entry.
➡️ Psychological Resistance:
The $0.05 level also sits just above — a classic psychological barrier that may get tapped or wicked into.
🔴 Short Trade Setup
Entry: After a confirmed SFP at $0.04698–$0.05
Target (TP): Yearly Open (yOpen) — potential move of ~30%
Stop-loss: Above post-SFP high
R:R: Excellent asymmetry if setup confirms
🛠 Indicator Note
In this analysis I'm using my own indicator called "DriftLine - Pivot Open Zones ", which I recently published.
✅ It helps highlight key open levels, support/resistance zones, and price structure shifts — all critical for confluence-based trade planning.
Feel free to check it out — you can use it for free by heading to my profile under the “Scripts” tab.
💡 Educational Insight: How to Trade Wave 5 Liquidity Sweeps
Wave 5 tops often trap late longs, especially when paired with psychological levels and key highs.
➡️ Patience is key — wait for a rejection pattern or SFP before entering.
➡️ Liquidity sweeps first — then the move.
Final Thoughts
PENGU is pushing toward $0.04698–$0.05, but this may be its final move up before correction.
With the yearly open as a logical target, and clear confluence via DriftLine, this setup offers a clean short opportunity — if confirmation comes.
Stay sharp, let price lead, and trade the reaction — not the prediction.
_________________________________
💬 If you found this helpful, drop a like and comment!
Want breakdowns of other charts? Leave your requests below.
Sfp
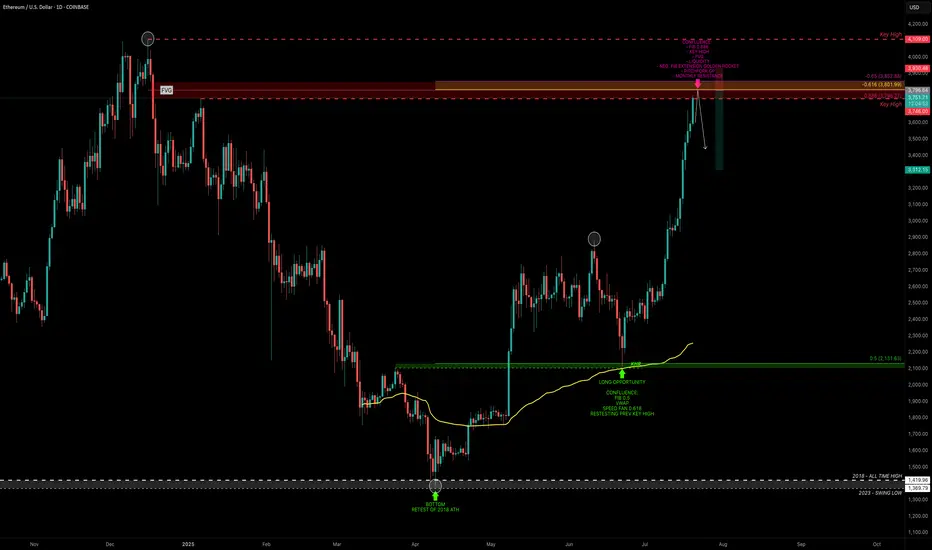
ETH — Rally Exhaustion or More Upside?ETH has been on an absolute tear. After retesting its old 2018 all-time high, it marked a bottom at $1383 — a brutal -66% correction over 114 days from the $4109 top.
From there, ETH ripped +100% in just one month, followed by 40 days of consolidation, and now, over the past 28 days, it’s surged another +76%, currently trading around $3715 — all without any major correction.
So the big question:
What’s next? Are we near a short setup, or is it time to long?
Let’s break it down.
🧩 Key Technicals
➡️ Bounce Zone:
On June 22, ETH retested the 0.5 fib ($2131.63) of the prior 5-wave Elliott impulse, with extra confluence from:
Anchored VWAP
Speed fan 0.618
➡️ Key Highs to Watch:
$3746 → recent local high
$4109 → 2021 all-time high
➡️ Fib Retracement Levels:
ETH has smashed through all major fibs, including the golden pocket (0.618–0.65) and 0.786 fib. The 0.886 fib at $3798.27 is the last major resistance, just above the $3746 key high.
At this zone, we also have:
Fair Value Gap (FVG)
Monthly Resistance
Negative Fib Extension Golden Pocket Target
➡️ Momentum Signal:
ETH is currently on its 8th consecutive bullish daily candle — historically, after 8–13 consecutive candles, price tends to cool off or correct. A sign to be cautious about longing here and consider profit-taking.
🔴 Short Trade Setup
Look for a potential SFP (swing failure pattern) at the key high $3746 to initiate a short trade.
This offers a low-risk setup with:
Entry: around $3746 (if SFP confirms)
Target (TP): ~$3300
Stop-loss: above SFP
R:R ≈ 1:4+
💡 Educational Insight: Why You Don’t Want to Long the Top
Markets often trap late longers near key highs or resistance zones — this is where smart money distributes while retail piles in emotionally.
Lesson: Look for zones of confluence (fib, VWAP, liquidity, FVG) and avoid chasing extended moves after multiple bullish candles.
Patience and confirmation at reversal points lead to higher-probability setups — you don’t need to catch every pump.
Final Thoughts
We’re approaching major highs, so this is a time for caution, not FOMO. Watch for reaction and potential reversals near $3750–$3850.
Stay sharp, manage risk — and remember, tops are where longs get trapped.
_________________________________
💬 If you found this helpful, drop a like and comment!
Want breakdowns of other charts? Leave your requests below.
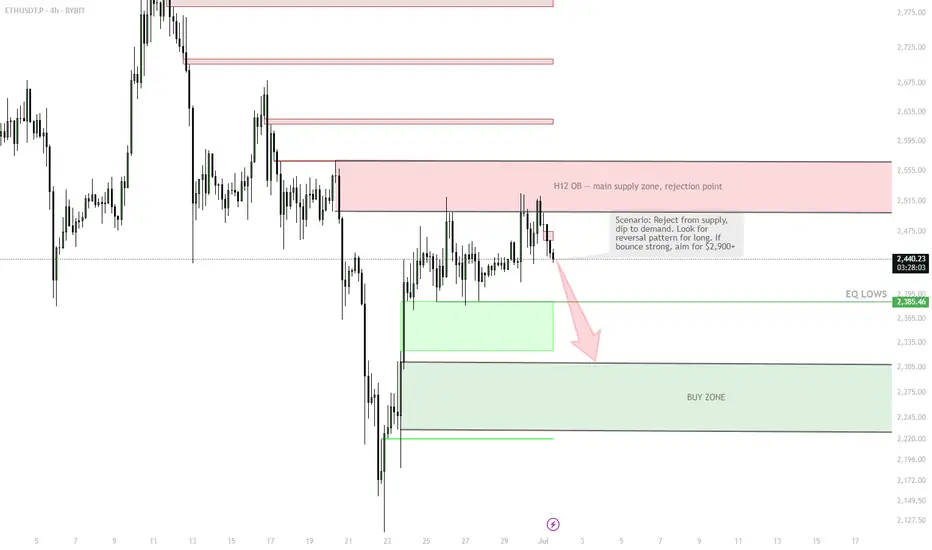
ETH | H12 Supply Rejection & Demand Bounce PlanSELL ZONE $2,520–2,560
→ Short from supply, rejection expected
Triple tap + SFP = short trigger
↓
EQ LOWS $2,380–2,400
→ TP1 / watch for bounce
↓
BUY ZONE $2,280–2,320
→ Main long zone, enter on confirmation (bullish candle/SFP)
STOP below $2,250 = cancel idea
↑
TP1 $2,500
TP2 $2,900–3,000 (if strong bounce)
Main scenario — short from supply zone, target demand at $2,280–2,320. Long only if bounce is strong. Stop below $2,250. No confirmation — no trade.
Understanding SFP In Trading1. What is a Swing Failure Pattern (SFP)?
A Swing Failure Pattern (SFP) occurs when the price temporarily breaks a key swing high or low but fails to continue in that direction, leading to a sharp reversal.
This pattern is often driven by liquidity grabs, where price manipulates traders into taking positions before reversing against them.
An SFP typically consists of:
A false breakout beyond a previous swing high/low.
A sharp rejection back within the prior range.
A liquidity grab, triggering stop-loss orders and fueling a reversal.
SFPs provide powerful trade opportunities, signaling potential reversals and the exhaustion of trends.
2. Understanding Liquidity Grabs & Stop Hunts
The financial markets are structured around liquidity. Large institutions and algorithmic traders require liquidity to execute their large orders efficiently.
One way they achieve this is by triggering liquidity grabs and stop hunts.
Liquidity Grab:
Occurs when price moves beyond a key level (e.g., swing high/low), activating orders from breakout traders and stop-losses of trapped traders.
Smart money absorbs this liquidity before pushing the price in the opposite direction.
Stop Hunt:
A deliberate price movement designed to trigger stop-loss orders of retail traders before reversing.
Often seen near major support and resistance levels.
These events are crucial for understanding SFPs because they explain why false breakouts occur before significant reversals.
3. Why Smart Money Uses SFPs
Institutions, market makers, and algorithmic traders use SFPs to:
Fill large orders: By grabbing liquidity at key levels, they ensure they can enter large positions without causing excessive price slippage.
Manipulate retail traders: Many retail traders place stop-losses at obvious swing points. Smart money exploits this by pushing the price beyond these levels before reversing.
Create optimal trade entries: SFPs often align with high-probability reversal zones, allowing smart money to enter positions at better prices.
Understanding how institutions operate gives traders an edge in identifying manipulative moves before major price reversals.
4. Market Structure & SFPs
Market structure is built upon a series of swing highs and swing lows. Identifying these key points is crucial because they represent areas where liquidity accumulates and where price is likely to react.
Swing High (SH): A peak where price makes a temporary high before reversing downward.
Swing Low (SL): A trough where price makes a temporary low before reversing upward.
Types of Swing Points in Market Structure
Higher Highs (HH) & Higher Lows (HL) – Bullish Trend
Lower Highs (LH) & Lower Lows (LL) – Bearish Trend
Equal Highs & Equal Lows – Range-Bound Market
5. Liquidity Pools: Where Traders Get Trapped
Liquidity pools refer to areas where traders' stop-loss orders, pending orders, and breakout entries accumulate. Smart money uses these liquidity zones to execute large orders.
Common Liquidity Pool Zones:
Above swing highs: Retail traders place breakout buy orders and stop-losses here.
Below swing lows: Stop-losses of long positions and breakout sell orders accumulate.
Trendline & Range Liquidity:
Multiple touches of a trendline encourage traders to enter positions based on trendline support/resistance.
Smart money may engineer a fake breakout before reversing price.
6. Identifying Bullish SFPs
SFPs can occur in both bullish and bearish market conditions. The key is to identify when a liquidity grab has occurred and whether the rejection is strong enough to confirm a reversal.
Bullish SFP (Swing Low Failure in a Downtrend)
Price sweeps a key low, triggering stop-losses of long traders.
A strong rejection wick forms, pushing price back above the previous low.
A shift in order flow (bullish market structure) confirms a potential reversal.
Traders look for bullish confirmation, such as a higher low forming after the SFP.
Best bullish SFP setups occur:
At strong support levels
Below previous swing lows with high liquidity
After a liquidity grab with momentum confirmation
7. Identifying Bearish SFPs
Bearish SFP (Swing High Failure in an Uptrend)
Price takes out a key high, triggering stop-losses of short traders.
A sharp rejection forms, pushing the price back below the previous high.
A bearish shift in order flow confirms downside continuation.
Traders look for bearish confirmation, such as a lower high forming after the SFP.
Best bearish SFP setups occur:
At strong resistance levels
Above previous swing highs where liquidity is concentrated
With clear rejection wicks and momentum shift
8. How SFPs Signal Reversals
SFPs provide early warning signs of trend reversals because they expose areas where liquidity has been exhausted.
Once liquidity is taken and the price fails to continue in that direction, it often results in a strong reversal.
Key Signs of a Strong SFP Reversal
Long wick rejection (indicating absorption of liquidity).
Close back inside the previous range (invalidating the breakout).
Increased volume on the rejection candle (confirming institutional activity).
Break of short-term market structure (trend shifting).
Divergences with indicators (e.g., RSI divergence at the SFP).
9. Identifying High-Probability SFPs
One of the most critical aspects of a valid SFP is how the price reacts after a liquidity grab. The candle’s wick and close determine whether an SFP is strong or weak.
A. Wick Rejections & Candle Closes
Key Features of a Strong SFP Wick Rejection
Long wick beyond a key swing high/low (indicating a liquidity grab).
Candle closes back inside the previous range (invalidating the breakout).
Engulfing or pin bar-like structure (showing aggressive rejection).
Minimal body size relative to wick length (e.g., wick is 2–3x the body).
Bullish SFP (Swing Low Failure)
Price sweeps below a key low, triggering stop-losses of buyers.
A long wick forms below the low, but the candle closes back above the level.
This signals that smart money absorbed liquidity and rejected lower prices.
Best bullish SFPs occur at major support zones, previous swing lows, or untested demand areas.
Bearish SFP (Swing High Failure)
Price sweeps above a key high, triggering stop-losses of short sellers.
A long wick forms above the high, but the candle closes back inside the range.
This signals that smart money absorbed liquidity and rejected higher prices.
Best bearish SFPs occur at resistance levels, previous swing highs, or untested supply areas.
❌ Weak SFPs (Avoid These)
❌ Wick is too small, meaning the liquidity grab wasn’t significant.
❌ Candle closes above the swing high (for a bearish SFP) or below the swing low (for a bullish SFP).
❌ Lack of strong momentum after rejection.
B. Volume Confirmation in SFPs
Volume plays a crucial role in validating an SFP. Institutional traders execute large orders during liquidity grabs, which often results in spikes in trading volume.
How to Use Volume for SFP Confirmation
High volume on the rejection wick → Indicates smart money absorption.
Low volume on the breakout move → Suggests a lack of real buying/selling pressure.
Increasing volume after rejection → Confirms a strong reversal.
Spotting Fake SFPs Using Volume
If volume is high on the breakout but low on the rejection wick, the move may continue trending rather than reversing.
If volume remains low overall, it suggests weak market participation and a higher chance of chop or consolidation instead of a clean reversal.
Best tools for volume analysis:
Volume Profile (VPVR)
Relative Volume (RVOL)
Footprint Charts
10. Key Takeaways
SFPs are Liquidity Grabs – Price temporarily breaks a key high/low, triggers stop losses, and then reverses, signaling smart money absorption.
Wick Rejection & Close Matter – A strong SFP has a long wick beyond a swing point but closes back inside the range, invalidating the breakout.
Volume Confirms Validity – High volume on rejection wicks indicates smart money involvement, while low-volume breakouts often fail.
Higher Timeframes = Stronger SFPs – 1H, 4H, and Daily SFPs are more reliable than lower timeframe setups, reducing false signals.
Confluence Increases Probability – SFPs are most effective when aligned with order blocks, imbalances (FVGs), and major liquidity zones.
Optimal Entry Methods Vary – Aggressive entries capitalize on immediate rejection, while confirmation and retracement entries improve accuracy.
Proper Stop Loss Placement Prevents Fakeouts – Placing SL just beyond the rejection wick or using structure-based stops reduces premature exits.
Take Profit at Key Liquidity Levels – Secure profits at previous swing highs/lows, order blocks, or imbalance zones to maximize returns.
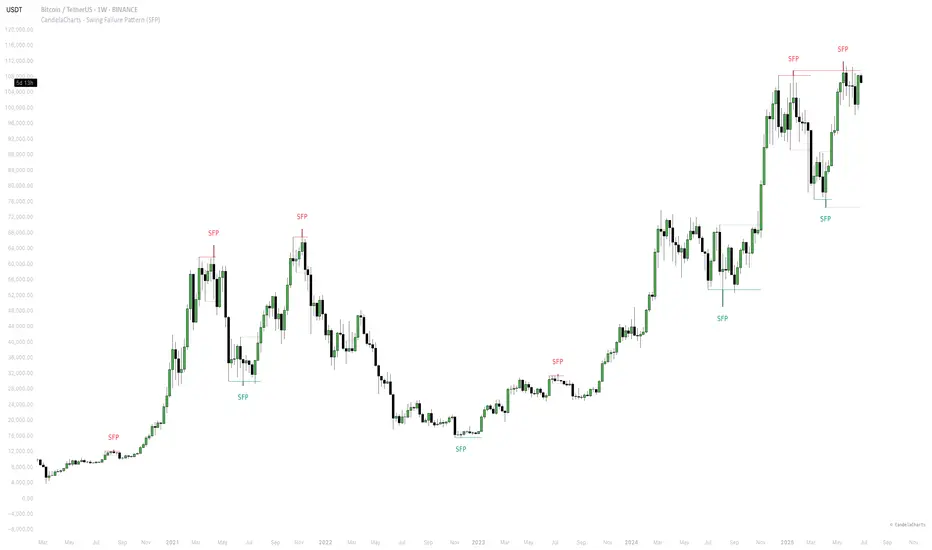
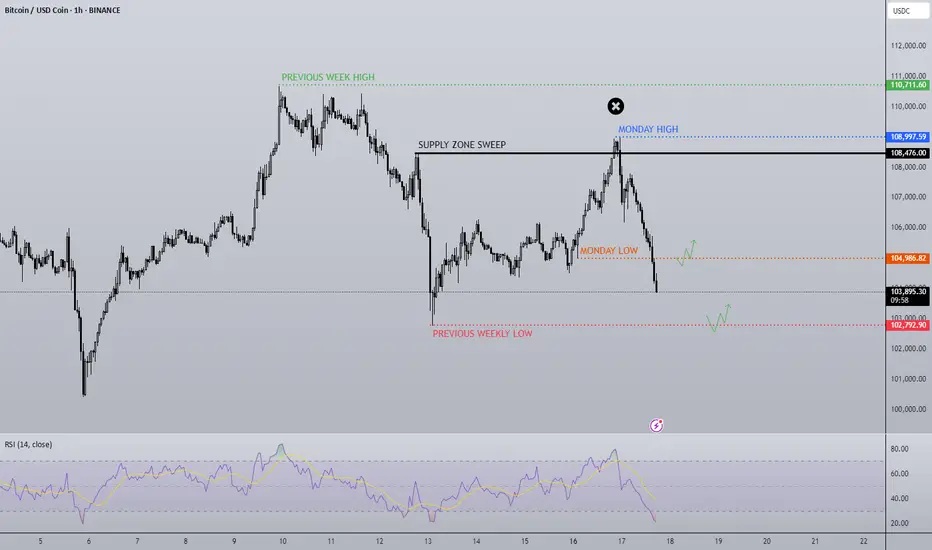
Bitcoin - Levels of the Range On the hourly time frame it is clear that BTC is within a rangebound environment. Using key levels such as the weekly highs and lows with Mondays highs and lows to to paint a picture of where support and resistance may be.
In the "weekly outlook" post for this week I suggested a retest of the $108,500 area, an orderblock that pushed prices lower and is notorious for protecting Stop losses of the shorts that pushed price lower, nearly instantly as the week starts we get that move to sweep the supply zone and stop hunt the short trades.
After a successful sweep the swing fail pattern typically follows when in a rangebound environment or absent of a trend. This structure plays out and the sell-off follows.
Price breaks through the Monday low with zero fight so momentum is with the bears in the low time frame. Should momentum continue the previous week low is @ $102,500 which is in line with HTF key level too.
RSI is also entering the oversold zone and in a rangebound environment can be when price reverses direction, as seen by the previous Monday High and Previous week low.
With FOMC just over 24 hours away volatility usually follows. No rate cut forecast however many think the interest rate should be brought down in line with inflation as the ECB has already done.
In conclusion, BTC is in a clear rangebound environment on the hourly time frame.
Stop loss hunt/supply zone sweep and then SFP, the LTF momentum is with the bears going into FOMC.
Next point of support at $102,500 (Previous week low) and could be boosted by the oversold RSI.
An FOMC rate cut should be bullish although currently thought to be unlikely.
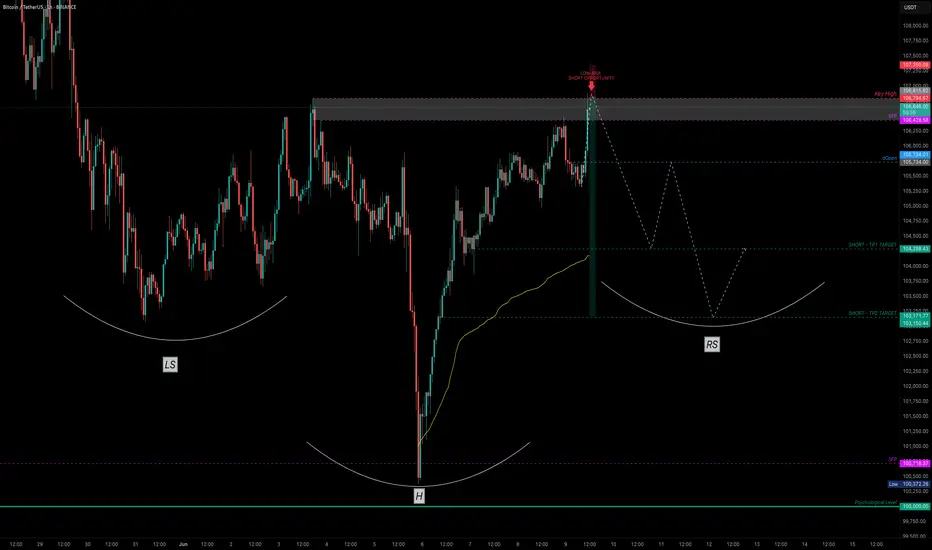
Bitcoin — Breakout or Bull Trap? SFP Setup ExplainedAfter a clean drop that nearly tagged the psychological $100K level, Bitcoin printed a Swing Failure Pattern (SFP) — sweeping the lows and snapping back with strength. That bounce wasn’t just a reaction — it was a liquidity reclaim.
Now, price structure is shaping into a potential Inverted Head & Shoulders — a classic reversal pattern often forming before a bullish continuation.
🔍 Key Level to Watch:
$106,694.63 — This recent key high was just taken out. If we see rejection here (SFP), it could set up a high-probability low-risk short opportunity.
🎯 Short Trade Idea (Only on SFP confirmation):
Entry: After price sweeps $106,694.63 and shows rejection
Stop-Loss: Above wick high (e.g., ~$107.4K)
TP Zones: $103.5K and $101.7K
R:R: ~1:7
✅ Cleaner setup with confluence from structure and liquidity — high probability if confirmed.
📚 Educational Insight: Why SFPs Work So Well
SFPs (Swing Failure Patterns) are some of the most powerful setups in trading because they:
Trap breakout traders
Sweep liquidity and reverse quickly
Offer clear invalidation (wick high/low)
Allow for tight stop-loss and high R:R setups
Using SFPs in conjunction with key highs/lows, volume, and structure dramatically increases your edge.
📈 Why Order Flow Is Crucial for SFPs
1. See the Trap Form in Real Time
SFPs are essentially traps — price sweeps a key level, sucks in breakout traders, and then reverses. Order flow tools let you see this happen:
A spike in market buys above resistance
Followed by a lack of follow-through (no new buyers)
And then an aggressive absorption or reversal (selling pressure hits)
Without order flow, this is all hidden in the candles.
2. Confirm Liquidity Sweeps with Delta & CVD
Watch for a delta spike or Cumulative Volume Delta (CVD) divergence — a clear sign that aggressive buyers are getting absorbed.
This gives you confirmation that the sweep failed, not just a random wick.
3. Tight Entries with Confidence
When you see actual trapped volume or liquidation clusters at the SFP level, you can enter tighter with conviction — because you're not guessing, you’re reacting to actual intent and failure in the market.
4. Early Warning System for Reversal or Continuation
If the SFP fails to trigger a reversal (e.g. buyers step back in with strength), you’ll see it early in the flow — and can quickly reassess.
🧠 Bottom Line:
Order flow lets you stop guessing and start seeing the actual fight between buyers and sellers. Combine it with SFPs, and you're not just trading price — you're trading intent. That edge is huge.
_________________________________
💬 If you found this helpful, drop a like and comment!
Want breakdowns of other charts? Leave your requests below.
SFPUSDT %132 Daily Volume SpikeSFPUSDT Analysis: Significant Volume Spike and Potential Move to Fresh Zones
There is a 132% daily volume increase in SFPUSDT, making it worth examining.
Currently, the price has almost exhausted the demand zone it recently reacted from. I believe it may now look for fresh demand zones at lower levels for the next significant reaction.
Key Points:
Volume Surge: 132% daily increase indicates strong activity.
Exhausted Zone: Demand zone has been nearly fully utilized.
Next Move: Watching for a potential test of fresh demand zones below.
If you think this analysis helps you, please don't forget to boost and comment on this. These motivate me to share more insights with you!
I keep my charts clean and simple because I believe clarity leads to better decisions.
My approach is built on years of experience and a solid track record. I don’t claim to know it all, but I’m confident in my ability to spot high-probability setups.
My Previous Analysis
🐶 DOGEUSDT.P: Next Move
🎨 RENDERUSDT.P: Opportunity of the Month
💎 ETHUSDT.P: Where to Retrace
🟢 BNBUSDT.P: Potential Surge
📊 BTC Dominance: Reaction Zone
🌊 WAVESUSDT.P: Demand Zone Potential
🟣 UNIUSDT.P: Long-Term Trade
🔵 XRPUSDT.P: Entry Zones
🔗 LINKUSDT.P: Follow The River
📈 BTCUSDT.P: Two Key Demand Zones
🟩 POLUSDT: Bullish Momentum
🌟 PENDLEUSDT.P: Where Opportunity Meets Precision
🔥 BTCUSDT.P: Liquidation of Highly Leveraged Longs
🌊 SOLUSDT.P: SOL's Dip - Your Opportunity
🐸 1000PEPEUSDT.P: Prime Bounce Zone Unlocked
🚀 ETHUSDT.P: Set to Explode - Don't Miss This Game Changer
🤖 IQUSDT: Smart Plan
⚡️ PONDUSDT: A Trade Not Taken Is Better Than a Losing One
💼 STMXUSDT: 2 Buying Areas
🐢 TURBOUSDT: Buy Zones and Buyer Presence
🌍 ICPUSDT.P: Massive Upside Potential | Check the Trade Update For Seeing Results
🟠 IDEXUSDT: Spot Buy Area | %26 Profit if You Trade with MSB
📌 USUALUSDT: Buyers Are Active + %70 Profit in Total

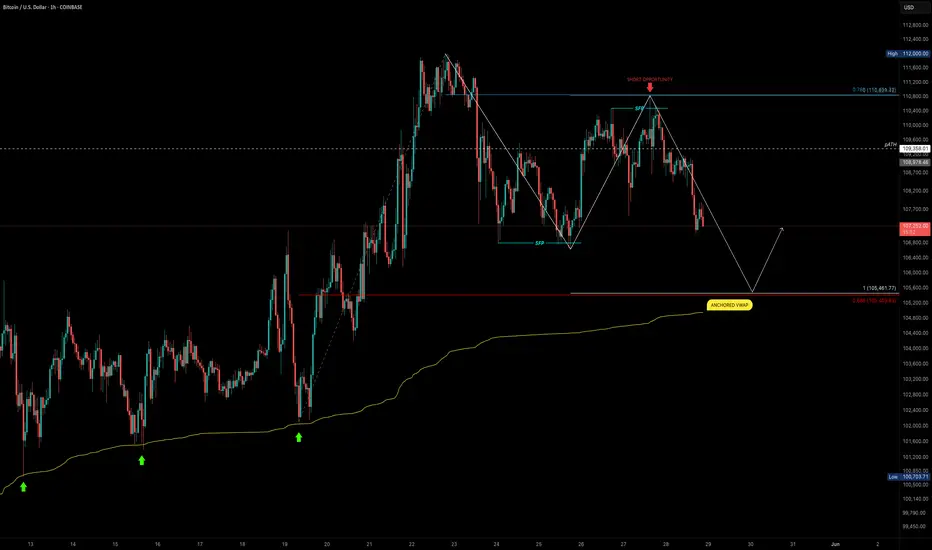
BTC Trap & Reverse: The Power of SFPs in ActionBTC continues to chop in a tight range near its previous all-time high. While price action may appear messy at first glance, traders using a combination of structure, Fibonacci levels, and order flow tools are spotting clean opportunities — especially through Swing Failure Patterns (SFPs).
🔍 What Just Happened?
Bitcoin recently rejected from the 0.786 Fibonacci retracement level — a classic reaction zone. What made this move powerful was the SFP that formed at that level. Price swept above a prior high, triggering breakout buys, only to reverse. This type of move traps late longs and offers an ideal short entry.
🧠 Educational Insight: Why SFPs Are One of the Best Setups
SFPs (Swing Failure Patterns) are some of the highest-probability trades you can take for a few key reasons:
1️⃣ Liquidity-driven: They form where stop losses cluster — above highs or below lows — creating a magnet for price.
2️⃣ Clean invalidation: The wick high/low gives a natural stop-loss level, keeping risk tight.
3️⃣ Fast reaction: Once trapped traders are forced to exit, price often reverses sharply — giving you strong follow-through.
4️⃣ Confirmable with order flow: Using tools like Exocharts, you can see aggressive longs/shorts piling in just before the reversal. This adds conviction to the setup.
📏 Current Confluence:
Rejection from the 0.786 Fib retracement
SFP confirmed on high volume
1:1 trend-based Fib extension sits at ~$105,410
That level also lines up with the 0.666 Fib retracement
Anchored VWAP around $105K
Liquidity pool right at that zone too — a likely magnet
🎯 Trade Idea:
Short triggered at the SFP wick, stop just above it. First target: the 1:1 extension near $105.4K. Risk-reward is excellent with high probability if price continues to unwind late longs.
✅ Key Takeaway:
In ranges like this, you don’t need to guess direction — you need to react to structure. SFPs give you that edge. When paired with real-time tools like Exocharts and anchored VWAPs, these trades become sniper entries rather than coin flips.
Let the market show its hand — and trade the reaction, not the prediction.
📌 Summary:
This is how you avoid overtrading in chop: wait for key levels, watch how price reacts, and let trapped traders create the move. If BTC revisits the $105K region, it’s a major area to watch for reaction — or to take partials if you’re in a short.
The best trades come from patience + precision.
_________________________________
If you found this helpful, leave a like and comment below! Got requests for the next technical analysis? Let me know.
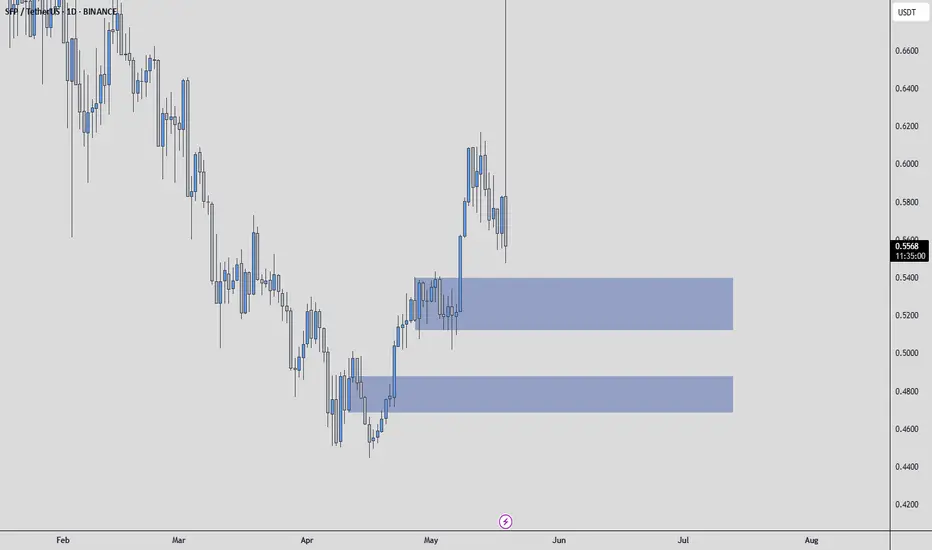
SFPUSDT | Watching the Blue Boxes for Bullish BreakoutsSFPUSDT has settled into a well‑defined area of interest and I’ll be focused on how price behaves inside the blue box. This zone has acted as support in prior pullbacks and now it could offer traders an opportunity for a quick upside move.
🟦 Blue Boxes = Support Zones
This areas has repeatedly attracted buyers and could act as a springboard. When price returns here, it’s a signal to pay close attention.
📈 Trade Plan
Low Time Frame Breakouts
Wait for a clear breakout on a 1hour/4hour chart inside the blue box. That tells us buyers are stepping in decisively.
Volume and CDV Confirmation
A genuine move will be backed by rising trading volume and positive shifts in Cumulative Delta Volume. Without those confirmations it’s safer to stay on the sidelines.
Defined Risk
Place stops just below the blue box so your downside is limited if support fails.
🤝 Why Trust This Setup
I focus on the setups that align volume, structure, and order flow with proven precision. My followers consistently see results because each level I share comes from real‑time market behavior and thorough analysis. Trade with the market’s confirmation and you’ll know you’re in sync with smart money rather than chasing noise.
📌I keep my charts clean and simple because I believe clarity leads to better decisions.
📌My approach is built on years of experience and a solid track record. I don’t claim to know it all but I’m confident in my ability to spot high-probability setups.
📌If you would like to learn how to use the heatmap, cumulative volume delta and volume footprint techniques that I use below to determine very accurate demand regions, you can send me a private message. I help anyone who wants it completely free of charge.
🔑I have a long list of my proven technique below:
🎯 ZENUSDT.P: Patience & Profitability | %230 Reaction from the Sniper Entry
🐶 DOGEUSDT.P: Next Move
🎨 RENDERUSDT.P: Opportunity of the Month
💎 ETHUSDT.P: Where to Retrace
🟢 BNBUSDT.P: Potential Surge
📊 BTC Dominance: Reaction Zone
🌊 WAVESUSDT.P: Demand Zone Potential
🟣 UNIUSDT.P: Long-Term Trade
🔵 XRPUSDT.P: Entry Zones
🔗 LINKUSDT.P: Follow The River
📈 BTCUSDT.P: Two Key Demand Zones
🟩 POLUSDT: Bullish Momentum
🌟 PENDLEUSDT.P: Where Opportunity Meets Precision
🔥 BTCUSDT.P: Liquidation of Highly Leveraged Longs
🌊 SOLUSDT.P: SOL's Dip - Your Opportunity
🐸 1000PEPEUSDT.P: Prime Bounce Zone Unlocked
🚀 ETHUSDT.P: Set to Explode - Don't Miss This Game Changer
🤖 IQUSDT: Smart Plan
⚡️ PONDUSDT: A Trade Not Taken Is Better Than a Losing One
💼 STMXUSDT: 2 Buying Areas
🐢 TURBOUSDT: Buy Zones and Buyer Presence
🌍 ICPUSDT.P: Massive Upside Potential | Check the Trade Update For Seeing Results
🟠 IDEXUSDT: Spot Buy Area | %26 Profit if You Trade with MSB
📌 USUALUSDT: Buyers Are Active + %70 Profit in Total
🌟 FORTHUSDT: Sniper Entry +%26 Reaction
🐳 QKCUSDT: Sniper Entry +%57 Reaction
📊 BTC.D: Retest of Key Area Highly Likely
📊 XNOUSDT %80 Reaction with a Simple Blue Box!
📊 BELUSDT Amazing %120 Reaction!
📊 Simple Red Box, Extraordinary Results
I stopped adding to the list because it's kinda tiring to add 5-10 charts in every move but you can check my profile and see that it goes on..
Intraday Playbook ES Futures: Trade Setup & Context CME_MINI:ES1!
Big Picture Context
Please see related trade idea.
In this analysis, we refine our intraday levels to identify potential trade setups. We also review recent price action and present a high-probability long trade example that frequently offers favorable risk-reward dynamics when it plays out successfully.
See chart image below reviewing yesterday’s long trade opportunity.
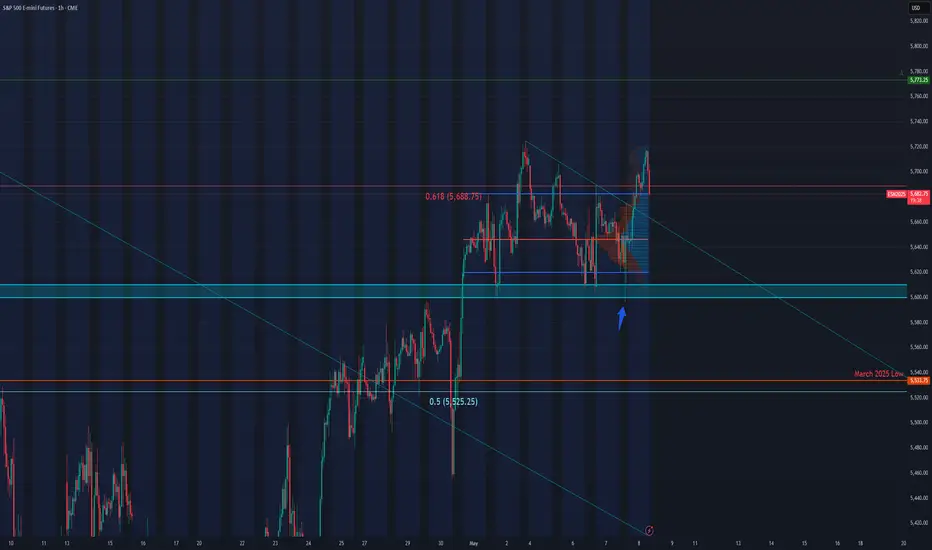
Example Trade Setup: SFP Long
Time frame: 1 hour or 30 mins
• Entry: 5612
• Stop: 5595.50 (below SFP candle)
• Target: 5682 (mCVAH — confluence with recent highs)
• Risk: 66 ticks
• Reward: 280 ticks
• Risk/Reward Ratio: 4.2 R
Note: Past performance is not indicative of future results.
________________________________________
Intraday Market Structure Review
What has the market done?
• ES Futures have rallied and reclaimed a key technical level.
• Currently trading above:
o March 2025 low
o 2025 mid-year level
o Developing Value Area Low (VAL) for the 2025 Volume Profile
What is the market trying to do?
• Recover prior months' losses.
• Price action is climbing steadily, establishing higher lows.
How well is it doing?
• Despite headline risks, ES futures show resilience.
• Price has painted green candles in the full session for the past 10 consecutive days—a strong bullish structure.
________________________________________
What Is More Likely to Happen from Here?
Scenario 1: Pullback and Continuation Higher
A pullback toward the 0.618 Fib retracement and mCVAH confluence could offer another long setup, targeting the April 2nd high. This is further supported by NQ already reclaiming those highs, with ES still lagging but showing strength.
Example Trade Idea:
Time frame: 1 hour or 30 mins
• Entry: 5688
• Stop: 5680
• Target: 5724 (May 2 High)
• Risk: 32 ticks
• Reward: 144 ticks
• Risk/Reward Ratio: 4.5 R
Target may be adjusted if relative volume and delta support strong momentum toward April 2nd highs.
________________________________________
Scenario 2: Further Consolidation
• Sellers push prices back into last week's balance/value area.
• Market consolidates and builds energy for a likely next leg higher.
• No short setup is presented, as current risk and stop placement do not justify initiating short positions.
Important Notes:
• These are example trade ideas not intended to be a recommendation to trade, and traders are encouraged to do their own analysis and preparation before entering any positions.
• Stop losses are not guaranteed to trigger at specified levels, and actual losses may exceed predetermined stop levels.
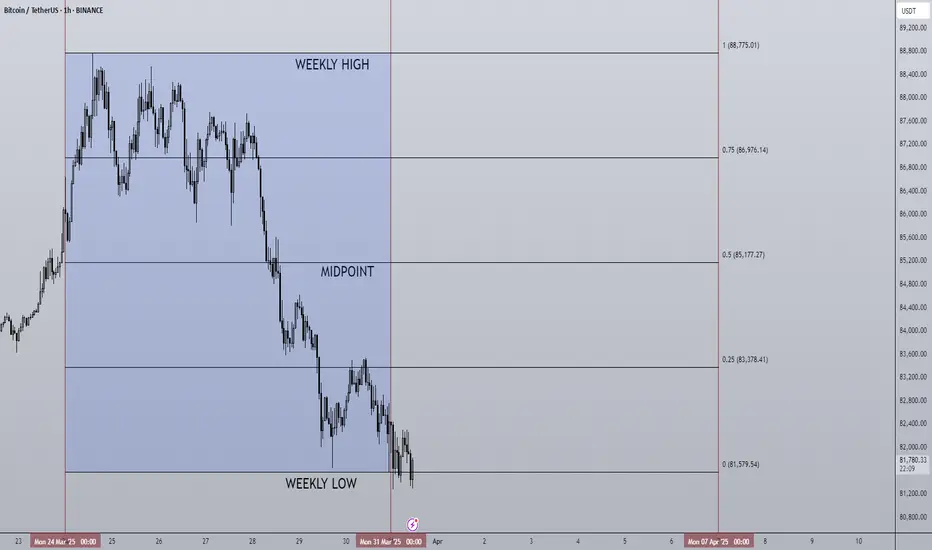
31/03/25 Weekly outlookLast weeks high: $88,775.01
Last weeks low: $81,579.54
Midpoint: $85,177.27
As Q1 2025 draws to a close, last week we saw a mirror image of the March 17th week with a swing fail pattern of the weekly high and a gradual sell=off throughout the week.
The reluctance for buyers to step into the market under the $91,000 resistance is telling me that the bulls are just not confident in current market conditions to bid into resistance. This may be because of the Geo-political factors, ongoing war, tariffs etc. Uncertainty does worry investors and so it's a valid reason.
From a TA standpoint however is a bigger worry in my opinion. Bitcoin failed to flip the 4H 200 EMA after the 8th time of trying since mid February and that is the biggest concern for me. As long as this moving average caps and reversal pattern then the trend is still bearish and should be treated as such.
$73,000 is still the target for a downward move IMO, a further -10% move from current prices. For the bulls a SFP of the weekly low could set up another bounce to weekly highs that have remained in approximately the $88,000 zone for two straight weeks. Major resistance around those levels and of course the dreaded 4H 200 EMA must be flipped too. Currently this is a tall order given how price action has been of late, sentiment is poor and altcoins are completely decimated in most cases. So I can't see the majority wanting to buy in until these criteria are met and we're trading back above $91,000.
This is still a traders environment, not a Hodler/investor.
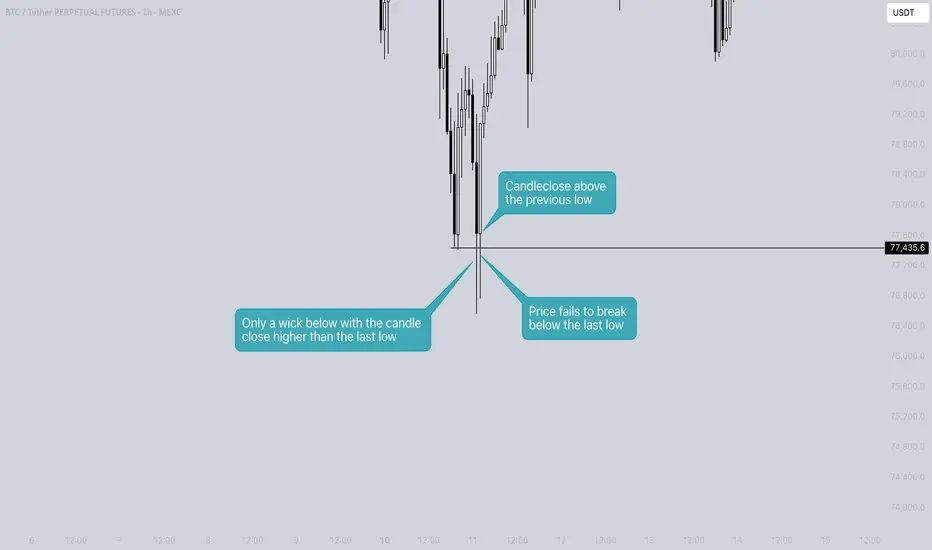
What is a Swing Failure Pattern? - Basic explanation!A Swing Failure Pattern (SFP) is a technical chart pattern often used in price action trading to identify potential reversals in the market. It is typically seen on candlestick or bar charts in the context of trend analysis.
The basic idea behind a Swing Failure Pattern is that the price temporarily breaks above or below a previous swing high or low, but fails to sustain that move and reverses direction quickly. This indicates a potential shift in market sentiment, and it can be a signal for a trend reversal or breakdown.
When is it a SFP?
- In needs to sweep the previous low
- It has to close the candlestick above the previous low. So only a wick down When the price closes the body of a candle below the last low, it will not be considered an SFP. In this case, it is highly likely that the trend will continue in that direction.
The SFP can occur across various timeframes, from lower to higher timeframes.
Example on the daily timeframe
Here, we see two SFPs: one to the upside and one to the downside.
Thanks for your support.
- Make sure to follow me so you don't miss out on the next analysis!
- Drop a like and leave a comment!
SFP’s 43x Potential: Now the Time to Jump In?SEED_DONKEYDAN_MARKET_CAP:SFP has been forming a large symmetrical triangle since its listing. The market makers have deliberately used two stages over more than 1,000 days to consolidate.
▍Stage 1: Consolidation lasted from 05/2022 to 10/2023, spanning 521 days (marked with a blue box).
▍Stage 2: Consolidation started in 10/2023 (marked with a green box).
If we estimate 521 days for this stage as well, the time point will fall on 03/16/2025, which coincides with the end of the large symmetrical triangle.
Trading volume has been in a long-term downtrend. When volume shrinks to its limit, a clear breakout direction will emerge.
Coupled with the upcoming peak bull market phase, it's likely to break upwards.
There’s an old saying in investing: the longer the consolidation, the higher the breakout.
The key players have spent 2.5 years patiently consolidating, concentrating the tokens in strong hands.
When coins like this break out, they tend to "take the elevator" straight up, leaving no chance to buy in later.
Based on the expected breakout range of the triangle, the maximum potential upside is approximately 43x from the breakout point, targeting a price of $34.
I believe this is the perfect time to enter. What do you think?

06/01/25 Weekly outlookLast weeks high: $98,987.05
Last weeks low: $91,544.67
Midpoint: $95,265.86
2024 is over, 2025 has begun...
Bitcoin ending the year at its highest point since its creation after an impressive rally mainly at both ends of the year with a cool off in the middle.
Now that 2025 has started Bitcoin is looking to break $100,000 once more and begin what many believe to be the final year of the bullmarket. With the holidays now over and year open window dressing now done I would expect volume to return to the markets. Last week we saw a steady climb from the $92,000, whipsaw PA at year end and then a move up to just under $100,000. All that on very low volume which does make me a little worried, similar to weekend moves it's hard to know if they are true moves or just the result of a thin orderblock, this week will answer that question.
Some important data releases for this week include:
Tuesday - Euro CPI
Wednesday - US ADP Nonfarm employment, FOMC minutes
Thursday - CNY CPI & PPI, US Jobless claims
Friday - US Unemployment rate
As we get closer to president Trumps inauguration and the shift in the US from an anti crypto approach to a pro crypto approach, this week should be in preparation for that and could be reactive to news of Trumps administration choices and updates on the "Strategic bitcoin reserve" etc. These reactions could be positive or negative so getting a read on the market in the opening few days maybe wise.
The chart shows and early break above weekly high, this opens up the opportunity for a SFP if the weekly high is lost, if that is the case a drawdown towards Midpoint is on the cads, however if the weekly high is held as support a move towards $100,000 once again is the bullish target. Increased volume would cement either move as the weekly bias.
Good luck to all this year!

SFPUSDT 1WSFP ~ 1W
#SFP This trade is high risk. But if you still have Conviction on the coin,. This is a very good support block to start buying gradually,. with short term targets Minimum 20%+
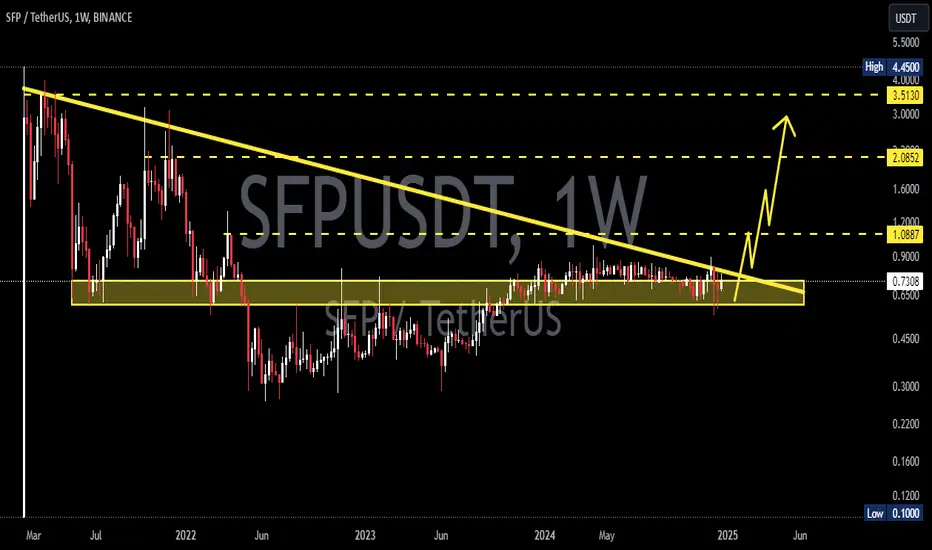
70% Pump On The Horizon (:Massive Upside Potential.
Lows of the range has been swept. Next challenge is to break the trendline and continue upwards.
Calculate Your Risk/Reward so you don't lose more than 1% of your account per trade.
Every day the charts provide new information. You have to adjust or get REKT.
Love it or hate it, hit that thumbs up and share your thoughts below!
This is not financial advice. This is for educational purposes only.

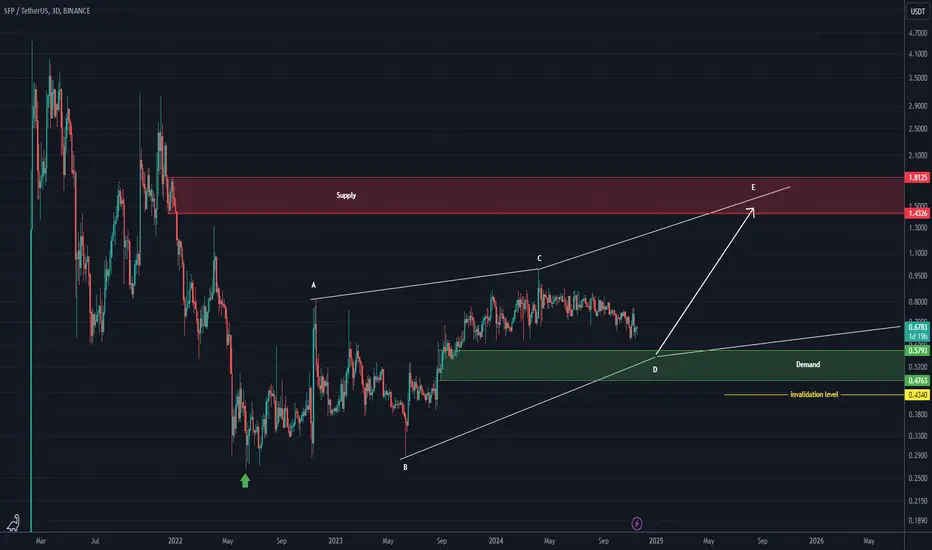
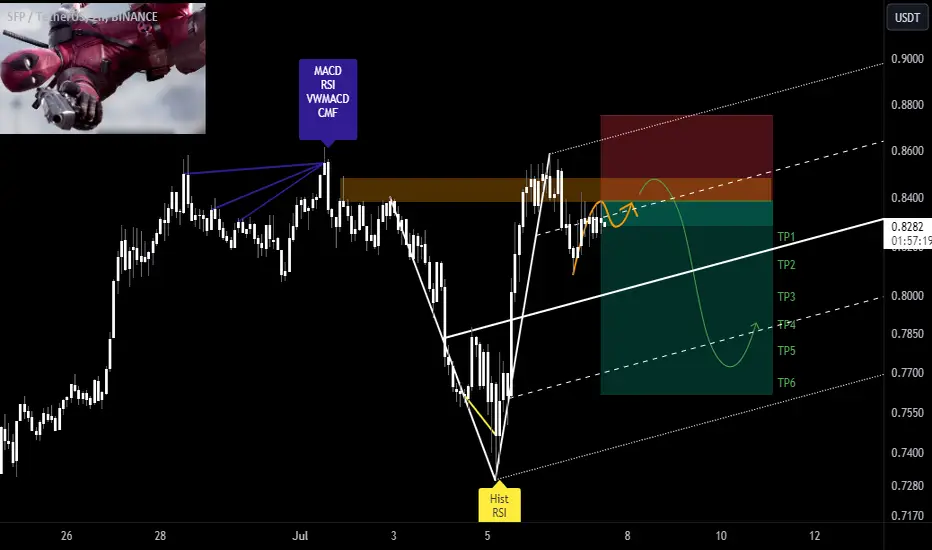
SFP ROADMAP (3D)It looks like the SFP has formed a diametric from where we put the green arrow on the chart.
It now appears to be at the end of wave D.
By maintaining the green range, it can move towards the targets.
Closing a daily candle below the invalidation level will violate this analysis
For risk management, please don't forget stop loss and capital management
Comment if you have any questions
Thank You
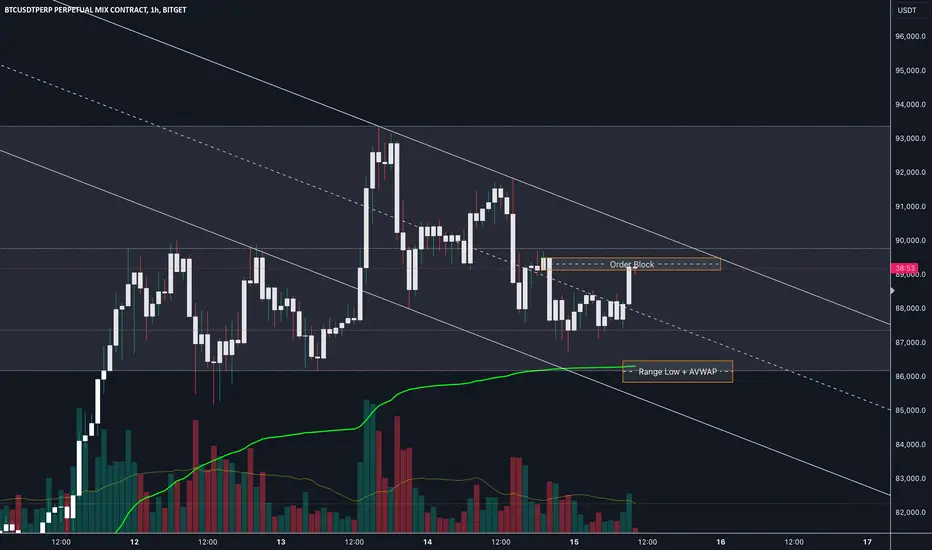
Patience is LONGSo in this image, I hope that you can see the obvious. We have a wide range that we could potentially be trading from top to bottom until one side breaks. My idea right now is that we still haven't taken out the range low, which would also take out some of the liquidity wicks. I've also added the downtrending range to keep in mind and backup my thoughts that this could just be a correction for a bigger jump to the upside.
That's where I would look for:
A loss of that level
A reclaim ( possibly a swing failure pattern, ie, wick below and close above the lows )
A change of market structure
A long trade entry
This is assuming we come back down here, of course. If we don't, then we look for the top of the range for vice versa option or a continuation of this incredible bullish trend where we find support at the highs and continue on.
Always keep in mind that we may not get the SFP and the close back above the lows, this could take patience if we start to see a back test of them laws, and a loss of that level.
Losing BITGET:BTCUSDT.P $36,000 ish would look more bearish and we might even end up closing the CME gap below.
Just sharing some thoughts, so you are aware of the range that we're in. Sometimes I miss these things and they could be really great opportunities for both long and shorts until one side breaks.
This is not financial advice.
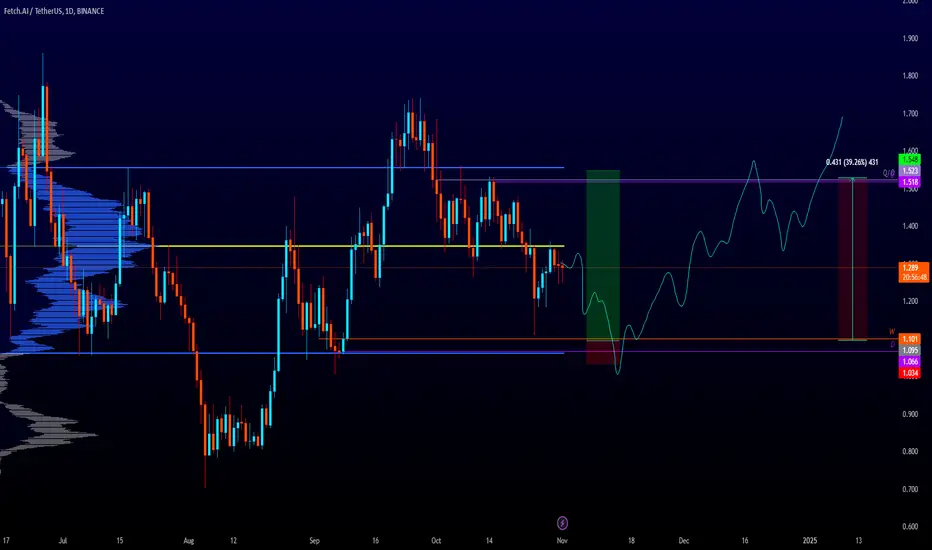
FET Solid Long Entry & TargetA few untested KEY levels below would be a nice place to enter a long trade if we get the reaction we are looking for. The target would be the Value Area High & other untested KEY levels above.
Calculate Your Risk/Reward so you don't lose more than 1% of your account per trade.
Every day the charts provide new information. You have to adjust or get REKT.
Love it or hate it, hit that thumbs up and share your thoughts below!
This is not financial advice. This is for educational purposes only.
21/10/24 Weekly outlook (day late)Last weeks high: $69,001.51
Last weeks low: $62,475.70
Midpoint: $65,738.60
Bit of a different weekly outlook this week as I couldn't post yesterday. So with the benefit of hindsight it looks like we have a swing fail pattern in the making after taking the liquidity from the $69,000 ('21 ATH) level.
I would say judging by the chart I would want the downside to be capped at the Midpoint, continuing the trend pattern of higher highs and higher lows. The '21 ATH has been the biggest hurdle for BTC over the last 7 months with repetitive rejections, if the lows can keep creeping up then eventually we should get a spring above and that should be the move for an ATH run which should happen soon after if all goes well.
Naturally we have ever increasing outside interference with the US election just around the corner, we know this is likely to cause volatility so be careful of that. Prediction markets like Polymarket have Trump as favourite, he is the pro bitcoin candidate so it should be a positive for the space if he were to be elected but you never quite know what will happen until it's confirmed.
This week I want to see BTC continuing to make higher lows and higher highs. Altcoins have cooled off a little too after the initial BTC burst up from $60,000 so I'm looking for opportunities there too.

Short position on SFPUSDT 2H/ Trading setupBINANCE:SFPUSDT
Mid-risk status: 2x-5x Leverage
⚡️TP:
On the chart
➡️SL:
0.875
The Alternate scenario:
If the price stabilize below the trigger zone, the setup will be cancelled.
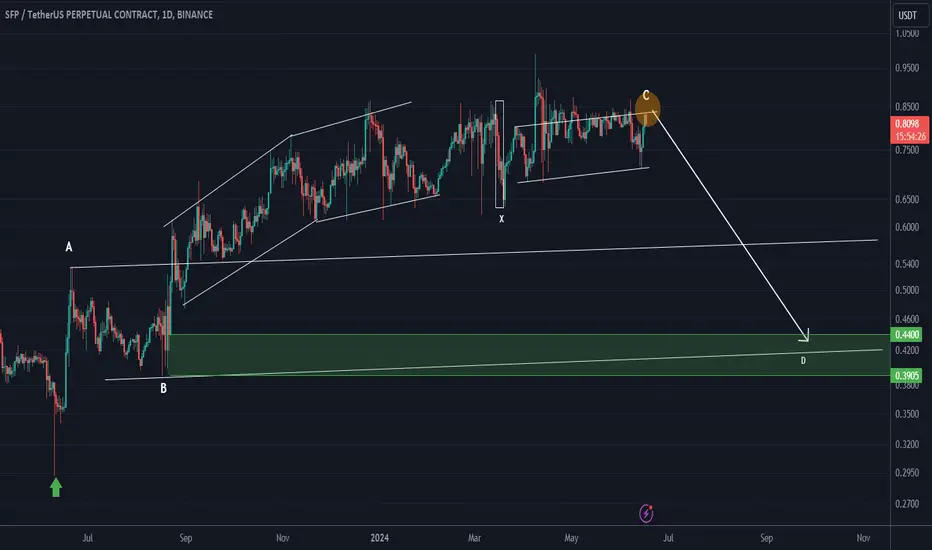
SFP looks super bearishFrom where we put the green arrow on the chart, it looks like SFP is completing a triangle.
It seems that we are at the end of wave C and the structure of wave C was a double hybrid.
It is expected to drop towards the green range for wave D.
Closing a daily candle above the invalidation level will violate the analysis.
invalidation level : 0.95
For risk management, please don't forget stop loss and capital management
When we reach the first target, save some profit and then change the stop to entry
Comment if you have any questions
Thank You
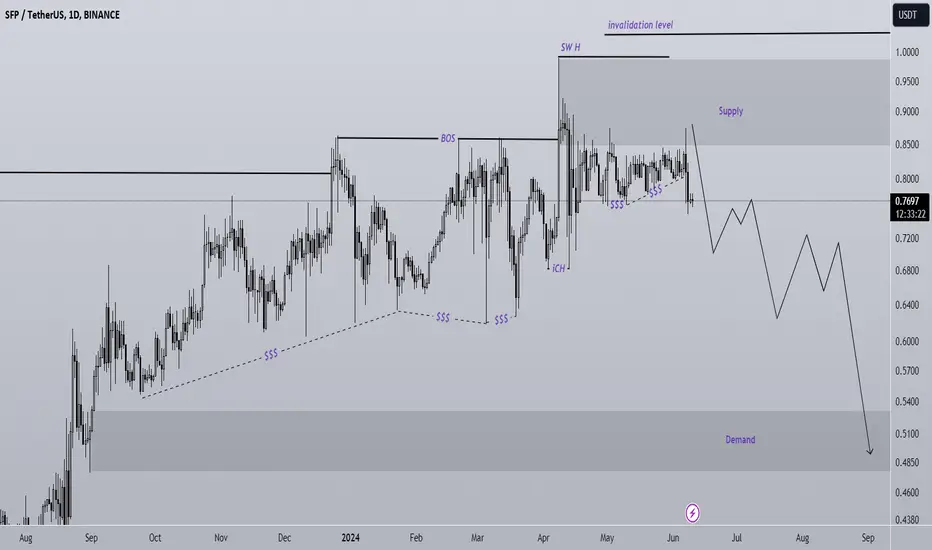
SFP is bearishThe upward momentum of the price has been greatly reduced
We have a bearish iCH on the chart
Below the price is full of liquidity pools
The SFP bear spring seems to have collapsed
By maintaining the supply, it can move towards the targets
Closing a daily candle above the invalidation level will violate the analysis
Note that the financial market is risky, so:
Do not enter any position without confirmation and trigger.
Do not enter a position without setting a stop.
Do not enter a position without capital management.
When we reach the first TP, save some profit and try to move the stop continuously in the direction of your profit.
If you have any comments please post them, comments will help us improve our performance
Thanks