SFPUSDTHello to you all. Mars Signals team wishes you high profits at all times.
The price is inside a bullish triangle and there is the possibility for it to grow. In case it is able to break its triangle, we can expect higher prices for it.
We recommend this token for long-term investment.
Warning: This is just a suggestion to you and we do not guarantee profits.
Wish you luck!
Sfp
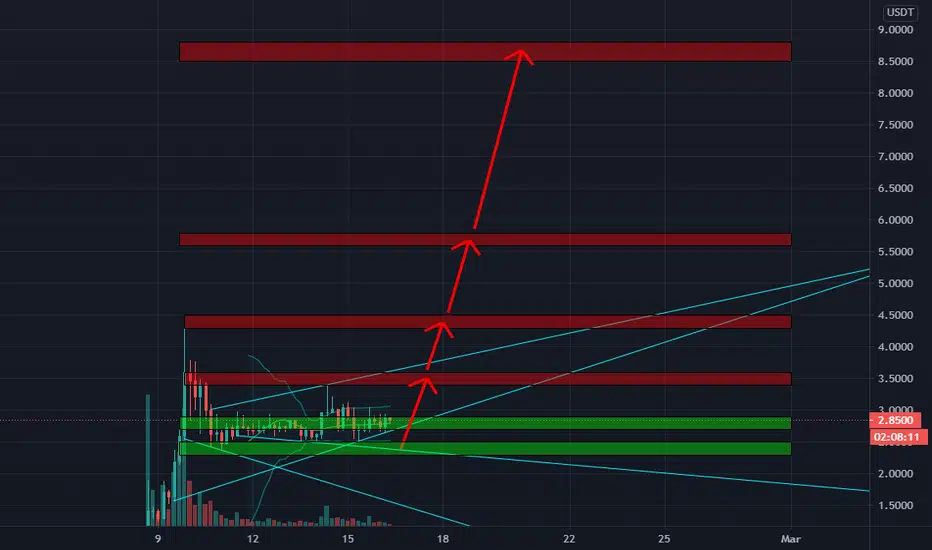
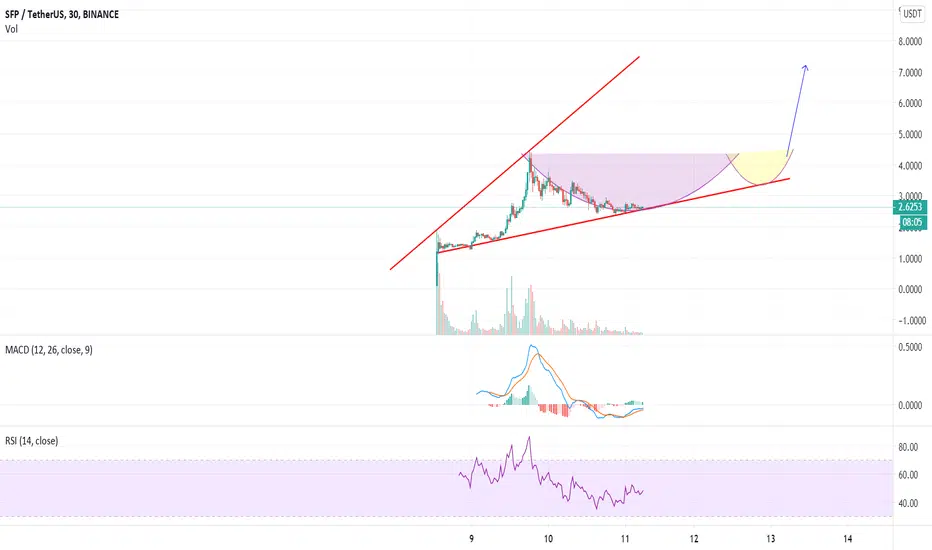
SFP about to break outBrothers, gents, amigo’s and amiga’s,
SFP went right up after being listed on Binance, where after it made a correction and has been going sideways for a few days now.
When looking at charts; people quite often tend to look at short term projections, but imo you should always zoom out a bit more. Only then you can see the bigger trend (which matters the most).
If we look at the chart we can see the lines beautifully connect and see a big symmetrical triangle building up.
When we interpret the numbers, there should be an impressive breakout right after it breaks the upper trend line. (+2.50 usd imo)
Furthermore, the fundamentals on this coin look good (their monthly strategy for new coin offerings, marketing plans, upcoming listings on other exchanges, teaming up with multiple other top 20 coins).
Be patient, have faith and dyor.
Because at the end of the day; this will be a (rocket)ride you don’t want to miss.
Ciao,
TheKoalaMan

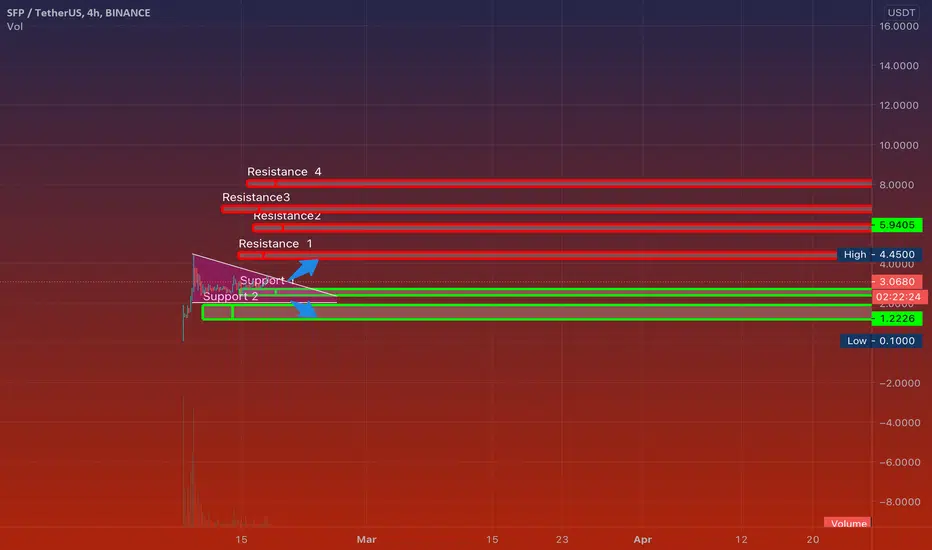
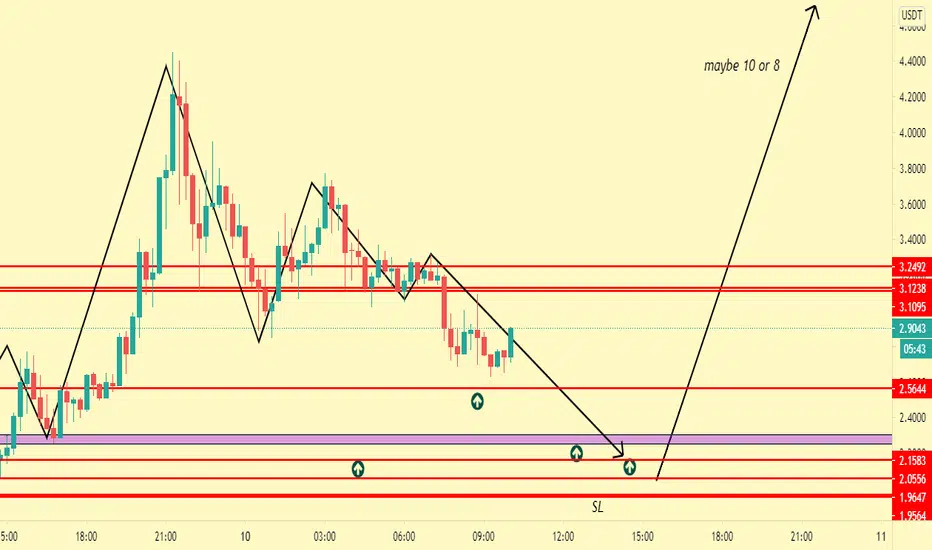
🆓SafePal/USDT Analysis (16/2) #SFP $SFPSFP is still moving sideways around $2.8 and buying force is still dominant, so I think that SFP still has a strong uptrend like Feb 10.
📈BUY
-Buy: 2.7-2.9$
-Buy: 2.3-2.5$. SL if B
-Buy: 3.4-3.6$ if A. SL if B
📉SELL
-Sell: 3.4-3.6$. SL if A
-Sell: 4.3-4.5$. SL if A
-Sell: 5.6-5.8$. SL if A
-Sell: 8.5-8.8$. SL if A
❓Details
Condition A : "If 4H candle closes ABOVE this zone"
Condition B : "If 4H candle closes BELOW this zone"


SFPSFP built head and shoulder pattern just like sandbox coin it going to boom.
Do your analysis before following my idea

SFPUSDT (SAFEPAL) - UPTREND CONTINUATION ANALYSIS 🔎
- SFPUSDT hit an All time high (ATH) and retraced to the 0.618 fibonacci retracement level.
- The retracement was bounded in the falling wedge pattern
- A falling wedge pattern is a bullish reversal pattern.
- Price brokeout above the falling wedge's resistance.
- Price is currently ranging in a rectangular consolidation pattern.
- This rectangular consolidation pattern is known as the accumulation phase (Wyckoff method).
- The accumulation phase is a pre uptrend phase (bullish build up pattern).
- There's a breakout potential.
BUY ENTRY ⬆️
- Breakout above the rectangular consolidation pattern's horizontal resistance (R1).
TARGETS 🎯
- Horizontal resistance level (R2).
- All Time High (ATH) resistance (R3).
- Fibonacci extension levels.
SETUP INVALIDATION ❌
- Breakdown below the rectangular consolidation pattern's horizontal support (S1).


Optimistic continuation regarding the SAFEPAL scenario! SFP M15Technical analysis regarding the price of SAFEPAL in relation of dollar Tether for the next scenarios, based on 15 minutes movement.
disclaimer
*** In accordance with CVM Instruction No. 598, of May 3, 2018, Art. 21, I declare that the recommendations of this analysis reflect solely and exclusively my personal opinions and perceptions and that they were prepared independently and autonomously. Not being considered a purchase and/or sale recommendation. ***

End of correction and welcome impulsive wave!? SAFEPAL M15Technical analysis regarding the price of SAFEPAL in relation of dollar Tether for the next scenarios, based on 15 minutes movement.
Price found support along with 89 period EMA. Convergence with the RSI exceeding the neutral line * being positive and the price moving in an inverse way, with descending tops ~ divergence.
MACD losing selling pressure. Could it be the end of that correction !? Well, in the Technical context, we may be facing a new impulsive wave. Who knows!?
disclaimer
*** In accordance with CVM Instruction No. 598, of May 3, 2018, Art. 21, I declare that the recommendations of this analysis reflect solely and exclusively my personal opinions and perceptions and that they were prepared independently and autonomously. Not being considered a purchase and/or sale recommendation. ***

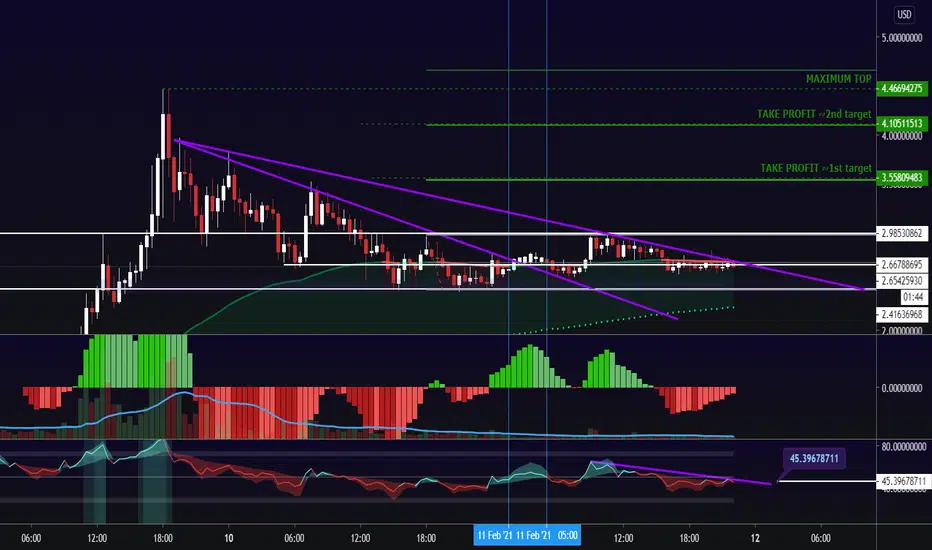
Optimistic analysis before the SFP scenario! Price projectionTechnical analysis regarding the price of SAFEPAL in relation of dollar Tether for the next scenarios, based on 30 minutes movement.
Price comes in with a very sharp drop and is losing its selling strength/pressure.
On February 11th, strong buyer demand drove the price exponentially, closing always above!
I strongly believe in the potential of this crypto for the next scenarios, be it in the medium and/or long term.
RSI> 45 gaining strength. 34 period EMA driving crypto price.
disclaimer
*** In accordance with CVM Instruction No. 598, of May 3, 2018, Art. 21, I declare that the recommendations of this analysis reflect solely and exclusively my personal opinions and perceptions and that they were prepared independently and autonomously. Not being considered a purchase and/or sale recommendation. ***
SFPUSDT (SFP) - UPTREND CONTINUATION ANALYSIS 🔎
- SFPUSDT retraced for a retest of the ascending channel support and 0.618 fibonacci retracement level.
- The retracement was bounded in a falling wedge pattern.
- This is a bullish reversal pattern.
- Price brokeout above the falling wedge's resistance and is currently retesting the falling wedge's resistance.
- Possible uptrend continuation.
BUY ENTRY ⬆️
- Current market price (now).
TARGETS 🎯
- Horizontal resistance level (R1).
- Horizontal resistance level (R2).
- Fibonacci extension levels.
- Ascending channel resistance.
SETUP INVALIDATION ❌
- Breakdown below the swing low horizontal support level (S1) and ascending channel support.

I am bullish on $SFP! Kinda biased but I have a feeling that this pump is not yet over!
Sellers are kinda getting tired here...
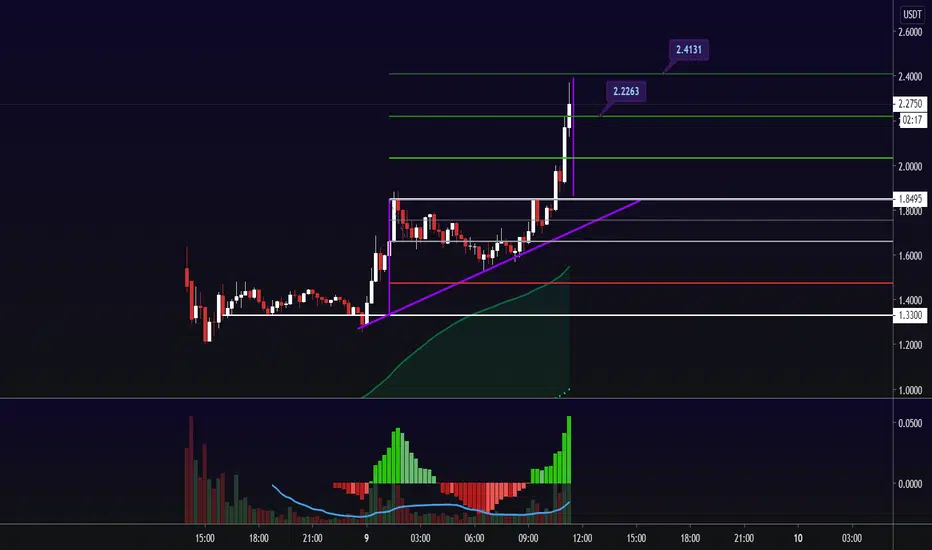
SAFEPAL a crypto with incredible potential for appreciation! SFPTechnical analysis regarding the price of SAFEPAL in relation of dollar Tether for the next scenarios, based on 15 minutes movement.
This crypto was listed on Binance yesterday at 10am and so far it has only been increasing! It is a great investment for anyone looking for medium/long term returns.
A company with great fundamentals and solid bases to deliver what it says! I've been investing heavily in this crypto and well, the trend is to increase its price even more.
Projection made a little over the hour, on a 15-minute graph, to which the graphical pattern (ascending triangle) is materializing and there is also confluence of the regions with Fibonacci.
disclaimer
*** In accordance with CVM Instruction No. 598, of May 3, 2018, Art. 21, I declare that the recommendations of this analysis reflect solely and exclusively my personal opinions and perceptions and that they were prepared independently and autonomously. Not being considered a purchase and/or sale recommendation. ***
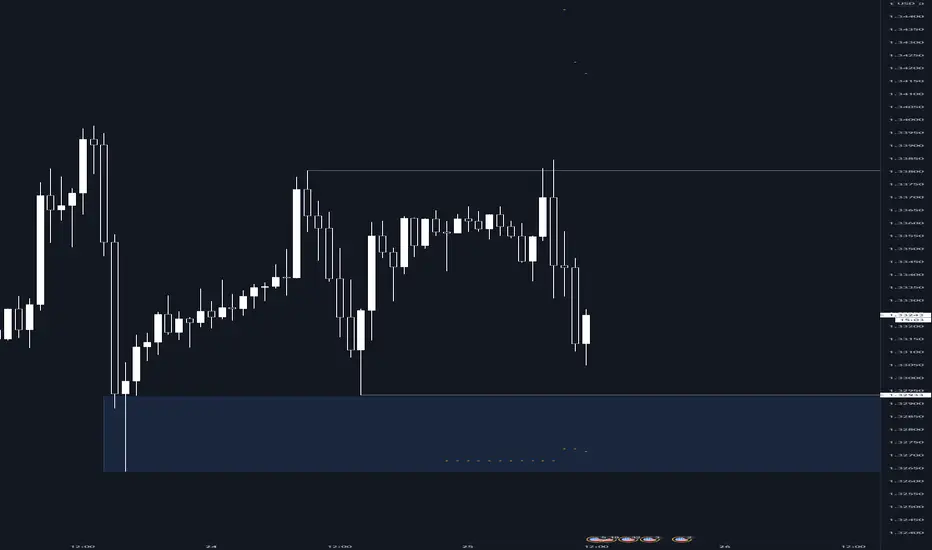
GBPUSD - Liquidity TrapLooking for a potential Liquidity Trap here to trap new sellers predicting a change in trend and squeeze out current long positions.
I am looking from an institutional point of view, where liquidity is needed before a further move to the upside.
This area of business (blue rectangle) interests me as we have nice prior lows where there will be a lot of stops beneath and we have the Daily ATR also. Looking for a failure around this area before longing to the FTA.
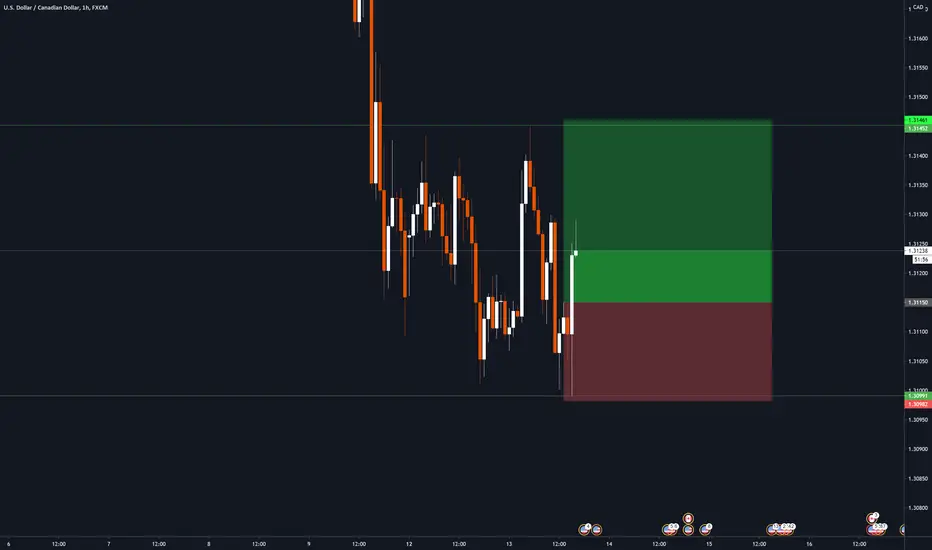
USDCAD Long opportunity So USDCAD 1-hour candle just closed as a bullish engulfing. Taking into account we just made a stop run to the downside, we are likely to accelerate to the next liqudity pool waiting above at 1.1345. What do you guys think about this trade idea?

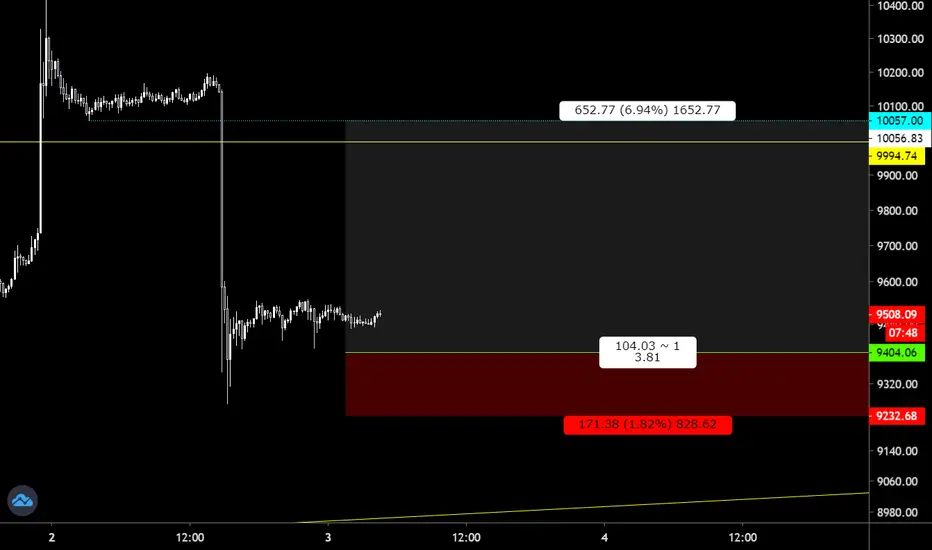
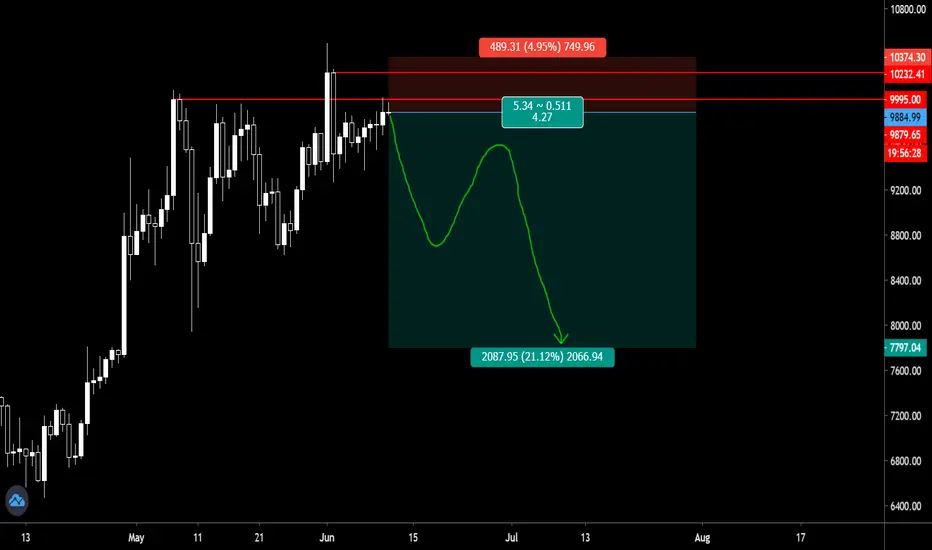
#Bitcoin - What's next? I am never gonna get my 10761 short entry filled, this has been my SUPER SWING for well over a month now
in my previous idea I mentioned we will see a Bearish diversion forming on HTF & finally we have it with amazing follow-through
I was waiting on daily candle close to enter in trade & with Cyclone warning in my city my head wasn't just in the right place , what I missed out in my analysis was FAKEOUT, that's what I am counting this as fakeout from our triangle on the upside to dump back down
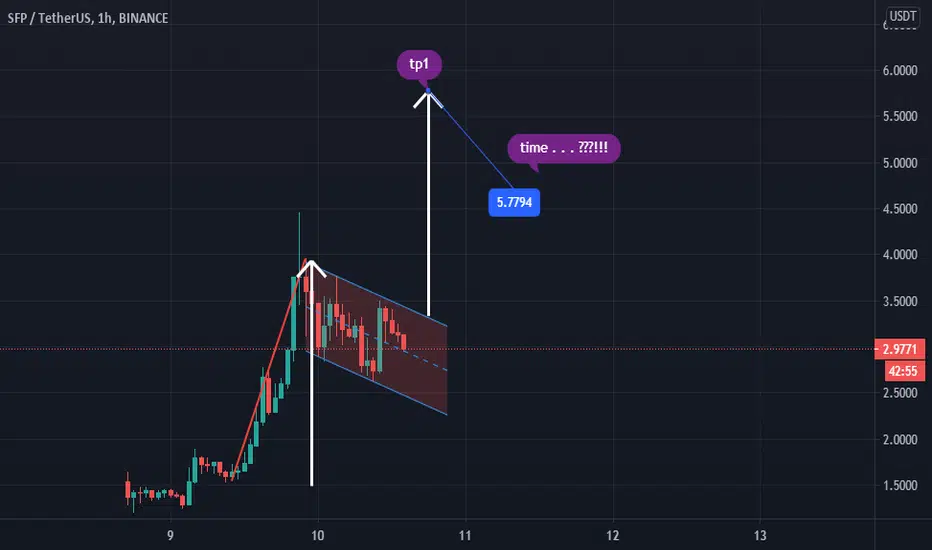
now here's what I am looking at current charts a possible BART (SFP)
we have liquidated shorts, stopped out most & taken out the previous highs, all we need is a retest & that's where I will risk short, I will take profits as mentioned on chart (TP)
My long-term triangle is not broken yet nor is my IH&S idea invalidated, we are at the résistance best will be to enter a short position & take profits at different levels as market gives us
inverse Head & Shoulder

#Bitcoin Swing short Bitcoin is being Bitcoin hence not trading it from the past week, wicks on both side Exchanges are the only ones making money, retailers are f**ked
entering a swing short position here on BTC with 2% account risk, looking at possible Super #Bart (#SFP) 3Drive is still valid
also, there is a possible H&S in the making, once we break the Mid support line on the parallel channel I will be more confident with it till then risk small as any trades here are PURE GAMBLE!!
#bitcoin - Bart it up v2#BTC will #BART
#BTC will #BART
#BTC will #BART
#BTC will #BART
#BTC will #BART
#BTC will #BART
#BTC will #BART
#BTC will #BART
#BTC will #BART
#BTC will #BART
#BTC will #BART
#BTC will #BART
#BTC will #BART
#BTC will #BART
#BTC will #BART
#BTC will #BART
#BTC will #BART
#BTC will #BART
#BTC will #BART
#BTC will #BART
#BTC will #BART
#BTC will #BART
#BTC will #BART
#BTC will #BART
#BTC will #BART
#BTC will #BART
#BTC will #BART
#BTC will #BART
#BTC will #BART
#BTC will #BART
#BTC will #BART
#BTC will #BART
#BTC will #BART
#BTC will #BART