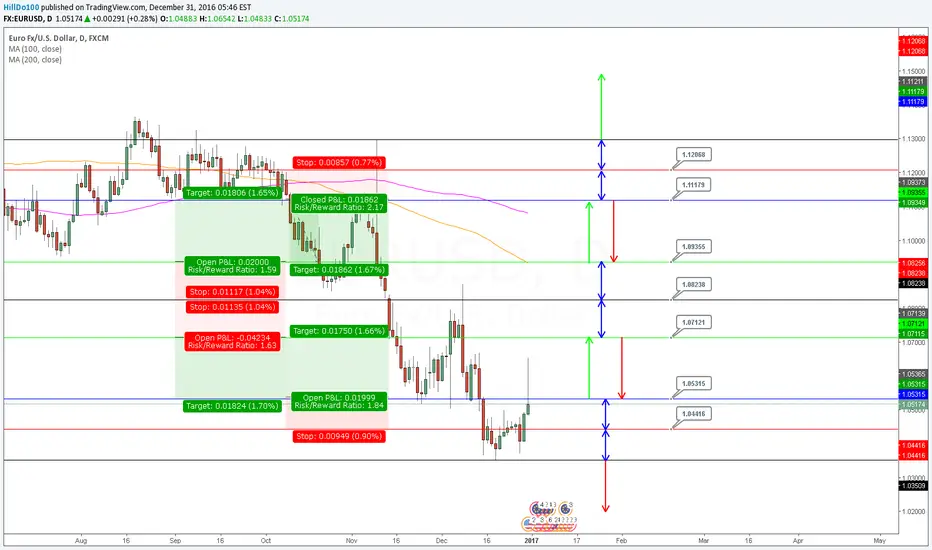
Next Weeks Trading Plan for EURUSDHere is my analysis for next weeks trading plan for EUR/USD
Overall the current trend is a Bearish Trend, as Price levels are below the 100 and 200 Simple Moving Averages that I have placed.
Since i never manage to place a Short Trade, it may be too late and the trend may come to an end :(
so I set up a Ranging Market setup which will help me determine if the trend will continue to go Bearish or have a reversal to a Bullish trend But if it ranges for the mean time, I hope to catch some good trades along the way.
A brief explanation of my analysis setup
The top and bottom Black Lines are the "Resistance" and "Support" levels that I have chosen to mark my trading area. The center black line is a 0.50 Fibonacci retracement level.
For the green lines they represent the 0.618 and 0.382 retracement levels respectively.
The blue lines are the 0.50 Fibonacci retracement levels for the 0.382 green line to the Black "Support" line and the 0.618 green line to the black "Resistance" line
The red lines are the 0.50 Fibonacci retracement levels from the blue lines to the Black "Resistance" and "Support" lines
The arrows on the chart shows the trade executions
Blue Arrows =Observation areas and Stop-loss areas.
Green Arrows = Areas for Long Positions
Red Arrows=Arrows for Short Positions
On the Left side of the chart,it shows the illustration of the Profit/Loss Ratio of the trades that will be made.
This setup also helps me determine trend formations. If price levels break through my "Resistance" it may signal a Bullish Trend and if it breaks through "Support" levels it signals a possible continuation of the bearish trend.
Sharing
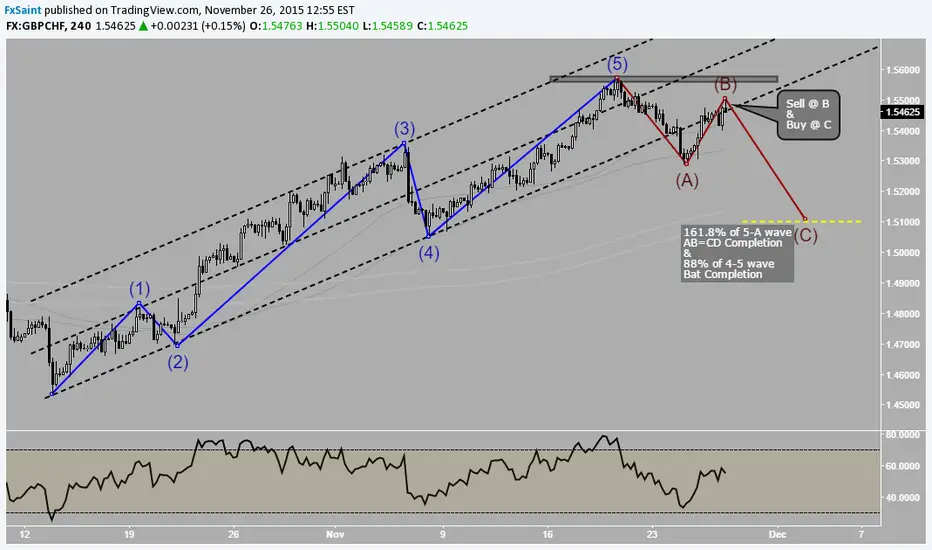
GChf - Elliot Wave // Harmonic Pattern // Study & Trade Have published sell trade on this pair already which is attached with this idea. However, wanted to make detailed price action explanation on this trade. Look how price behavior can be interpreted & anticipated ahead of times. Enough one have enough knowledge & practice then we can predict the price movement for certain degree. Now I know many wont subscribe to price prediction ideas, but for me it is possible.
This trade may fail or succeed but this makes a great study material & that too live example.
=)
Sell Reasons~
1] Completion of 5th wave & subsequent formation of A-B wave now anticipating completion of wave C
2] Trend Line break & retest
Buy Reasons ~
1] Completion of ABC wave of 5th wave
2] AB=CD
3] Bat pattern
4] 1.5100 BRN
Technical Analysis for beginners - Part 2In continuation of my earlier blog on Technical Analysis For Beginners (link attached below), today I want to pen down important detail on indicator, specially MOVING AVERAGE's (MA's) . Many many traders use different type of moving average in their trading strategy which makes it more important indicator compared to other indicators. Many people ask or doubt whether or not indicators work ? & specially moving averages ? Answer to that question is sometimes it works & sometimes it wont work. Now its upto trader to find out when it will work & when it will not. One way of finding that is by trail & error. I never use same MA's on my every screen on every pair. I run different setups with different numbers in MA to fit the price. MA should be dynamically fitted into price, when that happens we can establish whether here it will work or not ? (please refer the picture attached for clear understanding).
From the picture above you can see how I have managed to fit the MA in proximity of price in such as way that it provides support & resistance to price dynamically. Dont bother which MA or what period is used, because the truth is next time it wont fit in as clearly as it does now. The important thing here is trail & error, the only way to find the dynamically fitting MA.
So secret technique I use is, I start with 25 period SMA & then 30 period SMA then 50 period SMA then 50 period EMA then 100 period SMA on low in uptrend & high on downtrend, so on so forth with different numbers till I feel it dynamically supports or resists price from moving. So next time, be the little researcher yourself when you think of making use of MA & dont settle for famous 100/200 period SMA or EMA. Instead try to experiment & play with different period & different kind of MA & see how it fits into price of different pairs. Hope this information will help you & thank you for taking time to read this long.
Happy trading.
Cheers!