There is two possible scenarios for Shiba InuScenario NO.1: In this scenario, Bitcoin and cryptocurrencies work well in the same way, and Shiba Inu continues its positive activity under the skin and breaks the resistance of 0.00001055 and goes to the next resistance.
Scenario NO.2: Bitcoin and cryptocurrencies will reverse their positive advance and Shiba Inu crypto sellers will increase in proportion and then close to the 0.00000832 support.
As you can see, the Sar and MACD indicators are showing a weak upward trend at the moment, so the price will probably rise to the range of 0.00001055.
Shib

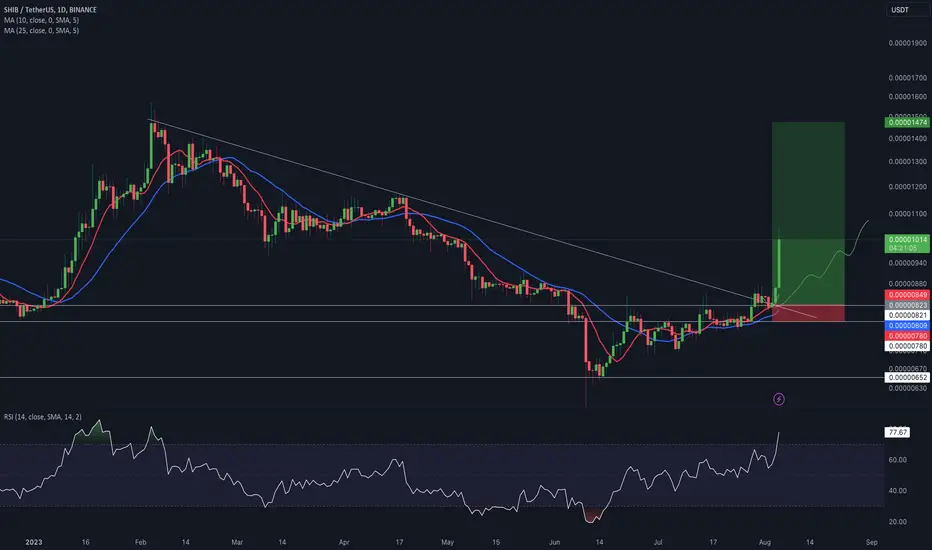
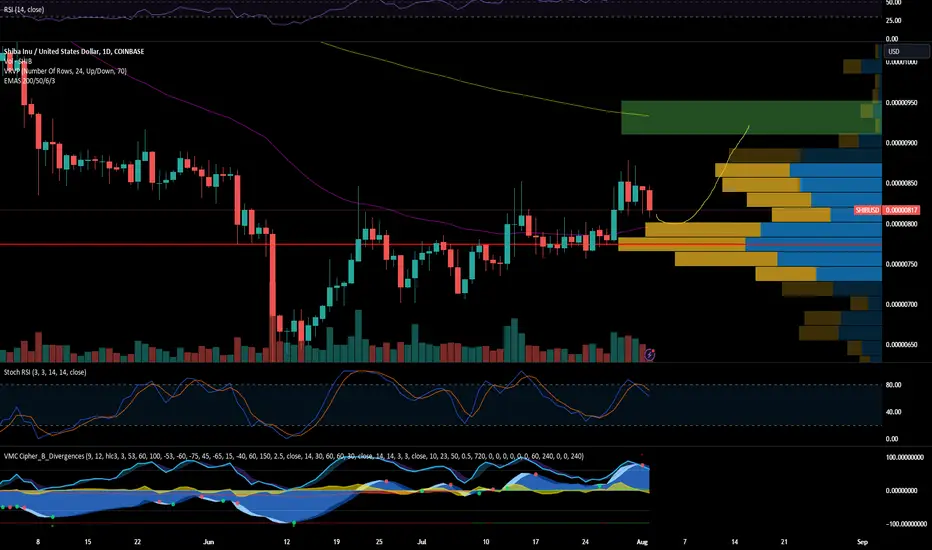
SHIB: Pullback in UptrendShiba Inu (SHIB) technical analysis:
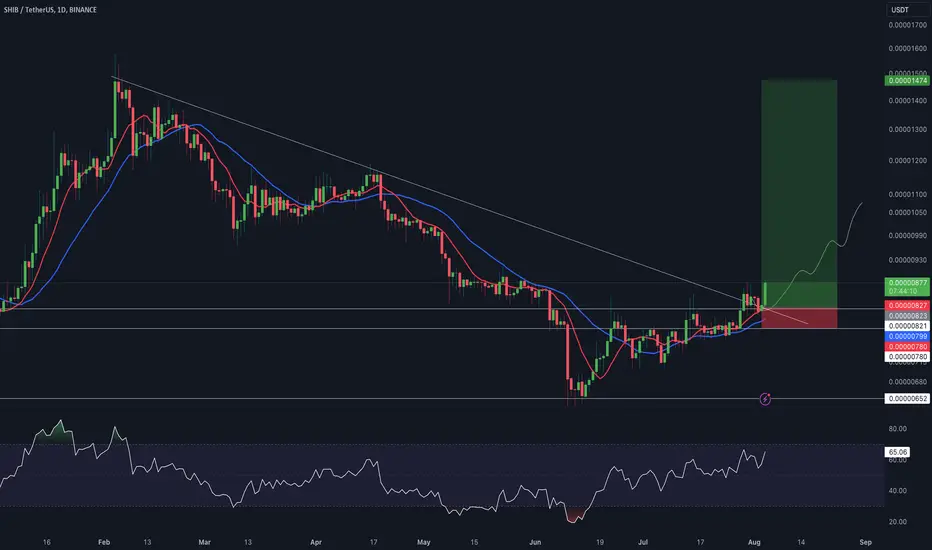
Trade setup : Bullish breakout from Ascending Triangle and above $0.000008 resistance could signal possible trend reversal. Price reached our target of $0.000010 resistance, which is also 200-day Moving Average, where it got rejected. It is now likely to pull back to retest the breakout level of $0.000008. That could be an attractive swing entry again.
Pattern : Ascending Triangle which is a continuation pattern (it typically breaks out in the direction of existing trend). Most traders wait for a breakout but Swing traders could trade between the trendlines (Buy at Support, Sell at Resistance) as long as the trendlines are still relatively far apart.
Trend : Uptrend on Short- and Medium-Term basis and Downtrend on Long-Term basis.
Momentum is Bullish but inflecting. MACD Line is above MACD Signal Line and RSI is above 55 but momentum may have peaked since MACD Histogram bars are declining, which suggests that momentum is weakening.
Support and Resistance : Nearest Support Zone is $0.0000080 (previous resistance), then $0.0000055. The nearest Resistance Zone is $0.0000100, then $0.00001200.

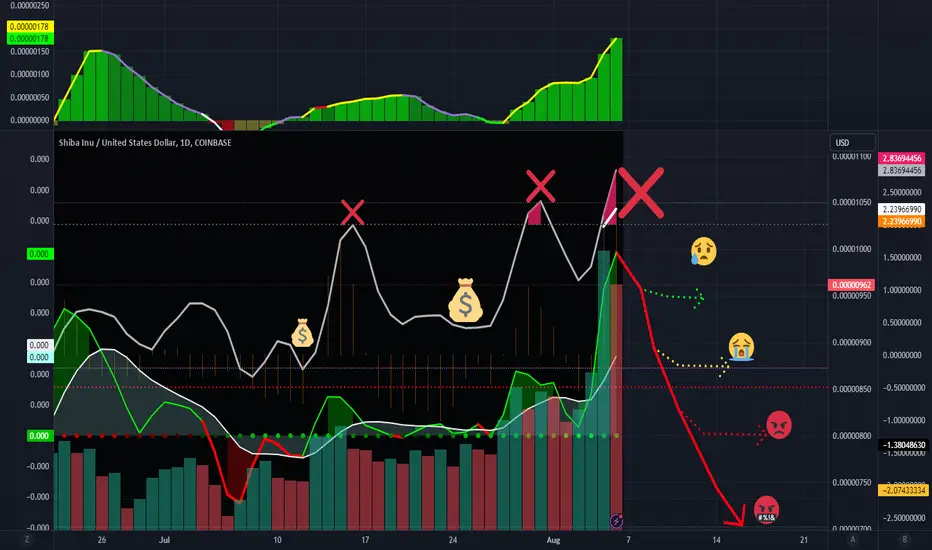
Trading Lesson 👨💻#1 - Never buy At the peak high.Not worth it I tell you.
Never buy at the peak high.
Always buy at the peak low.
When ever you see a peak in the day of trading and you had a major rise in price due to things such as rallies or market seasonal up trends, or 🐳 it's moving up and you don't want to miss it. However; you buy in on the rush up-word believing it's safe to assume things will be greater tomorrow, so you wait to see this awesome rally to the top to make it rich.
The day closes and the reopens, with a rise and then sudden fall in the crypto market - all that hype only to be disappointed when you notice somethings off; your funds are 💸floating away in mere moments. So naturally you panic believing that you are in a complete crash - and assume it's the fault of the stock you purchased, but more over it was the fault of the bad call - with bad timing, so you panic sell thinking it will only get worse, and in some cases it does get worse but in others cases that sell you just made would be a mistake in judgement as the price goes back up from where you sold leaving you behind with the lost funds to ponder over.
This is what I call "fools gold"
Never buy at the peak on after a closing day.
reason being you may on the next day after a rally up-word, you notice the price move up higher for like a moment prompting you to buy, thinking that the rally is still going, however; not realizing that was the last call before the fall.
So the best thing to do in these type of situations is to:
_______________________
Don't Buy In
Safer to study your target market before you buy and wait for the closing day, so that it can either adjust the price to where it really is vs where it currently is. if it drops wait till the closing day again until you feel you have the best price to turn a profit. Note - pay attention for market trends it could be going up which is good or falling down which is still good for you because you didn't lose any money, so best to study before you buy on a hype.
_______________________
Hold
Wait until the next closing day to see where it might lead - this will keep your shares you already purchased and if you need to add more funds to regain what you lost when the price is lower than expected, it will likely turn what was a lost to a gain when the price returns to where you originally purchased.
_______________________
Sell
The worse thing you can do is Sell unless you can catch the drop in price before it takes too much profit to recover from, you will likely try again losing more money and again, and again, and again - creating what is known as panic buying and selling, if you had deep pockets it might cause the market to completely drop based off the factor of you panic selling, no need to do so you have a day to find out where the market for your crypto is headed before you sell, so best to work fast or lose more funds wasting time.
Focus and don't risk what you are not willing to lose, and for your own sake if you are a panic seller, never day trade, you'll lose more money that way.
_______________________
Best Tools to use
Notice the market trends on the charts before you buy, was it going up throughout a one month process if so then it's a likelihood it's in a seasonal high, it's sometimes hard to tell if it's moving up or down just by looking at charts, so you will definitely need proper indicators to help identify your next move.
Indicators like:
Volume to price
or
trend activity
Not chart savvy, then find a predictor of your current crypto you purchased.
Look for people on places like trading view who have the tools and or knowledge to tell you the trading trends - note not all of them are accurate - not even some websites that offer predictions for your favorite stock or crypto are accurate either, they are usually 40% accurate 60% inaccurate and 99% bias.
That's just my opinion - however; they can not predict Rallies - Whaling activity - or - the entire stock market fallout/rise - anything can happen so be prepared it can take months if not years to recover or it could take a few weeks if you know what the future may bring.
But remember:
Don't try to buy in at the tip of a peak.
It's guaranteed to drop instantly the next trading day.
Hope this helps.
Happy trading.
CRYPTOCAP:BTC
BINANCE:BTCUSDT
BITSTAMP:BTCUSD
CRYPTOCAP:ETH
BINANCE:ETHUSDT
CRYPTOCAP:SHIB
BINANCE:SHIBUSDT
COINBASE:SHIBUSD
#CRYPTO
#ALTCOIN
#EVERYCOIN
#RALLIES-WE-LOVE-THEM
#HELP-WITH-A-RALLY
#NEED-WHALE-SUPPORT
#STOP-THE-DIP
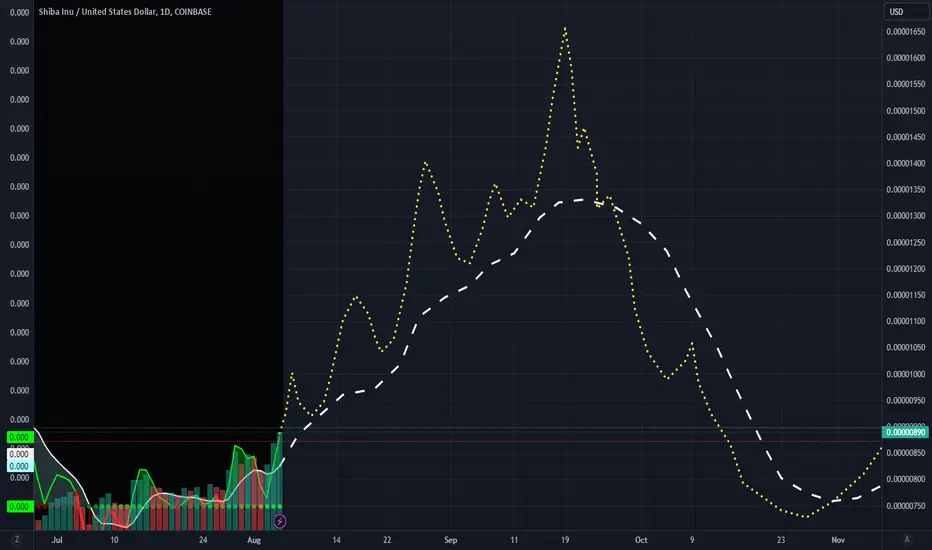
Shib Prediction for August 2023This is a weekly chart of the possible path shib may take leading to the end of August 2023 after the recent rally. This is to help those that are wondering where it may go even on times of downturns so there won't be any worry or need to panic sell when it drops in price, note this is not 100% and can change depending on the situation. As Shib long as it has support it has a chance to go higher than what you see here.
If we can gain a rally then we can gain higher returns.
CRYPTOCAP:SHIB
COINBASE:SHIBUSD
BINANCE:SHIBUSDT
SHIB/USD 1DAY UPDATE BY CRYPTO SANDERS !!Hello, welcome to this SHIB/USDT 1DAY chart update by CRYPTO SANDERS.
CHART ANALYSIS:-Shiba Inu (SHIB) jumped to a three-month high on Saturday, with prices surging by as much as 10%.
Following a low of 0.000008551 on Friday, SHIB/USD surged to a peak of 0.000009509 earlier in today’s session.
This resulted in the meme coin climbing to its strongest point since May 6, when the price reached a high of 0.00001007.
the move comes as the 14-day relative strength index (RSI) moved past a resistance level of 67.00.
the index is tracking at 73.62, which is its highest level since February.
Should momentum continue throughout the weekend, the next target for bulls is likely to be a ceiling at 0.00001025.
This is not a piece of financial advice.
Hit the like button if you like it and share your charts in the comments section.
Thank you
Shiba Inu bullish momentum building? 🚀🔥Shib today analysis 💎SHIB is currently making some fascinating moves, bouncing back from the support provided by the intersection of the horizontal and uptrend lines.
💎 Another observation is that it has faced rejection from the EMA 50 twice. The uptrend could potentially kick off before encountering a 10% EMA 50.
💎 The RSI being below 50 indicates that bears still have a hold on SHIB's price and could easily regain control if the bulls falter. If this occurs, the resulting selling pressure could push SHIB downwards.
💎In the dynamic world of crypto, staying informed and adaptable is key. Stay tuned for more updates and enjoy your trading journey

SHIBUSDT, in accumulation phase and is getting ready🦬 UpdateHello guys, Everything is explained on the chart for you like always. Shiba has been in trade range and heavy accumulation after the decreasing phase, so the ascending phase will start soon. You can consider it and monitor the price's actions in the circles to enter or increase your Shiba tokens.
Good luck.
If you like the idea, do not forget to support with a like and follow me for next analysis :)
Write your comment and opinion below to me
.
Salam doostan aziz, hame chiz rooye chart moshakhas shode be dide sarmaye gozari boland modat baraye harkat soodi movaghate market. Shiba baad az ravande nozooli dar ye nahiye reng va anbasht sangin gharar dard va bezodi faaze so'odi ro shoro mikoneh. dar zaman rizeshe bazar raftar gheymat dar dayere ha ro rasad konid baraye vorode jadid ya ezafe kardan be Shiba hayetan. lotfan modiriyat sarmaye va hade zarar baraye har etefagh dar bazar ro ra'ayat konid.
moafagh bashid.
like va follow faramoosh nashe :)

SHIB ANALYSIS (1D)Hi, dear traders. how are you ? Today we have a viewpoint to BUY/LONG the SHIB symbol.
For risk management, please don't forget stop loss and capital management
When we reach the first target, save some profit and then change the stop to entry
Comment if you have any questions
Thank You
SHIBA INU Possible Scalp LongI think it's possible for SHIBA to come down just slightly then run up to the next liquidity zone just above us. Not financial advice, DYOR
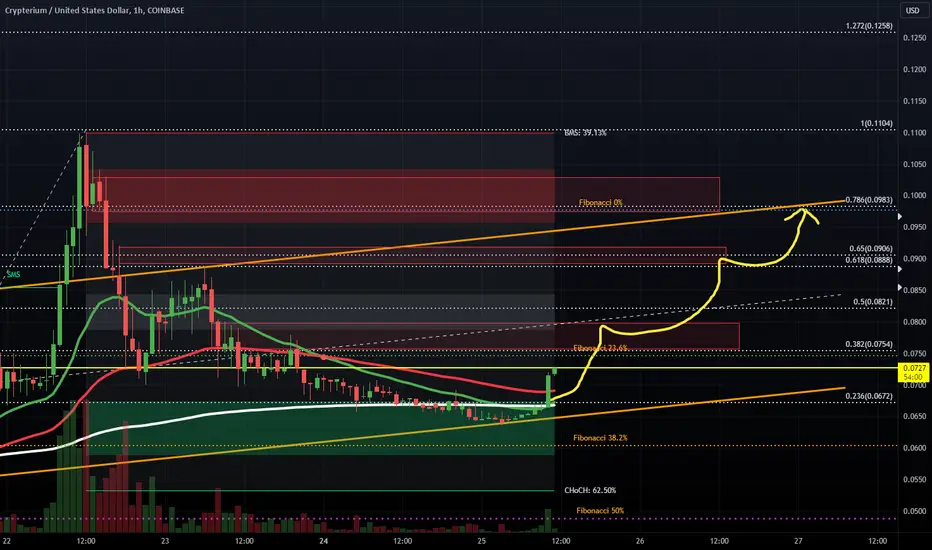
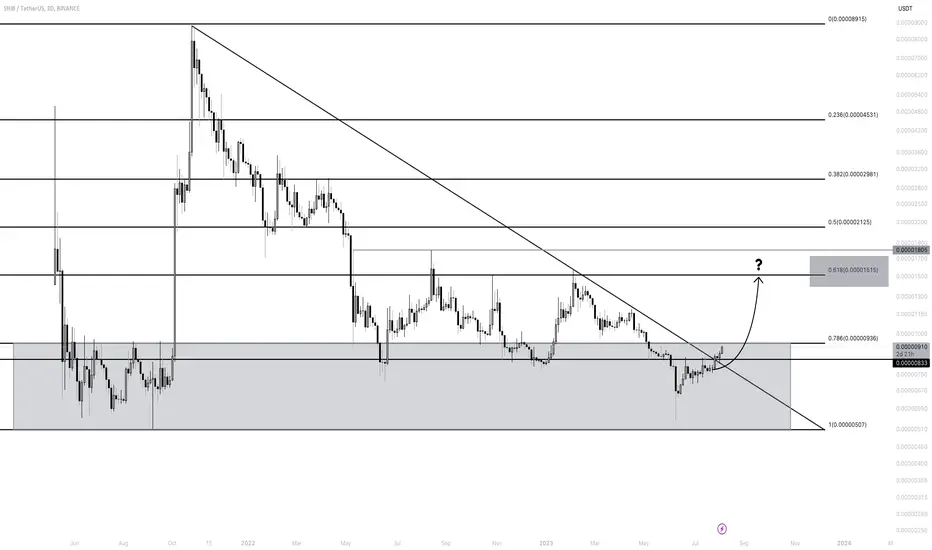
SHIB - breaks the global countertrend line!!!Hello trader! Today I have a new idea for you. Like and subscribe to the channel, there is a lot of useful information.✅
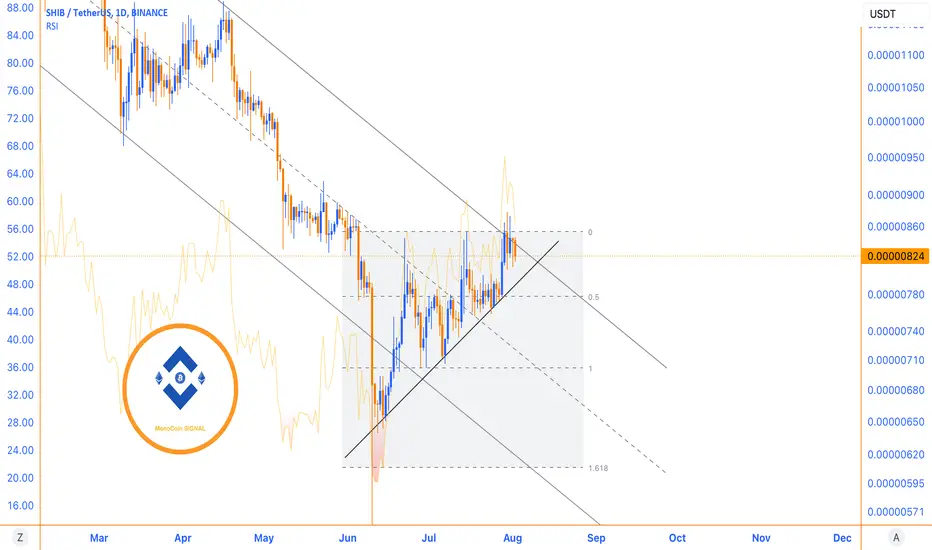
After a local accumulation of 1.5 months, SHIB broke through the global countertrend line and the asset has already managed to gain a foothold higher.
The nearest strong resistance level is 0.618 Fibonacci on the global 3D chart.
From the technical side, it looks super-positive, well, since I am waiting for a correction in BTC, maybe we will see downward movement under the trend line again, so here fifty-fifty friends, well, there is an option that the asset will go against the trend, i.e., BTC will fall and SHIB will stand in one place or go up :) Be careful friends;)
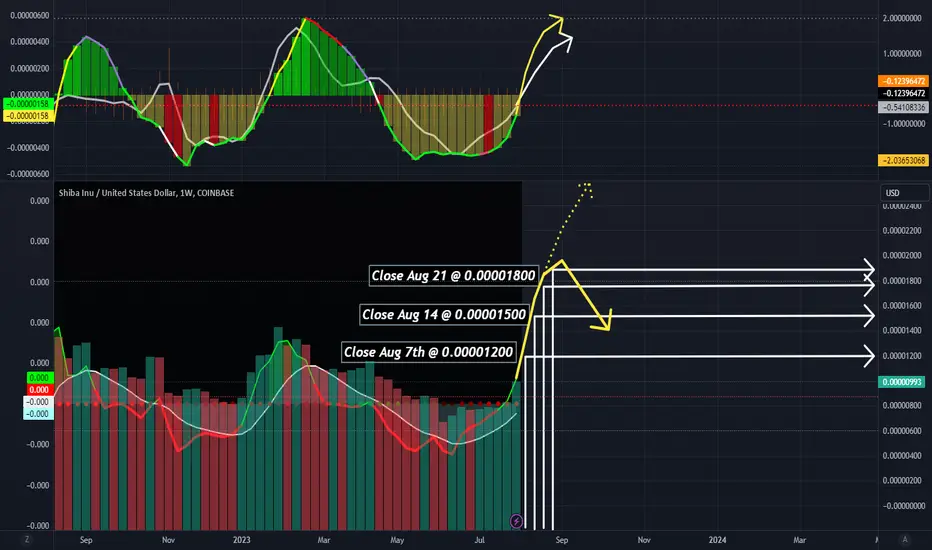
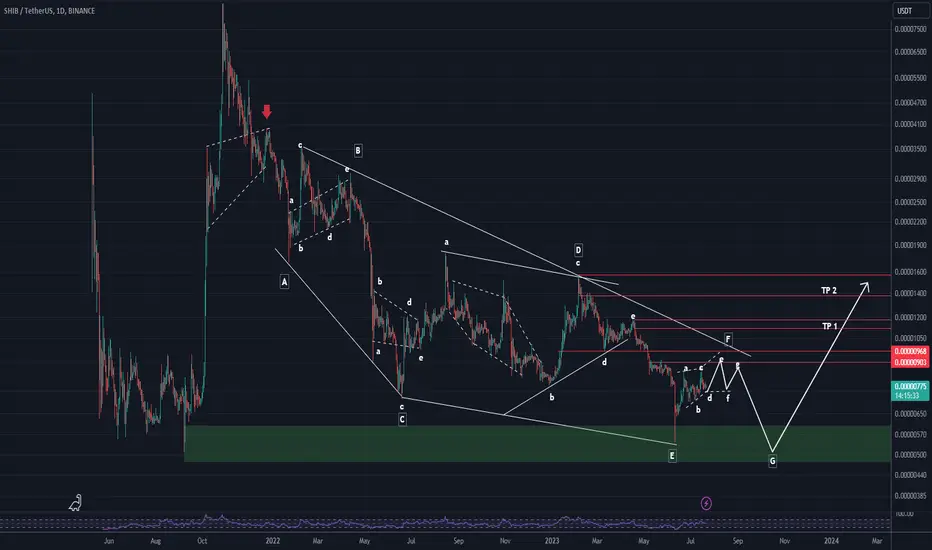
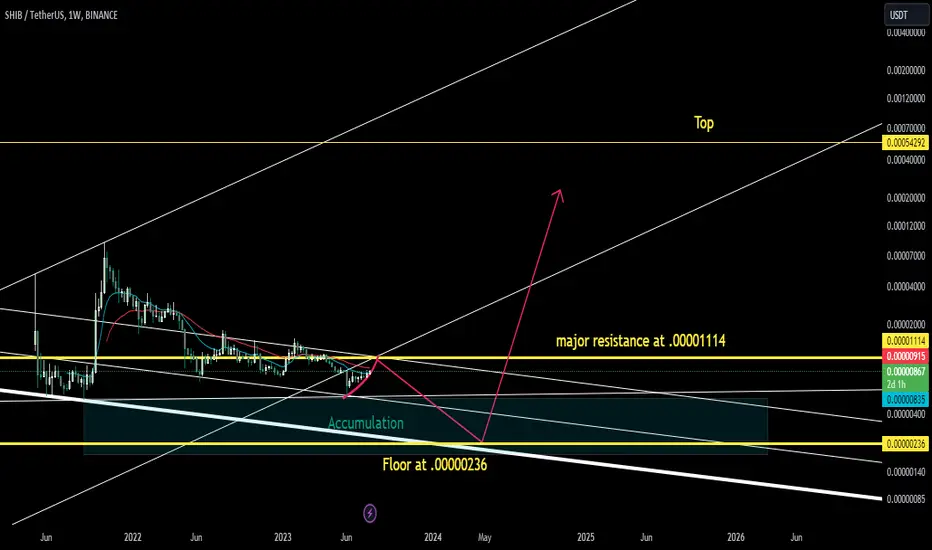
Shib inu 2023 closingShib inu expectation for 2023 closing - It's going up, due to the recent activity of Shib inu and the expectation for the coming month I forecast that it's going to be a bumpy ride but a well worth ride none the less, Started the 3rd of August and expected to rise to the 0.00001700 falling back down on 20th of September and declining all the way to October - Shib will have a open window for Highs, best set your sell off for those said points mentioned.
Shib Weekly Looking at the Weekly #Shib Chart as you could see i have marked my floor level my major resistance and my top.
long SHIBCRYPTOCAP:SHIB broke through the major resistance level on the daily chart. Bullish movement to resistance level at 0.0000115$ is likely to happen.
SHIB/USD 1DAY UPDATE BY CRYPTO SANDERS !!Hello, welcome to this SHIB/USDT 1DAY chart update by CRYPTO SANDERS.
CHART ANALYSIS:-Shiba Inu (SHIB) rose by over 5% on Friday, on the news that Binance was adding the asset to its Flexible and VIP Loan services.
SHIB/USD hit an intraday peak of 0.000008677 on the news, a day after trading at a low of 0.000008226.
The move resulted in the meme coin hitting its highest point since Monday when it peaked at 0.00000872.
One of the catalysts for the surge also seemed to be a breakout of the 60.00 level on the 14-day relative strength index (RSI).
the index is tracking at 62.20, which is marginally below a higher ceiling of 63.00
Earlier gains have already eased, with traders likely securing profits in anticipation of a collision with this zone.
This is not a piece of financial advice.
Hit the like button if you like it and share your charts in the comments section.
Thank you
Support Holds Amidst Static ResistanceSHIB has maintained its support level and made progress towards higher resistance, specifically in the range of $0.00000870-$0.00000850. However, within this range, the price encountered resistance and paused its upward movement. Despite this, the previously identified support level for Shiba remains intact.
The reason for the current sideways movement in the Shiba trend for the past five days is due to the presence of static resistance and the breaking of the descending channel's ceiling support. It's worth noting that the break of the channel's ceiling support is yet to be confirmed, leaving a possibility for the price to return to the support level around $0.00000750.
If the dynamic support is breached, it could potentially lead to a further decline in the Shiba price, possibly towards the midline range of the descending channel.
Regarding the RSI level being at 57, an RSI (Relative Strength Index) value of 57 indicates that the asset's price is neither overbought nor oversold.
$SHIB Long into Shibarium Launch Mid-August
Ascending triangle breaking upwards
Breaking out of >600 day down trend
Flipping 3x long MPL into support
Flipping 3:1 risk/reward level into support
Flipping 1x short MPL into support
Target is MPL and RR cluster at ~0.000001000

SHIB/USDT Technical Analysis ( 10x Potential or Not ?SHIB/USDT Technical Analysis CRYPTOCAP:SHIB
Chart Analysis:
SHIB is attempting to break the resistance line, but the breakout has not been confirmed yet. 50 EMA has experienced a breakout, but it is still trying to close above the 50 EMA.
Key Levels:
Strong Support: $0.00000770
Resistance: $0.00000900
Potential Upside:
If breaks the $0.00000900 resistance level, we may witness an upward rally.
However, a retracement of 20-40% could be expected before the potential rally.
10x Potential in Next Bull Run:
While SHIB may offer significant gains, it's crucial to exercise caution. Meme coins like SHIB are known for their speculative nature and high volatility. Never go all-in on such coins, especially for long-term holdings.
Risk Warning:
Meme coins are considered "Zero to Hero" coins, characterized by extreme price swings. Always do your own research and diversify your investment portfolio to mitigate risks.

SHIB LongI expect SHIB will continue the current uptrend, trading within the channel at least until it reaches 0.000..08822
$BOUNCE Found Bottom. Long incoming. Seems $BOUNCE has found it's bottom. We hope. If breaks up. This is the route it should take. Good luck.

SHIB/USDT 1DAY UPDATE BY CRYPTO SANDERS !!
Hello, welcome to this SHIB/USDT 1DAY chart update by CRYPTO SANDERS.
I have tried to bring the best possible outcome to this chart.
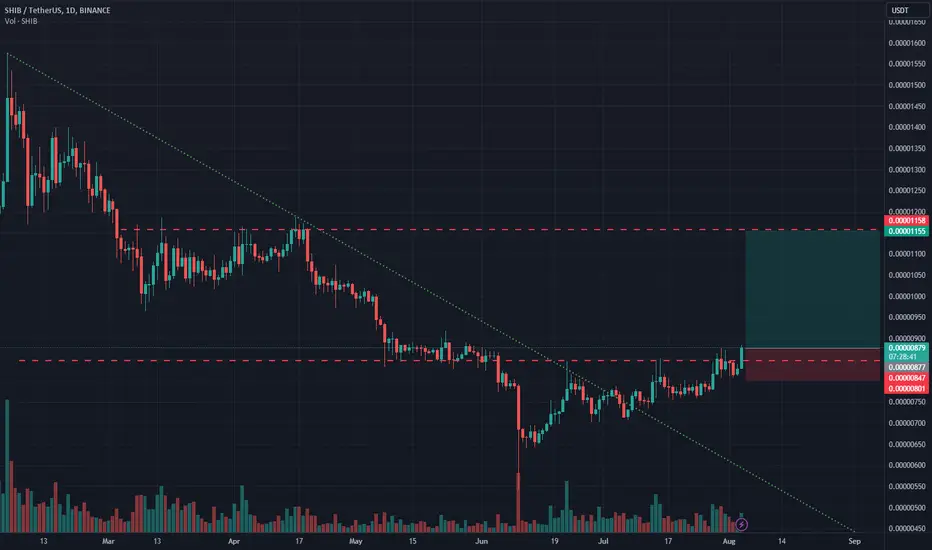
CHART ANALYSIS:-Shiba Inu (SHIB) rallied to a two-week high on Friday, after breaking out of a key resistance level.
SHIB/USD surged to a peak of 0.000008217 earlier in today’s session, following Thursday’s low at 0.000007754.
Friday’s move came as shiba inu broke out of a key resistance level at the 0.000008000 mark, hitting its highest point since June 15 in the process.
Another reason for today’s action appears to be the relative strength index (RSI) moving above a ceiling of 55.00.
Currently, price strength is tracking at the 60.09 level, which is marginally below a ceiling of 61.00.
Should the Bulls manage to race past this point, there is a good chance the next target price will be 0.000008500.
This is not a piece of financial advice.
Hit the like button if you like it and share your charts in the comments section.
Thank you

Next period of volatility: Around August 6thHello?
Traders, welcome.
If you "Follow", you can always get new information quickly.
Please also click "Boost".
Have a good day.
-------------------------------------
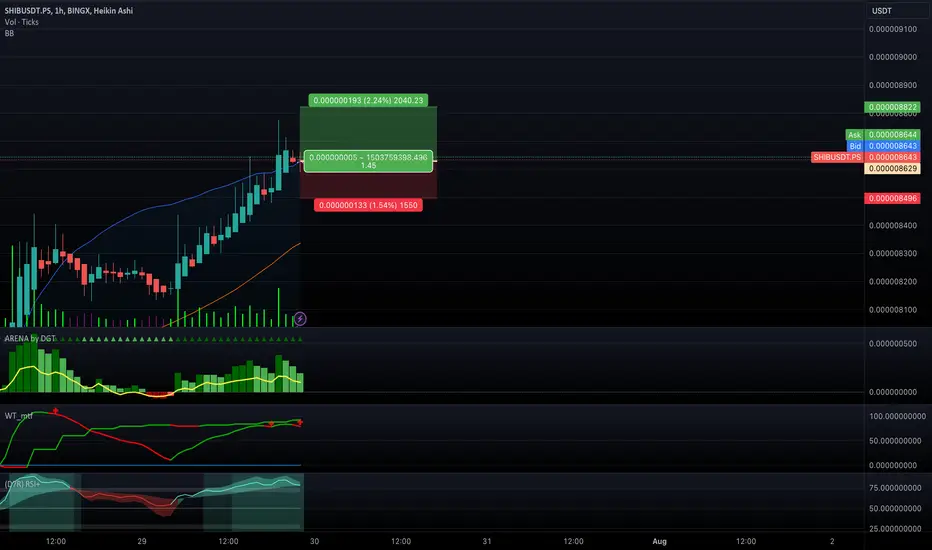
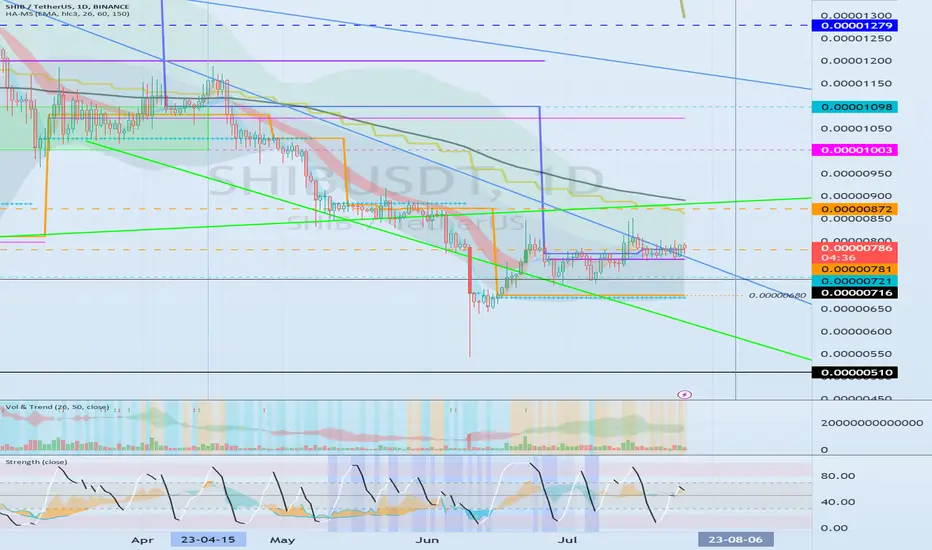
(SHIBUSDT chart)
The key is whether it can be supported in the 0.0000 0781 ~ 0.0000 0872 section and rise to around 0.0000 1279.
Since the 0.0000 1279 point corresponds to the HA-High indicator point on the 1W chart, if it rises above 0.0000 0872, it is likely to rise to the vicinity of the 0.0000 1279 point, the HA-High indicator on the 1W chart.
The next period of volatility is around August 6th.
Since it currently sits near the HA-High indicator on the 1D chart, if it falls below 0.0000 0781, it is likely to touch the HA-Low indicator on the 1D chart.
So, if it falls below 0.0000 0781, it is important to find support around 0.0000 0716.
---------------------------------------------------------------------------------------------
** All descriptions are for reference only and do not guarantee profit or loss in investment.
** Even if you know other people's know-how, it takes a considerable period of time to make it your own.
** This is a chart created with my know-how.
---------------------------------
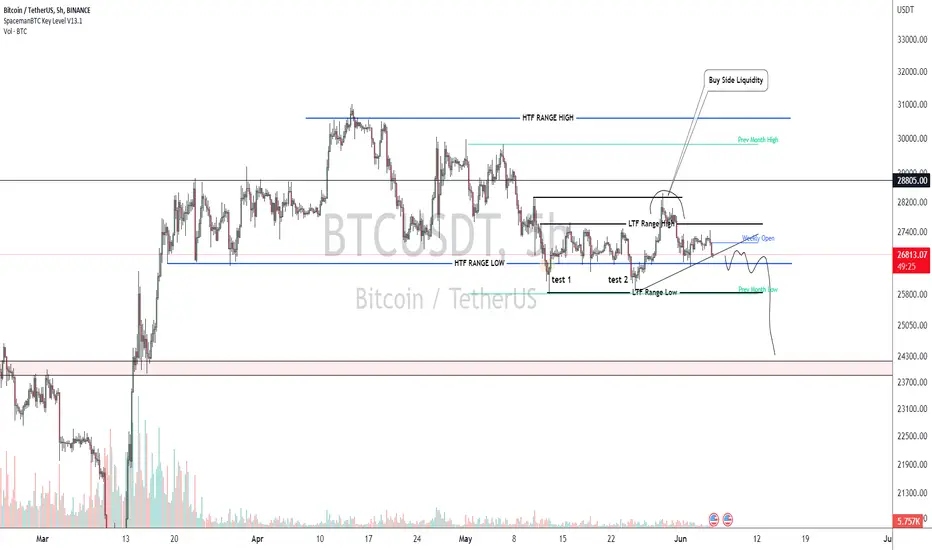
BTC ShortGoing to get real UGLY when this thing breaks down,
CRYPTOCAP:BTC #ETH CRYPTOCAP:BTC
Two tests of lower HTF Range low,
Lower time frame Buy side liquidity has already been raided.
Price looking for Sell Side liquidity ??
$CRPT Looking LONG! ***If*** AMEX:CRPT then we should expect .1!!!! Been a long time for a retrace. Over due.