ShibaInu SHIB price at critical zoneJust look who decided to wake up - it's our sweet #ShibaInu
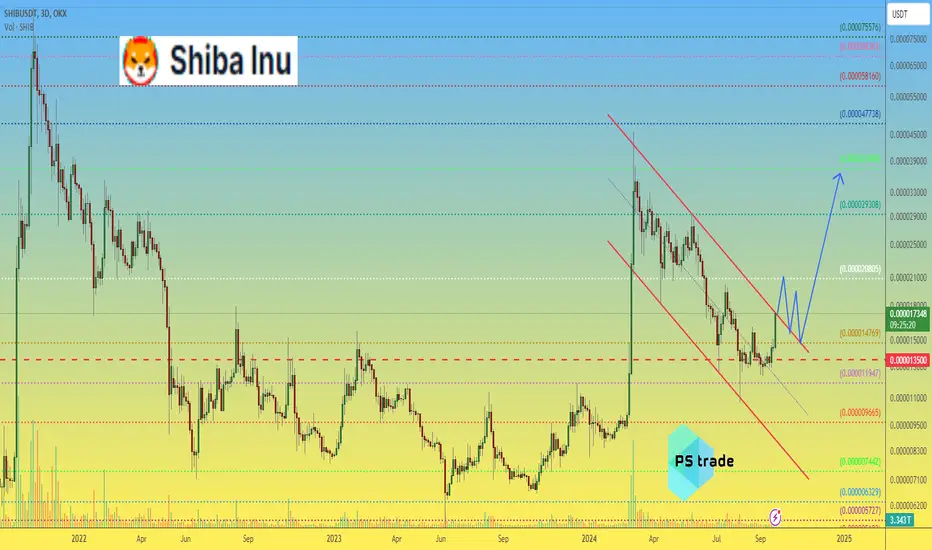
CRYPTOCAP:SHIB price is near the upper boundary of the falling channel, it can break through to $0.000020-0.000021
But a safe medium-term purchase, after the OKX:SHIBUSDT price breaks out and fixes outside the channel and closer to $0.000015
This is depicted schematically with a blue zigzag)
_____________________
Did you like our analysis? Leave a comment, like, and follow to get more
Shib
Alikze »» Dogs | Descending channel🔍 Technical analysis: Descending channel
- It is moving in a descending channel in the 4H time frame.
- Due to the fact that there is a demand in the middle of the channel, this movement can continue up to the ceiling of the channel.
- At the top of the channel, if there is a correction and a soft landing up to the green box range, it will have the ability to grow up to the specified areas by creating demand again.
💎 Alternative scenario: in case it faces selling pressure after hitting the ceiling of the channel and this selling pressure continues sharply, it will lead to the failure of the middle range of the channel and the green box will not be able to hold the price and it can The broken move towards the downward targets and the bottom of the channel until the range of the second green box.
»»»«««»»»«««»»»«««
Please support this idea with a LIKE and COMMENT if you find it useful and Click "Follow" on our profile if you'd like these trade ideas delivered straight to your email in the future.
Thanks for your continued support.
Best Regards,❤️
Alikze.
»»»«««»»»«««»»»«««
BINANCE:DOGSUSDT

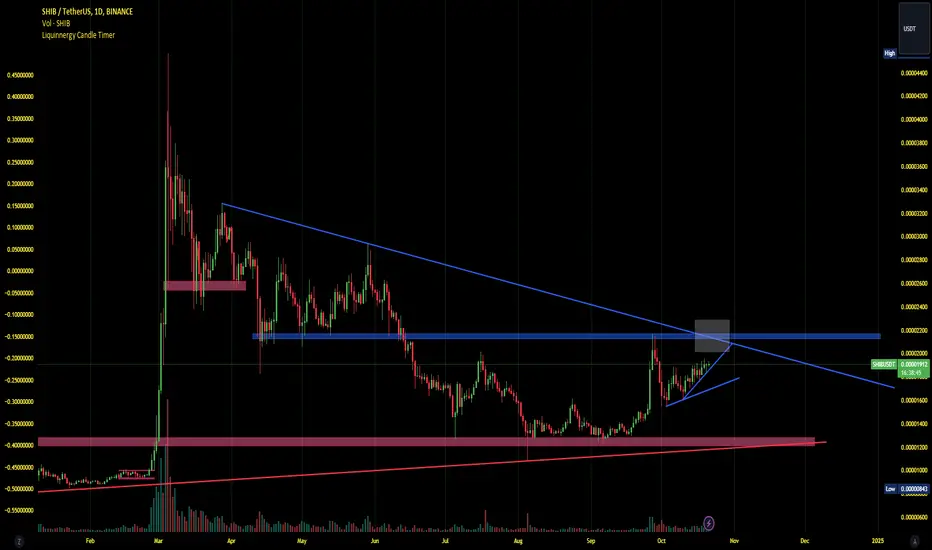
Should we buy #Shib or wait?The specified area is very important and vital for #Shiba, if this area is not broken, the price will have a sharp fall, if this level is broken, it can also bring a strong price growth. If you haven't bought Shiba yet, wait for it to cross the trendline and resistance level. If you already have Shiba, you can cross this zone with the risk of freeing.
Overall, this area is very important, and I think the price has been deliberately kept in these areas so that if the Bitcoin situation remains positive, Shiba will also break this level and prepare to conquer higher prices.
#shib
Doge - 4H correction phaseBINANCE:DOGEUSDT Doge has completed a 40% rally in just a few days, grabbing liquidity above a key high. Now, we can expect a pullback from this resistance zone. Keep an eye on price action for potential corrections.

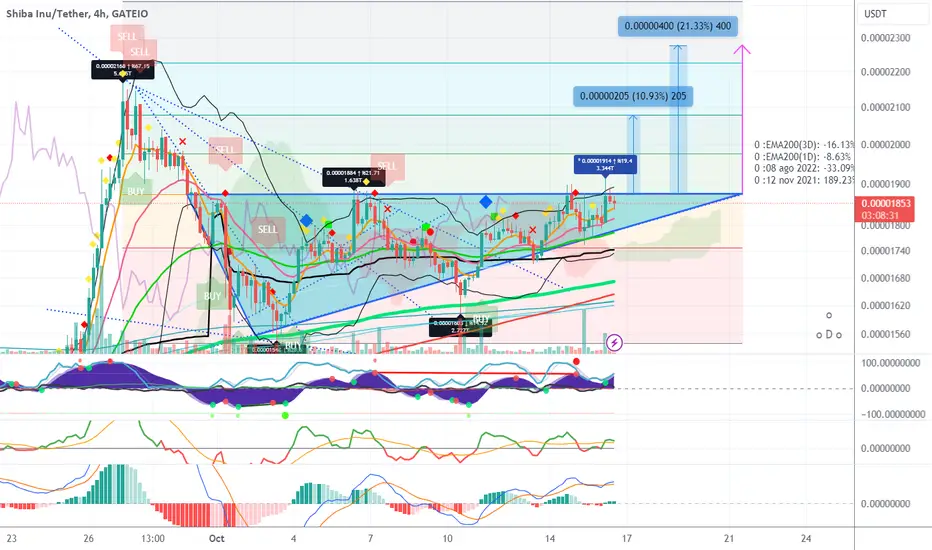
Ascending triangle on SHIB last week can give 21% next daysSHIB if forming a ascending triangle since start of October;
From breakout at least 11% gains according to Fibonacci levels, but according to triangle target, can reach 21% (purple arrow shows triangle target)!
SHIBA INU SHIB possible BREAKOUT SOONChart Request on today's show
#shib with a Plan A / Plan B
best price would be to scaling into the trade
... add to entry in the Buy Zone ...
safer entry would be the
break of newly created resistance
(in the Buy Zone)
Market Cap 10.66B
MEME
Not Financial Advise - Entertainment Purpose Only
Always DYOR ( do your own research )

SHIBUSDT Breakout on SupportHere we have identified a breakout on support which can be expected to drop down further with the ongoing bearish sentiment. Look over the price action below the highlighted support for a possible short entry.

DOGECOIN MAJOR BUY ZONE INCOMING AND POTENTIALLY LOWER?Here's the important numbers for doge at the moment.
You can adjust them a bit for your needs.
There is some really short term indicators that, when reset, put everything in alignment to see a lot of bullish movement coming into DOGE.
Again, because the market is the market it can easily break through this strong trend it's about to hit.
Good news is it falls to support at .0888
Even better news, should it fall more, there is support at an even lower level, likely.
I'd be looking to see if I can get my position set soon.
I think there is a bullish future for this good dog.
Watch SHIB for a bigger move to the upside, with a drop that would be to basically zero.
Doge has the support to take it up to .29 and maybe even .45, and as quick as dogecoin can confirm a jump like that, you'll see it at probably $10.
I've been consistently super bullish on this coin, and currently, I'm liking the look of the chart.

SHIB 25-28% Gains imminentAccending triangle formed,
support formed at .1706+- level,
Needs to hold over .1720 +- over the next day or so and continue up the trendline.
Resistance at .1840 level,
Second key level of resistance at .2000,
Target price .2100
Timeframe over the next 10 days,

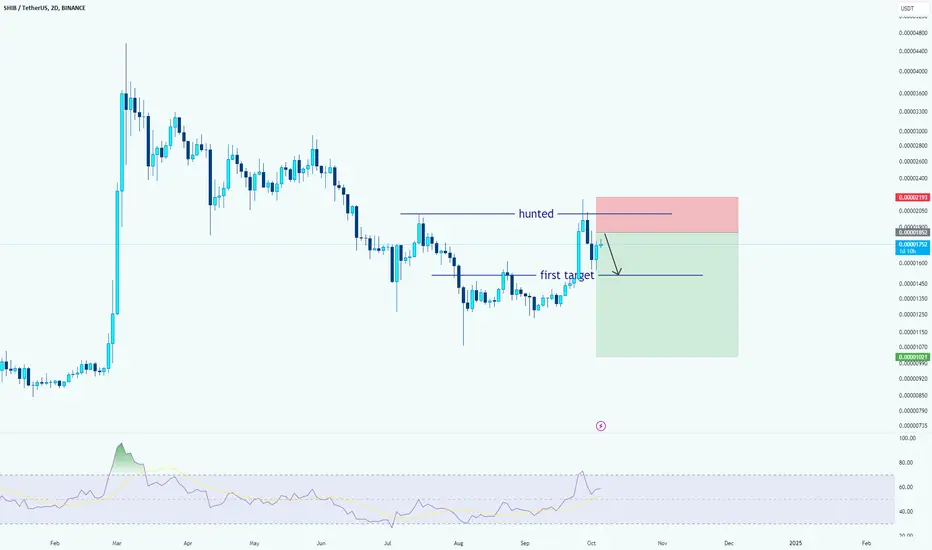
shibusdt → a short positionhello guys!
I suppose Shiba hunted the last level!
it is a risky position but I will sit on the short position for this situation!
___________________________
✓✓✓ Always do your research.
❒❒❒ If you have any questions, you can write them in the comments below, and I will answer them.
❤︎ ❤︎ ❤︎And please don't forget to support this idea with your likes and
PEPE BULL to ...0198It appears that if Bitcoin does not enter a bearish phase, we will experience an altcoin season, presenting optimal long entry opportunities with minimal stop-loss requirements.
Therefore I see PEPE doing a 120% move up

Wif Bullish to $6.20It appears that if Bitcoin does not enter a bearish phase, we will experience an altcoin season, presenting optimal long entry opportunities with minimal stop-loss requirements.
Therefore I see WIF going to $6.2

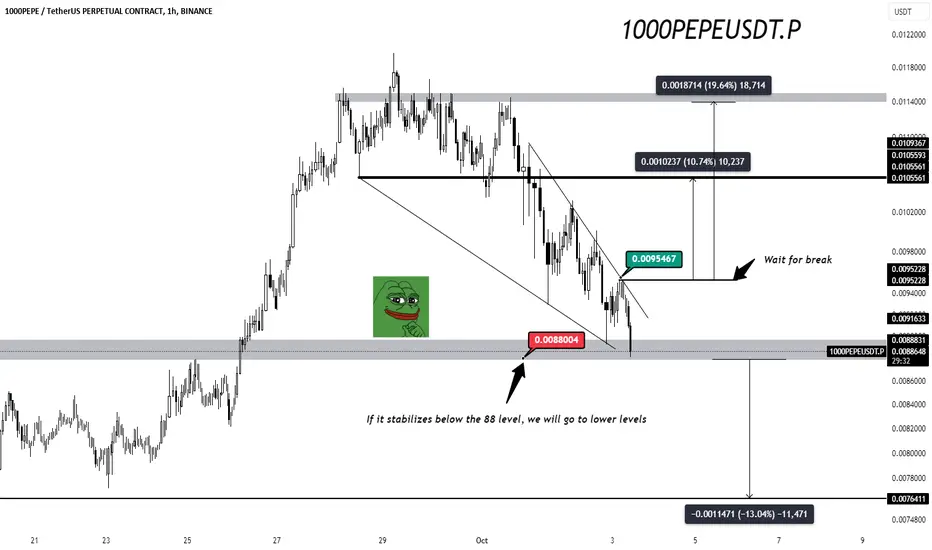
PEPE forecast price🐸 1000PEPEUSDT.P Technical Analysis:
We’re currently at a critical support level around 0.0088004 📉. If price stabilizes below this area, expect further drops to the 0.0076411 zone, marking a potential 13.04% decline 📉.
However, there's a descending trendline ⤵️ pressing the price down. A break above this line would be a sign of reversal 🔄, targeting the first resistance at 0.0095467 💥. If the price holds above this point, it could trigger a bullish move towards higher resistances at 0.010237 (a 10.74% increase) and then to 0.0118714 (a 19.64% increase) 📈.
Key strategy: Watch for volume spikes 📊 and wait for a clean breakout above the descending trendline for a potential buying opportunity 🚀. If support breaks, prepare for deeper pullbacks ⬇️.
Stay sharp and manage your risks properly! 🛡️"
SHIB Is BullishFrom where we put the green arrow on the chart, it looks like a big bullish triangle is over.
By maintaining the green range, it can move towards the targets.
The targets are marked on the chart.
Closing a daily candle below the invalidation level will violate the analysis
For risk management, please don't forget stop loss and capital management
When we reach the first target, save some profit and then change the stop to entry
Comment if you have any questions
Thank You

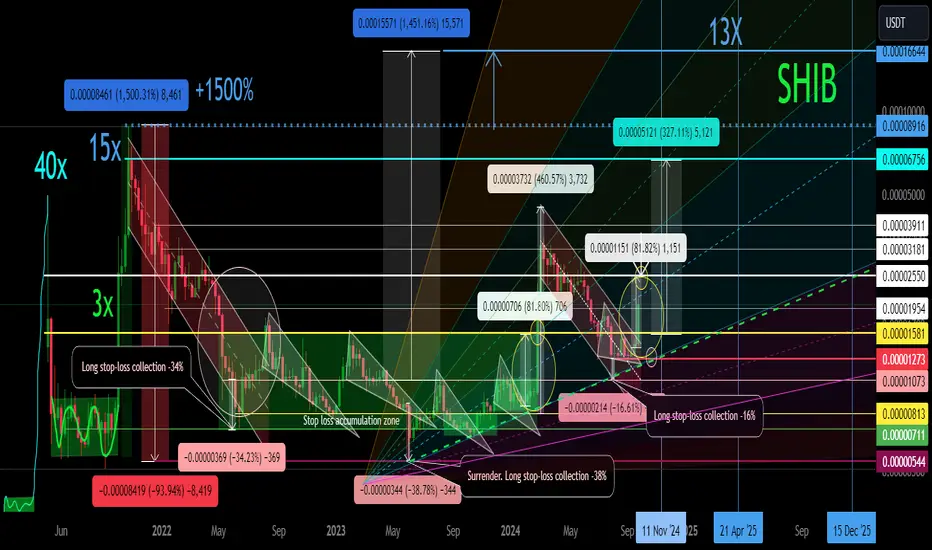
SHIB Major Trend. 09 2024Logarithm. Time frame 1 week.
Line chart , without market noise.
Secondary trend. Channel Zone.
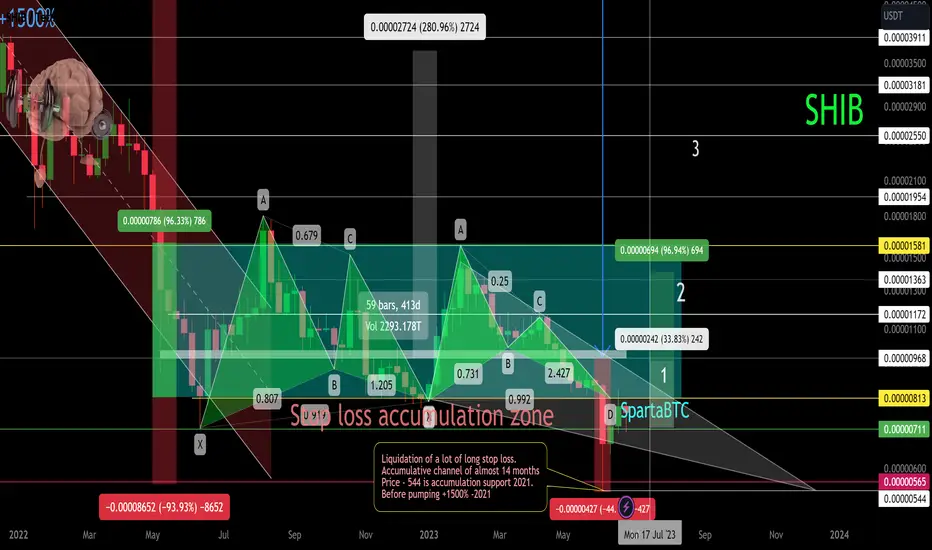
SHIB/USDT Secondary trend. Channel. 14 months accumulation.Logarithm. Time frame 1 week for clarity of the channel range. 3 weeks ago, there was an exit of the price under the support of the accumulation channel by a large percentage. Many long positions were liquidated.
The chart shows the percentages from this reversal zone to the channel resistance, as well as the average profit percentage when exiting this accumulation channel from the average set price to the significant first resistance.
This is what the chart of this cryptocurrency looks like on a line chart without the “market noise” volatility.
Accumulation Zone. Pump/Dump and compliance with risk and money management.
Remember, this is a pamp/dump meme cryptocurrency, which even at -93% down from peak pumping and with a set zone of about 14 months (!) is at an inadequate profit. That's why follow risk management in your work.
It is more rational to work on such cryptocurrencies, not with stops (high volatility, slippage at high %, high probability of beaten out before price increase, the large value of stop is meaningless, they can beat out at -2% and -40%), and work from average buy/sell price (only spot!) with reasonable observance of money management.
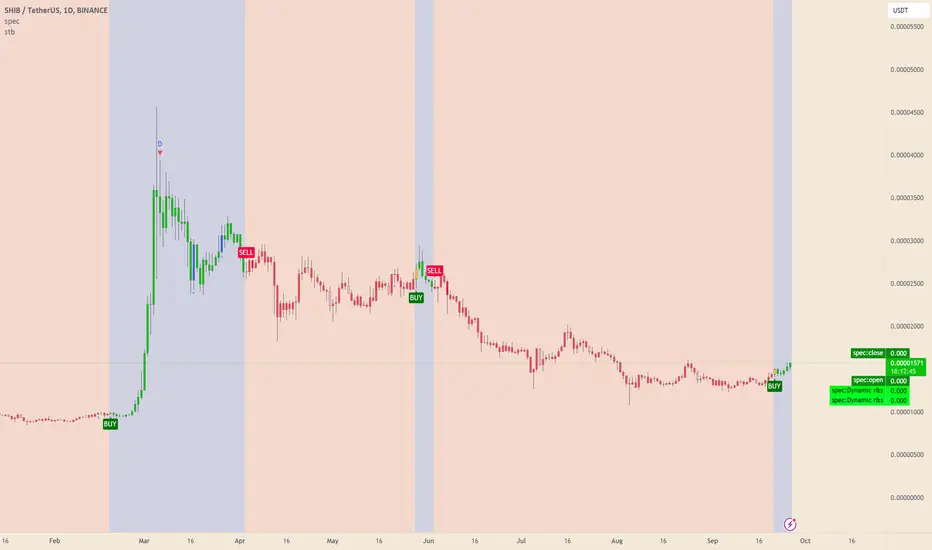
SHIBUSDT (SHIBA INU) Updated till 27-09-24SHIBUSDT (SHIBA INU) Daily timeframe range. finally we can see a move here almost close to 0.00002009 resistance. it do have potential to cover more space depends on retail interest. some cash flow into mcap also can help. recent support at 0.00001570.

Alikze »» SHIB | Upward wave 3 scenario🔍 Technical analysis: The scenario of the 3rd wave of the rising super cycle
- In the analysis presented in the previous post , after an upward wave up to the area of 2.618, the previous wave itself experienced significant growth.
- Currently, in the weekly time frame, after going through a downward trend in a channel, it managed to have a complex structural correction to the green box range, which led to an exit from the channel.
- Therefore, according to the current momentum, it will have the ability to reach the target of Fibo 1.618 range and then up to its previous ceiling.
- After that, if the previous ceiling is broken, the rising wave can extend to the specified supply area.
💎 In addition, if the previous floor or green box of stabilization occurs, the bullish scenario will be invalidated.
»»»«««»»»«««»»»«««
Please support this idea with a LIKE and COMMENT if you find it useful and Click "Follow" on our profile if you'd like these trade ideas delivered straight to your email in the future.
Thanks for your continued support.
Best Regards,❤️
Alikze.
»»»«««»»»«««»»»«««
BINANCE:SHIBUSDT

SHIB on the Move up! Shib just cleared a significant resistance level, and the chart shows a clear uptrend. Moving averages are crossing, suggesting more upward pressure in the short term.
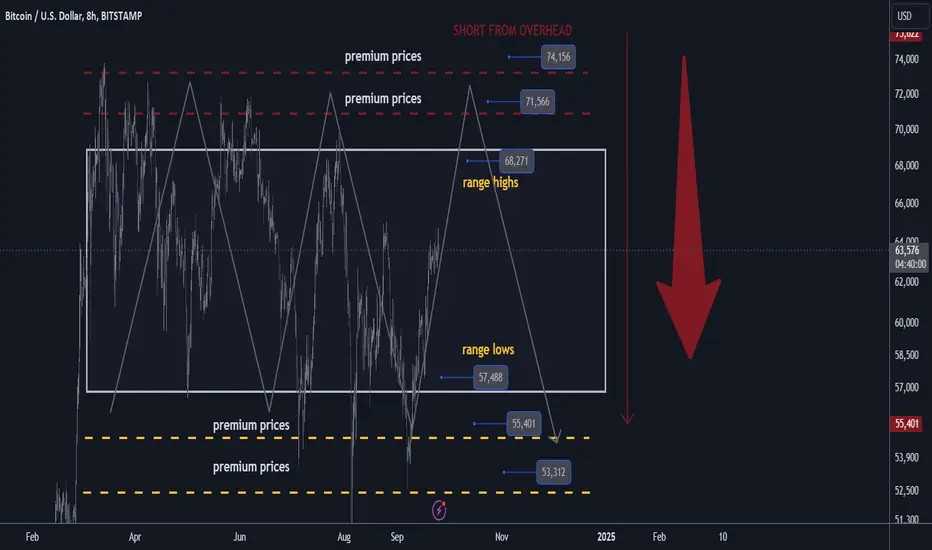
BTCUSD 8H: Locked in range / Short TP 55 000 usd🔸Hello traders, today let's review 8hour price chart for BTCUSD and potential reversal zones. So far price remains locked in tight trading range since March 2024, range highs set at 68 000 USD and range lows at 57 000 USD.
🔸Premium prices overhead at 71 500 / 74 000 USD and below at 55 000 / 53 000. Currently trading mid-range so no trades recommended in this zone.
🔸Ongoing compression in a tight range and low volatility ongoing since March 2024. This suggests that we are in accumulation/distribution stage right now and eventually range breakout will result in a high volatility move. Until then though makes sense to focus on trading range highs and range lows.
🔸Recommended strategy for position traders: Wait for price to max out near range highs and get ready to short from premium levels. Conservative TP on sell side at 55 000 USD.
🎁Please hit the like button and
🎁Leave a comment to support our team!
RISK DISCLAIMER:
Trading Futures , Forex, CFDs and Stocks involves a risk of loss.
Please consider carefully if such trading is appropriate for you.
Past performance is not indicative of future results.
Always limit your leverage and use tight stop loss.
SHIBA looks to be finally gaining some ground!After three wedges failed to produce a breakout, and with price action continuing downward, creating a very defined price channel, SHIBA has, for the first time since forming the massive breakout flag pattern, broken out of the current wedge to the upside.
This could be a sign of good things to come!
Good luck, and always use a stop loss!

$PAW BREAKOUT COMING +10000% MOVEWe can see that $paw is trying to breakout here. wont take long anymore till the move happens

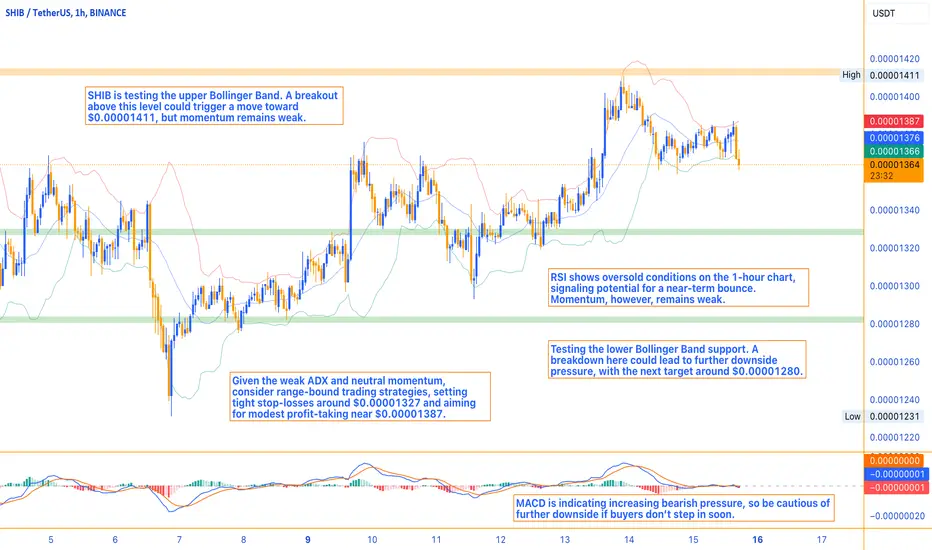
SHIB: Struggling to Break Key ResistanceSHIB has shown a consolidation pattern in the last several hours, trading at $0.00001365, with both the 1H and 4H data indicating weak momentum and slight bearish tendencies. Recent whale activity and general meme-coin market interest have supported SHIB’s price, but technicals show a need for stronger momentum to push the price higher.
1H Chart Breakdown: Weak Momentum and Consolidation
On the 1-hour chart, SHIB has been hovering near its Bollinger Band Basis of $0.00001376, unable to gain significant bullish momentum. The RSI at 38.52 signals a slightly oversold condition, while the Stochastic Oscillator (%K at 3.85) is deep in oversold territory, hinting at a potential short-term bounce. However, the MACD is flat, and the ADX at 11.46 indicates a weak trend, suggesting the price might remain in a tight range unless there’s a volume spike.
Resistance: $0.00001387 (Upper BB)
Support: $0.00001365 (Lower BB)
4H Chart Breakdown: Bearish Momentum Building
The 4-hour chart is showing more caution, with SHIB sitting slightly below the Bollinger Band Basis ($0.00001369). The RSI at 49.70 is neutral but points toward a weakening bullish trend, while the Stochastic Oscillator (%K at 25.76) is still in oversold territory, suggesting potential for a brief upward correction. However, the MACD histogram is negative, indicating growing bearish momentum, while the ADX at 12.22 suggests the trend is still relatively weak.
Resistance: $0.00001411 (Upper BB, Parabolic SAR)
Support: $0.00001327 (Lower BB)
Support and Resistance Levels (Across Timeframes):
Immediate Resistance (1H & 4H): $0.00001387 - $0.00001411 (Upper BB, SAR level)
Immediate Support: $0.00001327 - $0.00001365 (Lower BB)
Actionable Strategy: Range-Bound Trading with Weak Momentum
Bullish Scenario:
If SHIB breaks above $0.00001387 (1H Upper BB), it could attempt a push toward $0.00001411 (4H resistance and SAR level). For traders seeking quick entries, look for a bounce confirmation with rising volume.
Bearish Scenario:
A failure to hold support at $0.00001365 could see SHIB testing the $0.00001327 level (Lower BB on 4H), and a break below this could open doors to more significant downside toward $0.00001280.
Action Point: Given the weak ADX and neutral momentum, consider range-bound trading strategies, setting tight stop-losses around $0.00001327 and aiming for modest profit-taking near $0.00001387.