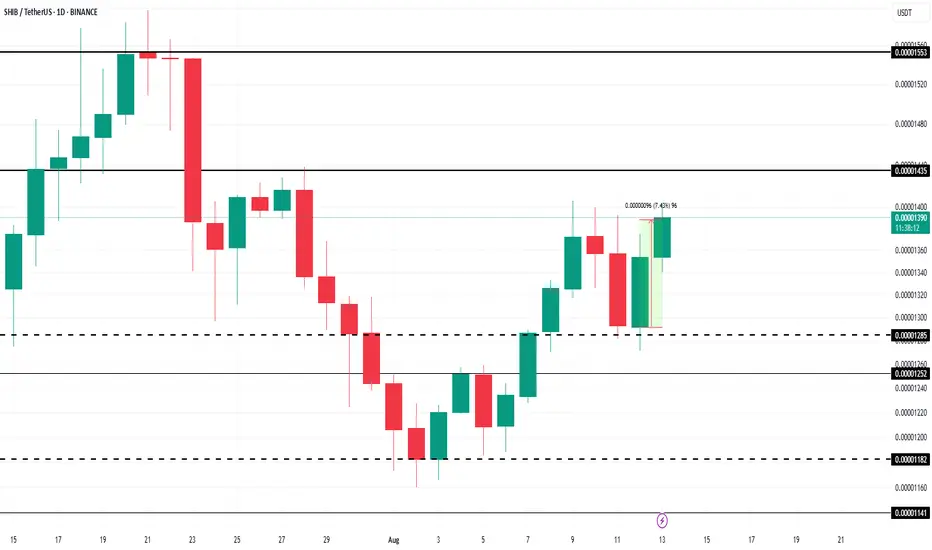
How Are Shiba Inu’s Most Profitable Holders Acting Right Now?At the time of writing, BINANCE:SHIBUSDT is trading at $0.00001366 , holding above the local support of $0.00001285. The altcoin has yet to reach the crucial resistance level of $0.00001435, which marks a significant hurdle for its recovery.
The HODL Cave analysis reveals that BINANCE:SHIBUSDT holders who have held their tokens for 18 to 20 months are currently the most profitable, second only to the all-time low (ATL) buyers. These long-term investors are seeing median profits ranging from 1.54x to 1.57x .
The 2-Year Mean Coin Age indicator, which tracks the movement of tokens over the past two years, is currently showing an uptick. Over the past two months, only one instance of selling has been recorded, highlighting the ongoing resilience of BINANCE:SHIBUSDT long-term holders .
Breaking through $0.00001435 is essential for BINANCE:SHIBUSDT to make its way to $0.00001553. Reaching this level would signal the recovery of July's losses and indicate that SHIB is back on track for further gains. The support from the most profitable holders is likely to play a pivotal role in helping SHIB break through this resistance.
However, if BINANCE:SHIBUSDT faces heavy selling pressure from skeptical holders or retail investors, the price could fall below the support of $0.00001252 . This would likely trigger a decline towards $0.00001182 or lower, invalidating the bullish thesis and signaling further downside for the altcoin.
Shiba
ELON/USDT Ready for the big pumpELON/USDT Ready for the big pump
Not everyone is ready for what is happening.
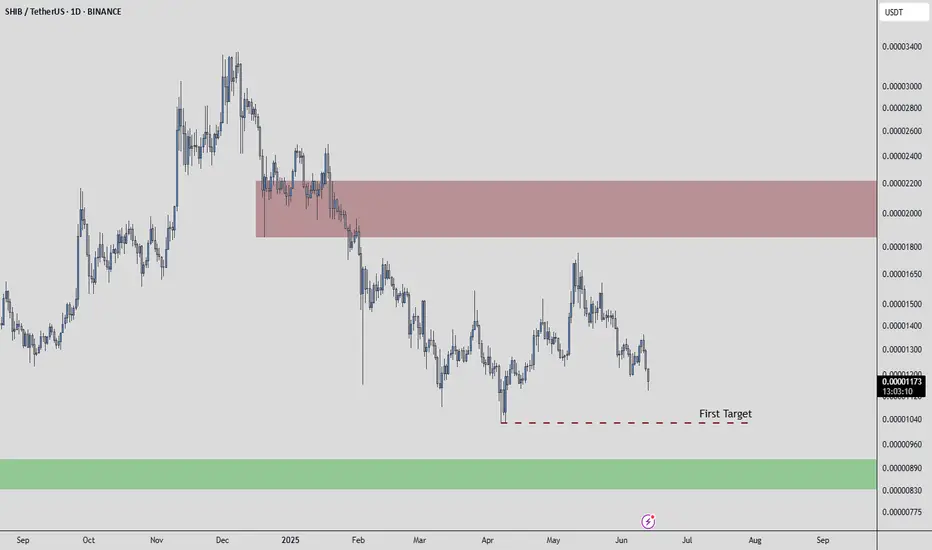
Shiba inuShib usdt Daily analysis
Time frame daily
First target = 0 00001944$
Risk rewards ratio =2 👈👌
Second target = 0.00003
Risk rewards ratio >3.5 👈 👌
The red box that you can see on the screen is very important resistance area.
If Shiba breaks it strongly, second target will be reach
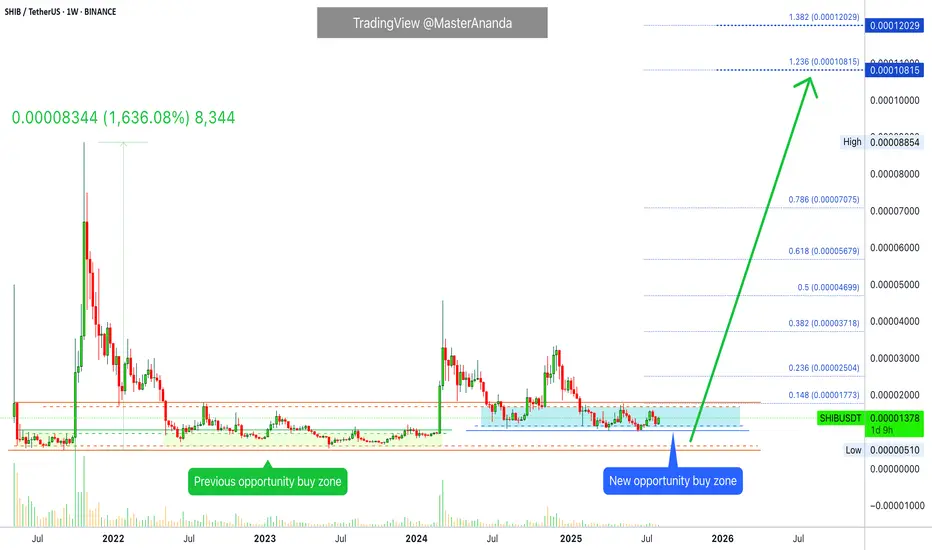
Shiba Inu Trades within Opportunity Buy Zone · Last ChanceShiba Inu grew more than 1,600% in October 2021. All this bullish action happened in just one month, under 30 days. These are the strong variations I keep talking about.
» Tezos's previous bull market lasted 714 days.
» Shiba Inu's previous bull market lasted 49 days (coming from the September 2021 low).
Since October 2021 SHIBUSDT has not seen a new bull market. After the all-time high there was a correction leading to the same pre-bull market support zone being activated but no new lows. We can see a long-term double-bottom and this is a signal of strength.
SHIBUSDT consolidated nicely in 2022 and there was a bullish jump in late 2023 leading into Q1 2024. This is the same move that produced big waves across the entire Cryptocurrency market. Here it was a minor event relatively speaking. If we were to compare this jump to bull market action, it is nothing really. The good news is that we are now entering a completely new market phase.
While we have higher lows in 2024 and 2025 compared to 2022 and 2023, the action for SHIBUSDT is still happening within the "opportunity buy zone." The same range used to buy before a major change of trend. This is mostly relevant for whales because they need years in order to create a position.
So Shiba Inu is in a new and strong accumulation zone ready to grow. Long-term higher lows, sideways and marketwide bullish action; the best is yet to come.
We are looking at bottom prices. You are looking at the lowest levels in 2025 before the bull market phase. There is still some time left but SHIBUSDT is ready to move ahead...
Time is running out.
Market conditions are great.
Simple strategy: Buy and hold.
Thank you for reading.
Namaste.
SHIB Breakout Watch – Red Resistance Being Tested!🚨 CRYPTOCAP:SHIB Breakout Watch – Red Resistance Being Tested! 🔴⏳
CRYPTOCAP:SHIB is testing the red resistance zone.
📊 If breakout confirms, next move could target:
🎯 Target → Green line level
A breakout could trigger bullish continuation and upside momentum.
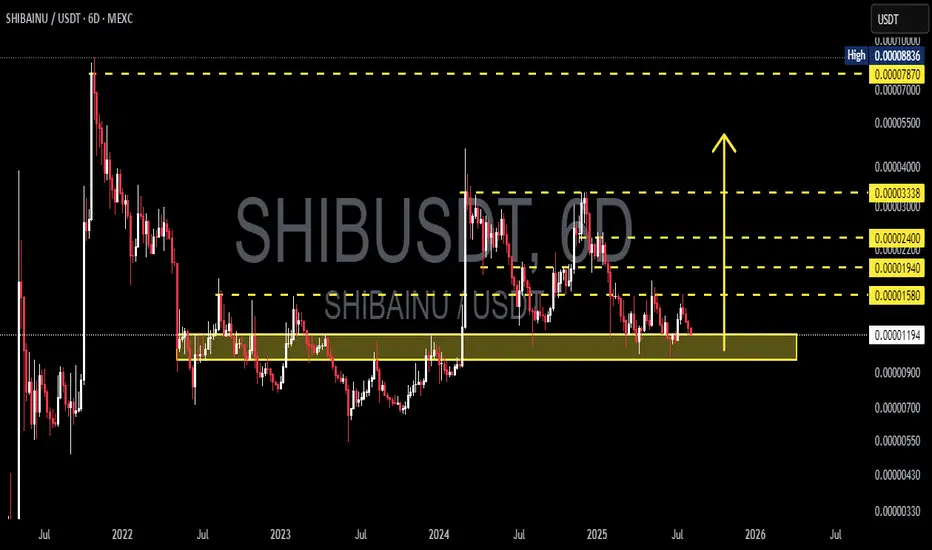
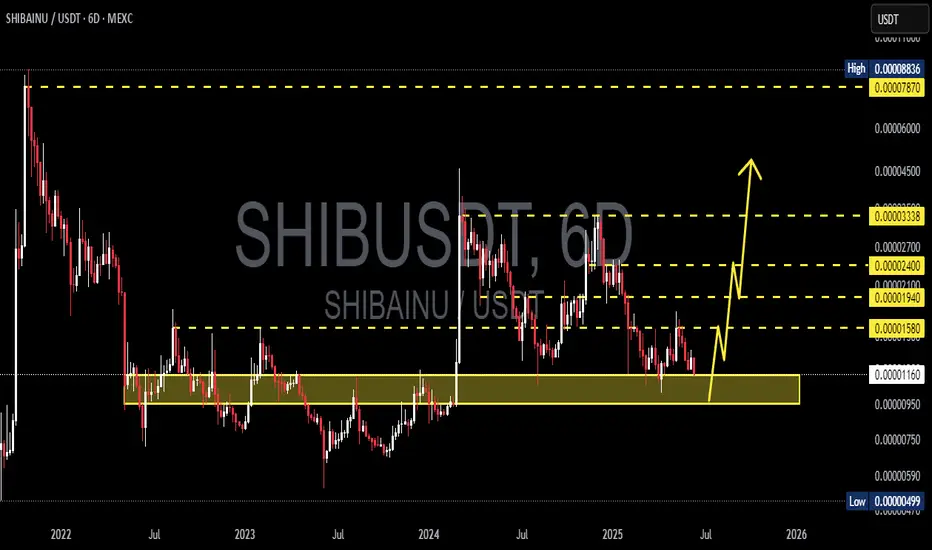
SHIBA/USDT Testing the Make-or-Break Zone — End of Accumulation?🧠 Overview:
SHIBA/USDT is once again testing a critical support zone that has held strong since early 2022. This area isn’t just a technical level — it represents a long-term accumulation zone where buyers have consistently stepped in.
What happens next could define SHIB's mid to long-term trend. Will we see a major bullish reversal, or is a breakdown and deeper correction looming?
---
📊 Technical Breakdown:
Key Demand Zone (Major Support):
🔸 0.00001090 – 0.00001190 USDT
This zone has been tested multiple times over the past two years. It remains the last major stronghold for bulls. A breakdown here could trigger panic selling.
Important Resistance Levels (Bullish Targets):
🔹 0.00001580 → Initial resistance
🔹 0.00001940 → Previous distribution area
🔹 0.00002400 → Strong psychological level
🔹 0.00003338 → Mid-term bullish target
🔹 0.00007870 – 0.00008836 → High timeframe supply zone and potential long-term profit-taking area
Market Structure:
🔸 Price remains inside a long-term horizontal consolidation range
🔸 No clear breakout yet, but early signs of buyer interest are forming
🔸 Possibility of forming a double bottom or accumulation breakout if bullish momentum strengthens
---
📈 Bullish Scenario:
✅ Price holds above 0.00001190 support
✅ Breakout above 0.00001580 = early trend reversal signal
✅ Bullish confirmation with volume increase
✅ Mid-term targets: 0.00001940 → 0.00002400 → 0.00003338
✅ Long-term potential: Retest of 0.00007870 – 0.00008836 (key supply zone)
---
📉 Bearish Scenario:
❌ Breakdown below 0.00001090 = major bearish signal
❌ Potential drop toward lower zones:
▪️ 0.00000900
▪️ 0.00000700
▪️ 0.00000550 (next key support zone)
❌ Price structure shifts to lower lows, indicating trend weakness and potential distribution phase
---
🧩 Pattern Insights:
📌 Market showing signs of Sideways Accumulation for over 1.5 years
📌 Could be a Re-Accumulation Phase before a major breakout
📌 Current movement resembles a Wyckoff-style Spring, which often precedes an upward expansion
---
📌 Conclusion:
SHIB is standing at a major inflection point. If buyers continue to defend this support zone, it could mark the beginning of a new bullish cycle. However, if this level breaks, further downside is highly likely.
This is a moment of calm before potential volatility — stay alert and watch volume + price action closely.
#SHIB #SHIBUSDT #CryptoBreakout #SupportZone #AltcoinAnalysis #SHIBAInu #TechnicalAnalysis #AccumulationPhase #WyckoffMethod #CryptoBullish #CryptoBearish
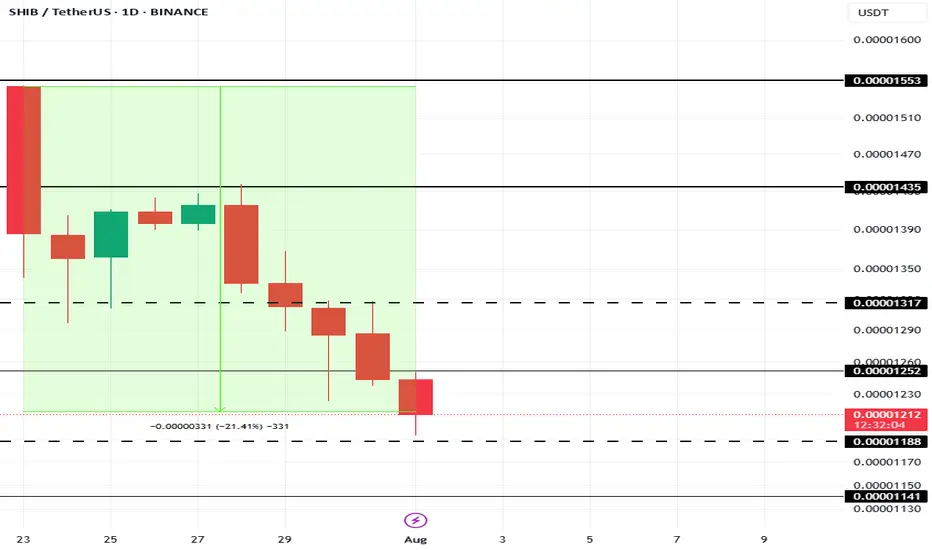
This Is The Cause Of Shiba Inu Price’s 21% Fall In 10 DaysAt present, BINANCE:SHIBUSDT price is sitting at $0.00001210, down 21% over the last 10 days . The drop in Shiba Inu's price can be traced to a sharp decline in the number of new addresses interacting with the token.
In the last 10 days, the number of new addresses has decreased by nearly 40% . This sudden exit of new investors indicates waning confidence in BINANCE:SHIBUSDT price potential, particularly after an extended rally earlier in the year.
If this trend continues, BINANCE:SHIBUSDT could lose the critical support level of $0.00001188, pushing the price down to $0.00001141 or potentially lower. However, if SHIB manages to hold onto its $0.00001188 support level, there is a possibility of recovery.
A bounce from this level could push BINANCE:SHIBUSDT price up to $0.00001317 . Securing this level as support would create a bullish scenario, invalidating the bearish thesis and offering hope for further price growth in the near future.
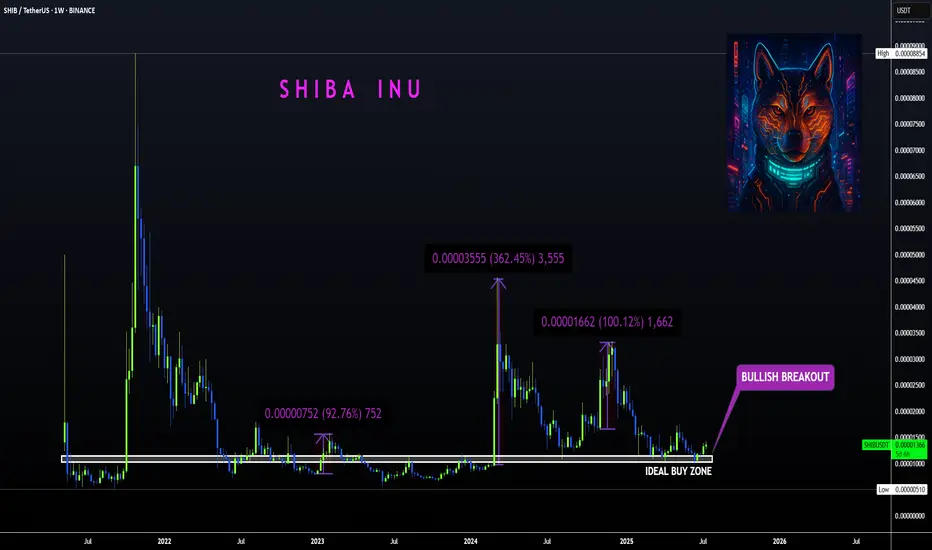
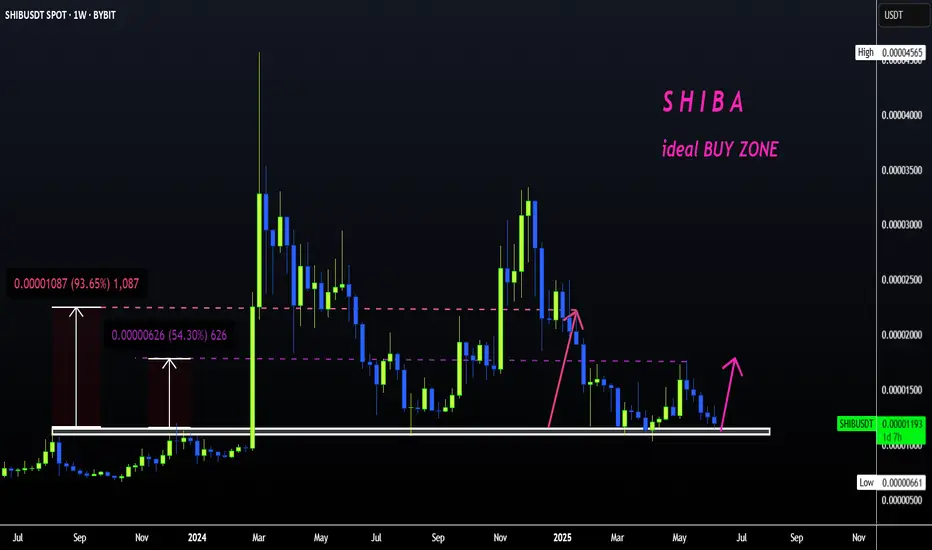
SHIBA | Bullish Breakout ABOVE Ideal Buy ZoneBINANCE:SHIBUSDT
Shiba is know to make big increases in short periods of time... that's why we love it!
The tricky thing about SHIBA is that the pumps can be unpredictable so the best way to ensure a position is to buy as low as possible to the ideal buy zone.
In the weekly timeframe, the technical indicators are not quite bullish yet. The moving averages is still above the price, meaning the bulls have yet to take full control of the price in lower timeframes.
The same can be said for the daily, although we are seeing progress as the 200d moving averages have been reclaimed:
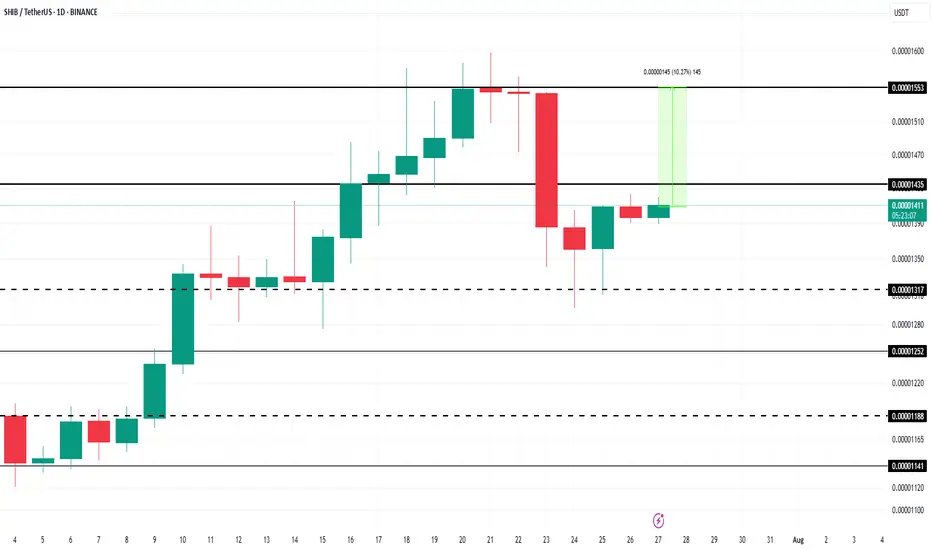
Here’s Why Shiba Inu Price’s 10% Rise Entails $50 Million LossesAt the time of writing, BINANCE:SHIBUSDT price is $0.00001407, sitting just below the resistance level of $0.00001435. The altcoin has been facing mixed signals, with both bearish and bullish factors playing a role in its price action. The key resistance level of $0.00001435 needs to be broken for a potential recovery.
The liquidation map shows a fascinating development: if BINANCE:SHIBUSDT recovers the 10% losses it has sustained by reaching $0.00001553, it could trigger over $52 million worth of short liquidations . Short sellers have been betting on a decline, but if SHIB rebounds, these traders will face considerable losses.
If BINANCE:SHIBUSDT continues to hover within the consolidation range of $0.00001435 and $0.00001317 , traders will remain safe from liquidation risks. This sideways movement will keep the altcoin within a neutral zone, avoiding drastic price changes in the immediate term.
However, if BINANCE:SHIBUSDT price manages to break the resistance at $0.00001435 and flips it into support, SHIB could potentially climb back to $0.00001553. This would mark a 10% recovery , invalidating the current bearish sentiment and shifting the outlook to a more optimistic tone.
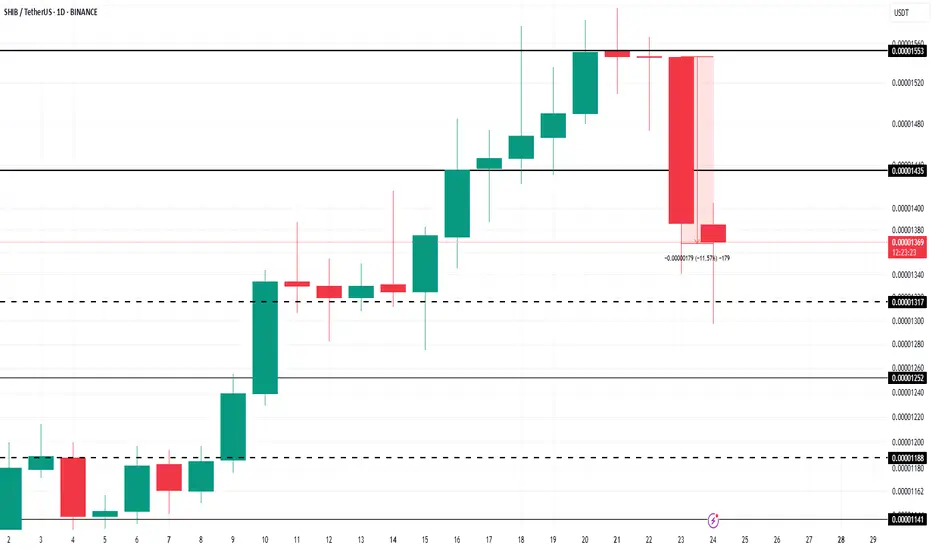
Shiba Inu Whales Amass 4.66 Trillion SHIB As Price Falls 12%BINANCE:SHIBUSDT price is currently trading at $0.00001353, down 11.5% over the past 24 hours . The altcoin is holding above the support level of $0.00001368.
The large holders' netflow for BINANCE:SHIBUSDT has recently spiked, reaching a two-month high. In the last 24 hours, 4.66 trillion SHIB were accumulated by addresses holding at least 0.1% of the circulating supply. These whales, who have collectively invested $63.7 million , are betting on a price rebound.
A successful bounce off $0.00001317 would likely pave the way for further price appreciation, potentially pushing BINANCE:SHIBUSDT to $0.00001553 . Securing this level as support could mark a recovery of today’s losses and initiate a new uptrend, provided the broader market conditions remain favorable.
On the other hand, if BINANCE:SHIBUSDT falls below the support of $0.00001317 due to profit-taking, the meme coin could slip to $0.00001188 . This would invalidate the bullish thesis and further reduce investor confidence. The next few days will be crucial in determining if SHIB can maintain its current support levels .
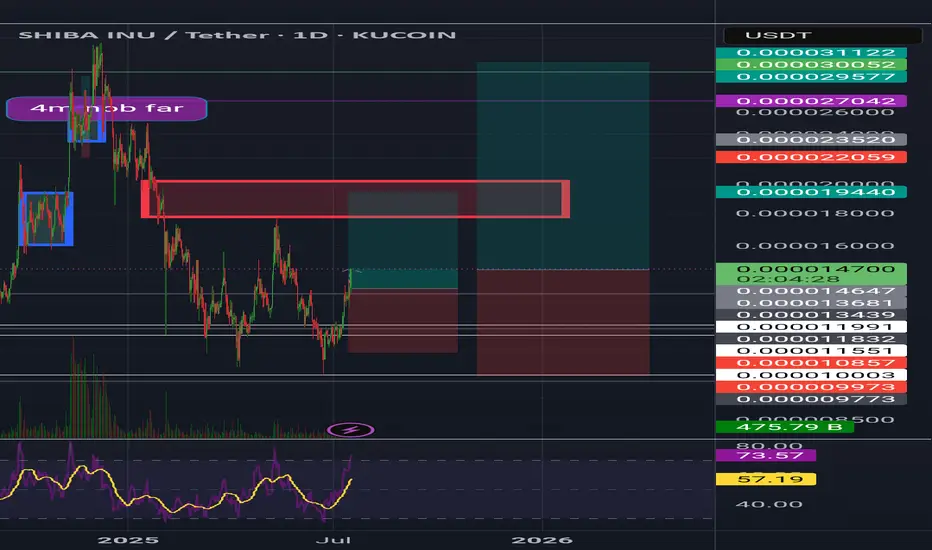
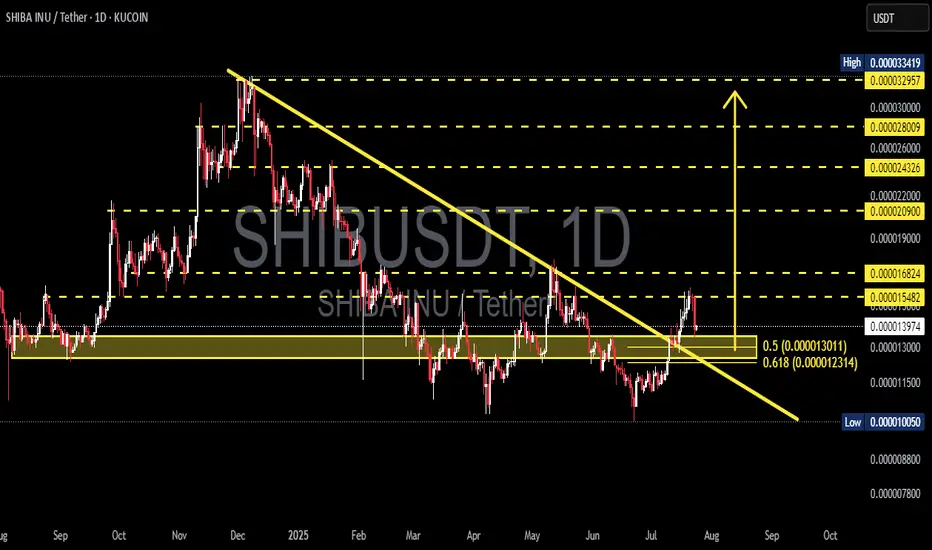
SHIBUSDT | Explosive Breakout from Long-Term Downtrend!📊 Overview:
After months of being trapped in a major downtrend, SHIBA INU (SHIBUSDT) has finally broken out of a multi-month descending trendline that has been capping price action since late 2024. But this isn’t just a minor breakout — this could mark a macro trend reversal, with bullish momentum building up fast.
---
📐 Technical Breakdown (Daily Chart – KuCoin):
🟡 Chart Pattern:
A clear Falling Wedge pattern has been forming since December 2024.
The breakout occurred mid-July 2025 with strong price action and early confirmation from volume.
Falling wedge is typically a bullish reversal pattern — and this breakout confirms that narrative.
🟨 Breakout Zone:
Price decisively broke above the descending trendline and is now consolidating just above it.
A successful retest of the breakout level strengthens the bullish case.
🟦 Key Fibonacci Support – “Golden Pocket”:
The zone between 0.000013011 (Fib 0.5) and 0.000012314 (Fib 0.618) is now acting as strong support.
Known as the “Golden Pocket”, this zone is often where high-probability reversals occur.
---
🚀 Bullish Scenario (High Probability):
As long as price stays above the Fibonacci golden pocket, SHIB is well-positioned for a continued rally. Key upside targets include:
1. 📍 Target 1: 0.000016824 → Previous key resistance
2. 📍 Target 2: 0.000022000 → February supply zone
3. 📍 Target 3: 0.000029000 → Major historical resistance
4. 🏁 Target 4 (Full Extension): 0.000033419 → Potential top of the breakout range
If momentum and market sentiment align, SHIB may be entering a new bullish cycle.
---
🔻 Bearish Scenario (Low Probability, but Manage Risk):
If price fails to hold above the golden pocket:
🔽 Support 1: 0.000011500 → Previous consolidation base
🔽 Support 2: 0.000010050 → Historical demand zone
A breakdown below 0.000010050 would invalidate the bullish structure and shift SHIB back into a prolonged accumulation phase.
---
🔍 Conclusion & Market Sentiment:
✅ The trend has flipped! This is one of the most anticipated breakouts for SHIB holders. As long as the structure holds above the golden pocket zone, the bullish outlook remains very strong.
⚠️ However, beware of potential fakeouts if volume drops or Bitcoin triggers broad market weakness.
---
📢 Trading Setup (Not Financial Advice):
For Bulls: Look for entries around 0.00001350–0.00001300
Stop-loss: Below 0.00001220
Take-profits: 0.0000168 → 0.000022 → 0.000029
For Bears: Wait for breakdown below 0.00001200 to consider short positions
---
🧠 Final Notes:
> SHIB remains a high-volatility microcap token. It's a prime pick for swing traders and momentum hunters — but risk management is key. Keep an eye on BTC for confirmation or invalidation.
#SHIBUSDT #SHIBA #SHIBBreakout #AltcoinSeason #BullishSetup #GoldenPocket #FallingWedge #CryptoSignals #TechnicalAnalysis #BreakoutPlay
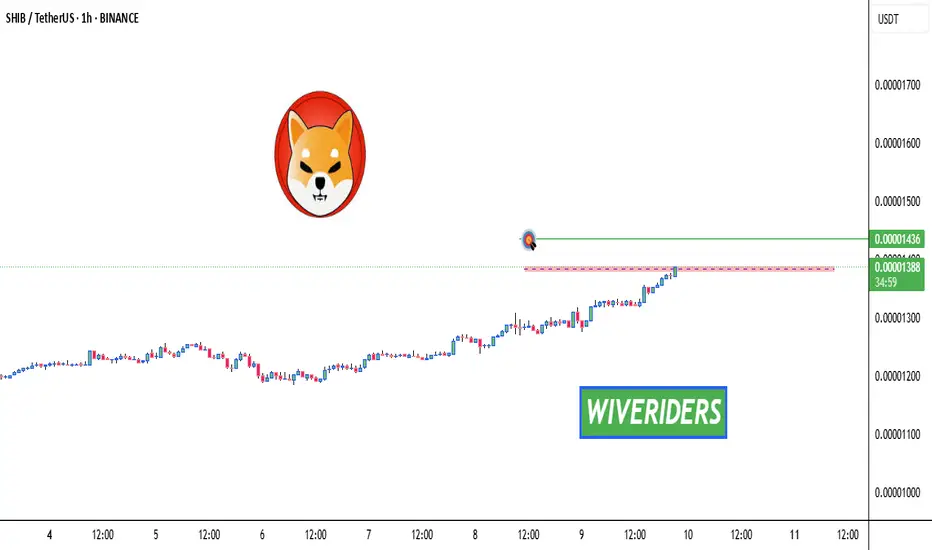
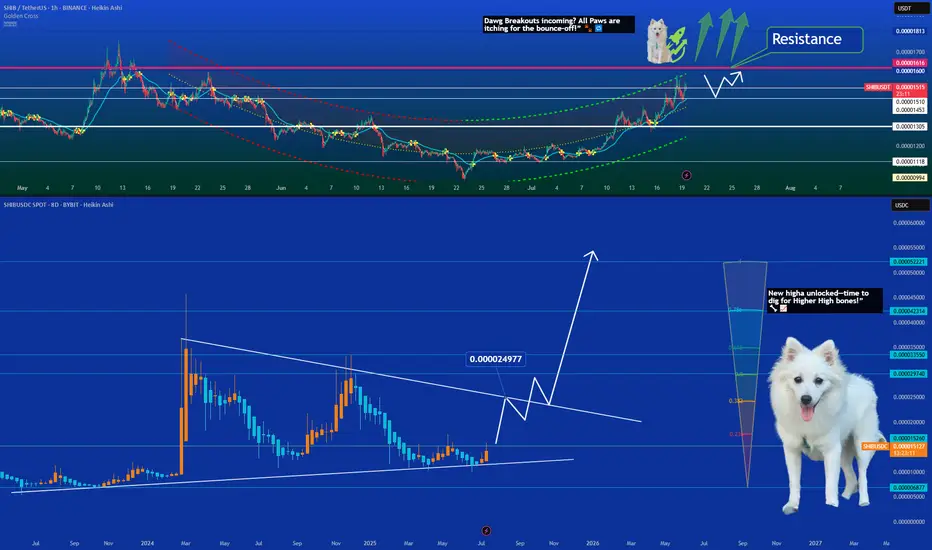
SHIB — Starting a Bullish Climb?📈 SHIB Breaks Downtrend — Starting a Bullish Climb 🔥🐾
Shiba Inu just pierced its descending resistance line on the 8‑day chart—signaling a trend reversal🔥
On the 1‑hour chart:
SHIB has climbed above a key resistance zone (~0.00001510–0.00001550 USDT)
Now forming a potential retest → bounce setup
Close support lies near 0.00001400, with resistance at ~0.00001600–0.00001620
If the retest holds, SHIB could climb toward 0.00002497 (projected breakout-high), and potentially push further into the 0.00003–0.00005 range if broader momentum kicks in.
📰 Recent SHIB Highlights
AI & Burn Surge: SHIB recently spiked ~3%, hitting a 7‑week high as burn rates and AI whitepaper buzz fueled optimism
Technical breakout: Surpassed a 26‑day EMA resistance (~0.00001280) with +93% volume increase, RSI/MACD showing room to grow toward 0.000015
c
Price outlook: Analysts predict SHIB to reach ~0.000016 by July 23—about +9% upside in the next few days
Ecosystem strength: With Shibarium L2, NFT and metaverse initiatives, and strong community support, SHIB is seen as one of the top meme‑ecosystem plays
Market cap stands near $8.9B, same as Uniswap – highlighting SHIB’s heavyweight presence despite price lag.
CoinCodex
🎯 Trade Setup & Targets
Level Zone (USDT) Importance
Support 0.00001400–0.00001450 Ideal retest zone
Short Target 0.00001600–0.00001620 Near-term bounce objective
Mid Target 0.00002497 Measured breakout target
Sky’s Limit 0.000030–0.000045 If momentum aligns with narrative
Stop-loss can be placed just below 0.00001350 to protect against false breaks.
🐶 Punchlines for Chart Overlay
Top Chart (1‑hr):
“Bounce incoming? Shib's paws are itching for the bounce-off!” 🐾🔁
Bottom Chart (8‑day):
“8‑week high unlocked—time to dig for next bones!” 🦴📈
One Love,
The FXPROFESSOR 💙
Disclosure: I am happy to be part of the Trade Nation's Influencer program and receive a monthly fee for using their TradingView charts in my analysis. Awesome broker, where the trader really comes first! 🌟🤝📈
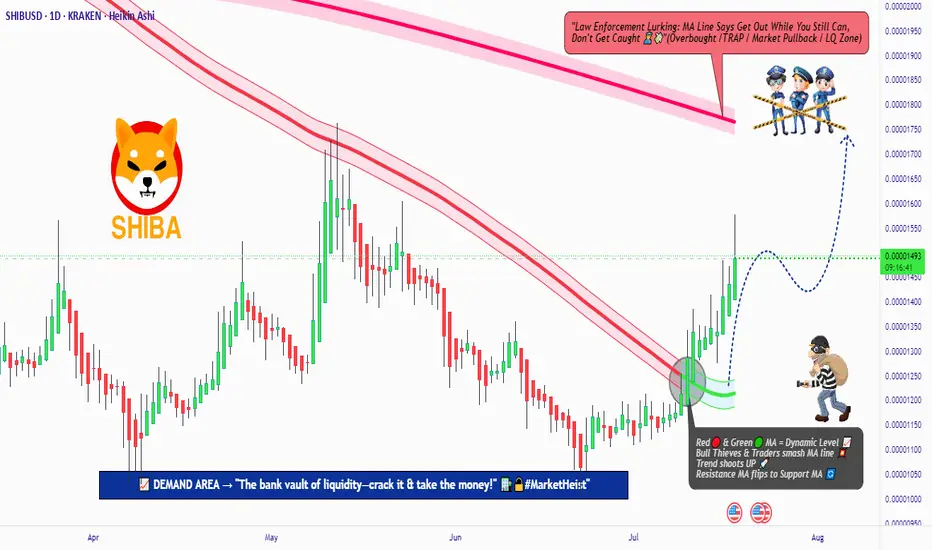
SHIBA INU Heist Plan: Rob the Market, Ride the Bull!💎🚨 "SHIBA INU Crypto Heist Plan: Rob the Market or Get Robbed!" 🚨💎
Thief Trading Style | SHIBA/USD | Bullish Analysis | DCA Heist Strategy | Swing & Scalping Masterplan
🌍 Hey World! 👋 Hola, Ola, Bonjour, Hallo, Marhaba! 🌟
To all the Market Robbers, Bulls in Disguise, and Silent Money Movers — welcome to Thief Trading’s Heist Blueprint 💼🔫 for SHIBA INU vs. USD!
📊 Chart Analysis Breakdown:
Based on my Thief Trading™ Style – a fusion of technical setups, fundamentals, and macro crime-scene evaluations – we’re executing a bold LONG setup targeting a bullish breakout. 🕵️♂️💥
This heist involves breaking past the Police Resistance Checkpoint (moving average red zone), where bearish forces and retail roadblocks stack up.
💹 Heist Entry Strategy:
📍Entry Idea: “The vault's cracked open!”
Longs can be triggered at market price – but wise robbers use precision:
⏱ Place Buy Limit Orders near 15min or 30min swing low pullbacks.
💼 DCA / Layered Entry Method is advised – the more stealthy the approach, the bigger the bag.
🛑 Risk Management:
📌Stop Loss (SL):
Set near recent swing highs/lows on the 1D candle wick zone.
🔒 Example SL: 0.00001300
Remember, SL should scale with your risk appetite, lot size, and number of entries.
🎯 Thief Target:
📍 Target: 0.00001770 or jump off early if the cops (market sellers) start closing in.
You don’t need to wait for the vault to be empty — grab what you can and exit clean.
🔍 Scalper's Shortcut:
Only long-side scalps are valid here.
💰 Big pockets = Fast Entry
💼 Small pockets = Join the Swing Gang
Use Trailing SL to guard your loot and stay agile in the escape.
🧠 Why This Heist? (Fundamentals Insight):
SHIBA/USD is heating up 🔥 due to:
Bullish sentiment in crypto
On-chain activity uptick
Retail momentum shifts
Intermarket cues lining up
📚 Dive deeper into:
📰 News Impact
📊 COT Reports
🔗 On-chain metrics
🧭 Sentiment & Intermarket Guidance
⚠️ Risk Zone Alert:
🚨 News events = Market Chaos
➡️ Avoid fresh entries near news drops
➡️ Use Trailing SLs to lock profits & manage active positions wisely
🙌 Support the Heist Movement:
🔥 Hit the BOOST button if you vibe with the Thief Trading style!
Every boost helps power the team to deliver more precision setups, market heists, and easy-to-follow strategies daily. 💸💎💪
📌 Important Disclaimers:
This is a general market outlook and not financial advice. Always analyze based on your own system and risk tolerance. Markets shift fast — stay updated and adapt.
💬 Comment below if you're on the crew. Let's rob the market together — one chart at a time.
🚀 See you in the next heist, Money Makers! Stay silent, move smart, and steal success! 🤑🐱👤🏆
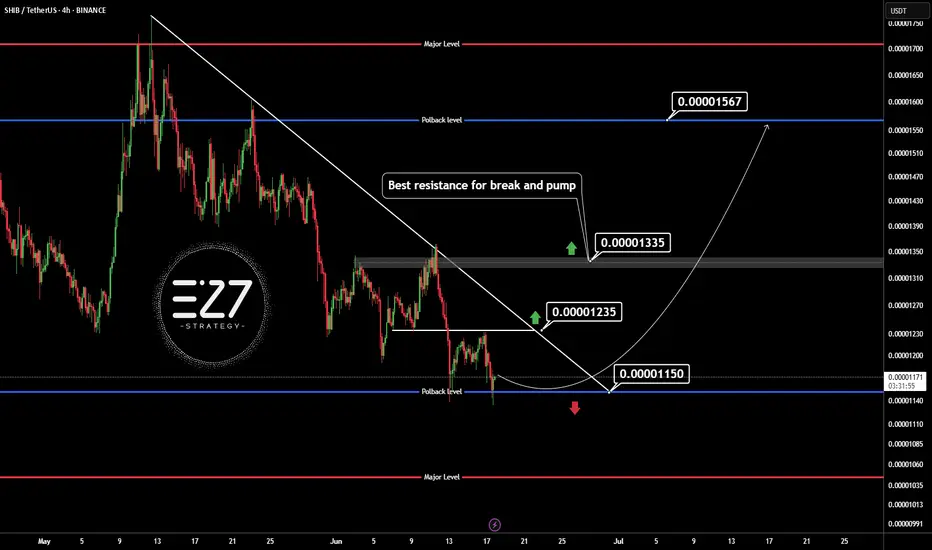
SHIBUSDT🕯 The key resistance level, identified as the best resistance for a break and pump, stands at 0.0000135, with a potential price increase to 0.00001567 if breached, serving as the next target (Pullback level). On the support side, the main level is observed at 0.0000115, and should the price fall below this, it may decline further to the lower Major Level of 0.0000100.
🔽 Resistances:
Main resistance level: 0.0000135 (potential break for pump)
Next target (Pullback level): 0.00001567
🔼 Supports:
Main support level: 0.0000115
Lower level (Major Level): 0.0000100
⚠️Contorl Risk management for trades.
CLOUD THIS CAN BE THE BOTTOM STARTThis is a new coin to watch in the coming period, as it is showing signs of potentially forming a new bottom.
By respecting the previous all-time low, there’s a possibility that a new upward trend could begin from this level. Some indicators are also pointing toward this scenario.
If the coin provides further confirmations, updates will be shared below.

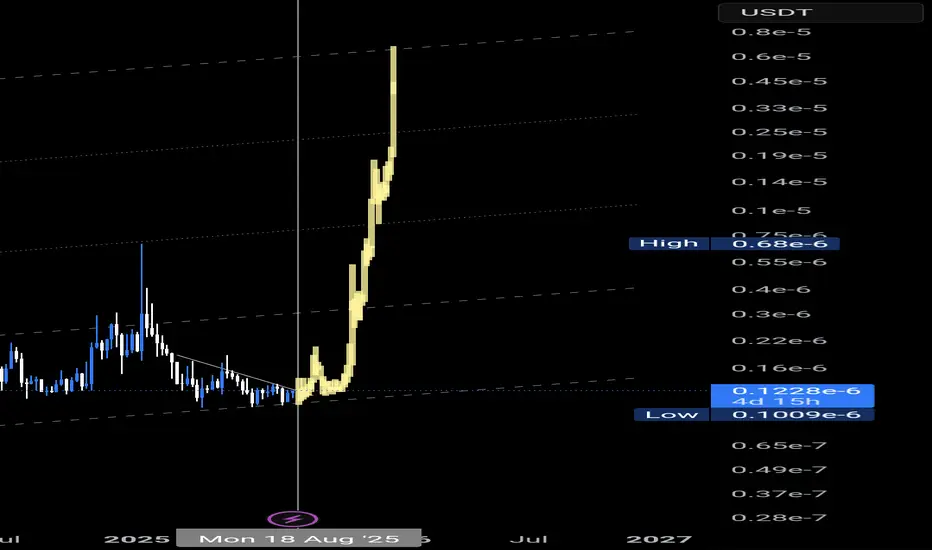
Shiba Inu Still Early Massive Wave yet Bullish —1,558% PPThe blue pattern on the chart is an analog of the purple pattern but bigger.
It is still early for Shiba Inu (SHIBUSDT) because the action is happening below MA200. The long-term bullish bias is only confirmed once the action moves and closes above this level.
This shouldn't be considered bearish because we have a clear higher low based on the two different consolidation patterns. The purple one produced the main low and the blue one the higher low. Multiple higher lows.
Lows—support confirmed—in August 2024, April & June this year. And that's it. This weekly candle is now full green and everything is about to turn positive crazy. Shiba Inu has been bearish since March 2024.
There was some bullish action in November 2024 but it ended as a lower high, what a bummer. All this time with no new highs, no major growth. This cycle is coming to an end. The null cycle, the boring cycle, the little-to-no-profits cycle is over... That's awesome. What does Shiba Inu has in store for us?
A new all-time high to start. Maximum growth. Euphoria, higher prices; growth. It will be awesome.
I am giving you all of the targets for Shiba Inu (SHIBUSDT). The highest one is 0.000220491. Total profits potential reach 1,558% from current price.
There are two resistance levels of interest below the previous ATH: 0.000067612 & 0.000057511.
Minimum new 2025 all-time high we will go for 0.000103188 for 676%.
You can find more numbers and targets by doing a close-up on the chart.
I hope you find this information useful.
Your support is appreciated.
Namaste.

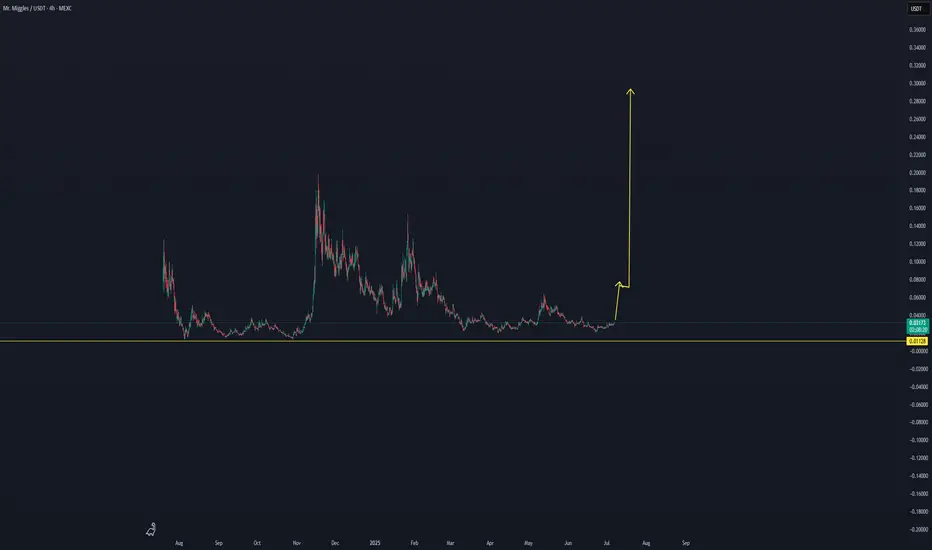
MIGGLES/USDT THE BREAK RETURN TO THE MOONMIGGLES/USDT THE BREAK RETURN TO THE MOON
We are following with live data on this coin for the next volume trend, which can have a break in the coming time.
At this moment, this coin is showing signs of an increase. When it gets confirmed, we will follow it with live updates.
SHIBA +100%?? | BEST Buy OPPORTUNITYSHIBA has been in a downtrend for many weeks.
From here, upside is likely - especially if we look at the consecutive amount of "red" weekly candles (blue on this chart).
A 40% bounce zone is easily possible from this zone. Even at modest, 20% would be ideal:
____________
BYBIT:SHIBUSDT
SHIBUSDT: Price Weakness & Your Next Short OpportunityMy focus is on SHIBUSDT, and the picture is clear: price is weak. This isn't a market where buyers are proving their strength; in fact, the opposite is true.
Most traders are confused by volatility. But you need to see the real opportunity. My analysis points to this: both red boxes I've marked on the chart are prime zones for short opportunities. They represent powerful selling regions.
Here's why, and your plan for action:
Red Box Power: These zones are where sellers are truly in control. I'm actively looking for price to engage with these areas.
Green Box Uncertainty: As for the green box, its strength is questionable. I'm not confident it will hold as reliable support for a bullish move, reinforcing my overall bearish view.
Confirm the Downside: Your decisive move comes with confirmation:
Volume Footprint: I'll be scrutinizing the volume footprint to see clear distribution from sellers.
CDV (Cumulative Delta Volume): Look for CDV to turn deeply negative, affirming seller dominance.
LTF Breakdowns: On the low timeframes (LTF), demand concrete breakdowns. Price must fail, retest the red boxes as resistance, and then continue lower. This is your undeniable signal.
My general bias remains bearish. I only trade assets showing a sudden increase in volume, and while this is a short setup, the volume dynamics confirming weakness are what I'm seeking.
Keep a sharp eye on those red boxes. If these confirmations line up, you'll uncover precise, high-probability short entries. This is where smart, confirmed decisions are made.
📌I keep my charts clean and simple because I believe clarity leads to better decisions.
📌My approach is built on years of experience and a solid track record. I don’t claim to know it all but I’m confident in my ability to spot high-probability setups.
📌If you would like to learn how to use the heatmap, cumulative volume delta and volume footprint techniques that I use below to determine very accurate demand regions, you can send me a private message. I help anyone who wants it completely free of charge.
🔑I have a long list of my proven technique below:
🎯 ZENUSDT.P: Patience & Profitability | %230 Reaction from the Sniper Entry
🐶 DOGEUSDT.P: Next Move
🎨 RENDERUSDT.P: Opportunity of the Month
💎 ETHUSDT.P: Where to Retrace
🟢 BNBUSDT.P: Potential Surge
📊 BTC Dominance: Reaction Zone
🌊 WAVESUSDT.P: Demand Zone Potential
🟣 UNIUSDT.P: Long-Term Trade
🔵 XRPUSDT.P: Entry Zones
🔗 LINKUSDT.P: Follow The River
📈 BTCUSDT.P: Two Key Demand Zones
🟩 POLUSDT: Bullish Momentum
🌟 PENDLEUSDT.P: Where Opportunity Meets Precision
🔥 BTCUSDT.P: Liquidation of Highly Leveraged Longs
🌊 SOLUSDT.P: SOL's Dip - Your Opportunity
🐸 1000PEPEUSDT.P: Prime Bounce Zone Unlocked
🚀 ETHUSDT.P: Set to Explode - Don't Miss This Game Changer
🤖 IQUSDT: Smart Plan
⚡️ PONDUSDT: A Trade Not Taken Is Better Than a Losing One
💼 STMXUSDT: 2 Buying Areas
🐢 TURBOUSDT: Buy Zones and Buyer Presence
🌍 ICPUSDT.P: Massive Upside Potential | Check the Trade Update For Seeing Results
🟠 IDEXUSDT: Spot Buy Area | %26 Profit if You Trade with MSB
📌 USUALUSDT: Buyers Are Active + %70 Profit in Total
🌟 FORTHUSDT: Sniper Entry +%26 Reaction
🐳 QKCUSDT: Sniper Entry +%57 Reaction
📊 BTC.D: Retest of Key Area Highly Likely
📊 XNOUSDT %80 Reaction with a Simple Blue Box!
📊 BELUSDT Amazing %120 Reaction!
📊 Simple Red Box, Extraordinary Results
📊 TIAUSDT | Still No Buyers—Maintaining a Bearish Outlook
📊 OGNUSDT | One of Today’s Highest Volume Gainers – +32.44%
📊 TRXUSDT - I Do My Thing Again
📊 FLOKIUSDT - +%100 From Blue Box!
📊 SFP/USDT - Perfect Entry %80 Profit!
📊 AAVEUSDT - WE DID IT AGAIN!
I stopped adding to the list because it's kinda tiring to add 5-10 charts in every move but you can check my profile and see that it goes on..
SHIBUSDT 6D Analysis SHIB ~ 6D Analysis
#SHIB Buy back gradually from here if you still have confidence in this coin with a short term target of at least 20%+ from this support.
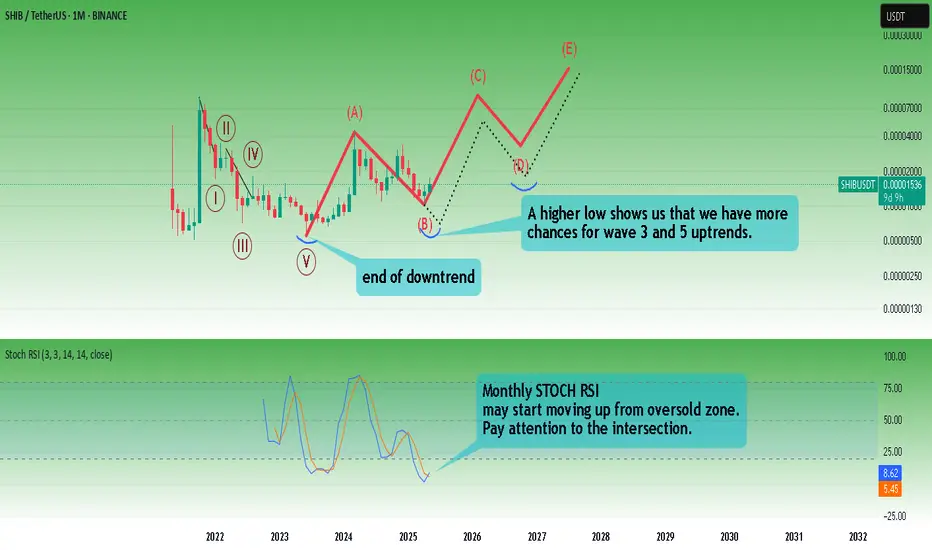
SHIB'S FUTUREMy scenario is like this.
* The purpose of my graphic drawings is purely educational.
* What i write here is not an investment advice. Please do your own research before investing in any asset.
* Never take my personal opinions as investment advice, you may lose your money.
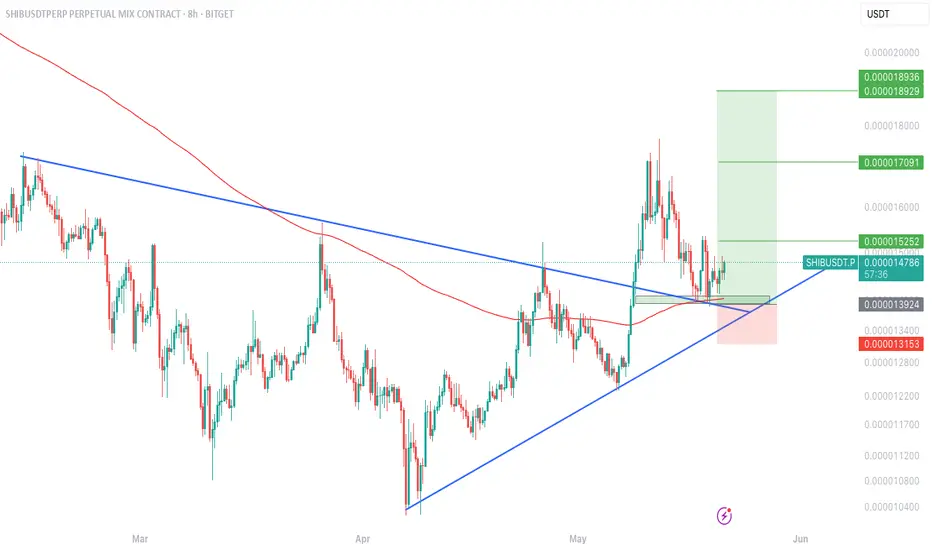
$SHIBUSDT – Major Retest Holding!CRYPTOCAP:SHIB is retesting a key breakout zone after breaking through a long-term descending trendline + 200 EMA. The structure remains bullish with a clean higher-low forming at the confluence of support.
📊 Technical Breakdown:
Breakout from descending triangle
Bullish retest of trendline + 200 EMA
Price printing higher lows above key support
🎯 Targets:
TP1: 0.000015252
TP2: 0.000017091
TP3: 0.000018929
🛑 Stop-loss: 0.000013153
📍 Entry Zone: Around 0.000014785
If bulls hold this zone, SHIB could see continuation toward mid-May highs and beyond.
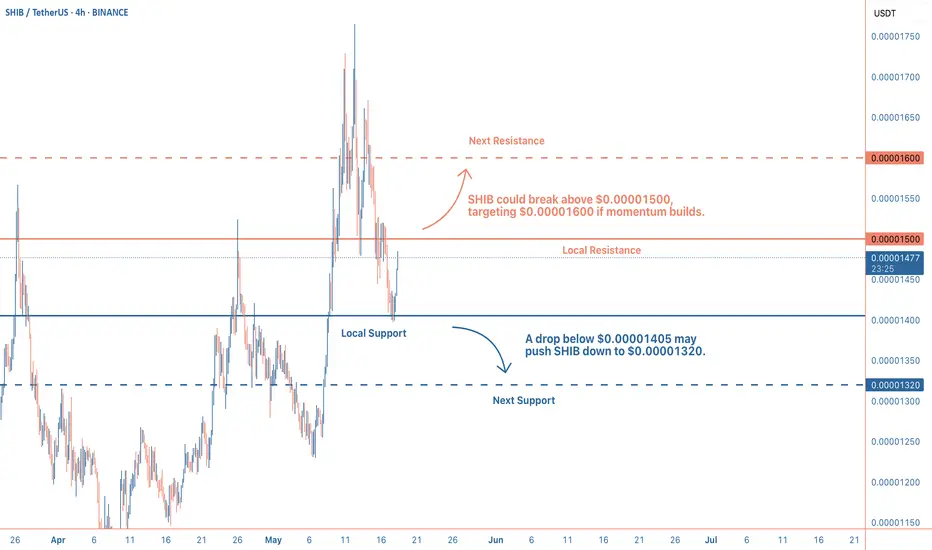
Consolidation Before the Next Big Move?The price is sitting close to a support level at $0.00001405, which has held strong lately. The Relative Strength Index (RSI) sits at 57, showing decent buying pressure but not overbought yet, while the 50-period moving average at $0.00001430 acts as a floor beneath the price. If SHIB breaks above $0.00001500 with confidence, it could climb toward $0.00001600. But if it falls below $0.00001405, the next stop might be $0.00001320.
What’s Driving SHIB Right NowOn the news front, Shiba Inu’s ecosystem is buzzing, especially with Shibarium, its layer-2 network, hitting over one billion transactions recently. Despite this milestone, SHIB’s price hasn’t taken off, likely due to a cooling crypto market and some investors cashing out after a May rally. Big players (whales) are stacking SHIB, with noticeable token inflows, and the burn rate is picking up, which could make SHIB rarer over time.