SHIB Long Entry Heist Plan – Bullish Setup in Trap Zone🦹♂️💸 SHIB INU Market: The Silent Heist Plan Is Live! 🚨💰
Thief Trading Style | Swing & Scalping Blueprint | High-Risk Zone Masterplan
🌍 Hello Global Robbers & Market Raiders! 🤑💥
Welcome to another secret mission straight from the vault of Thief Trading Style. We're eyeing the SHIB INU Crypto Market, and the time has come for a stealthy bullish strike!
🧠 The Blueprint – Operation SHIB-INU Break-In
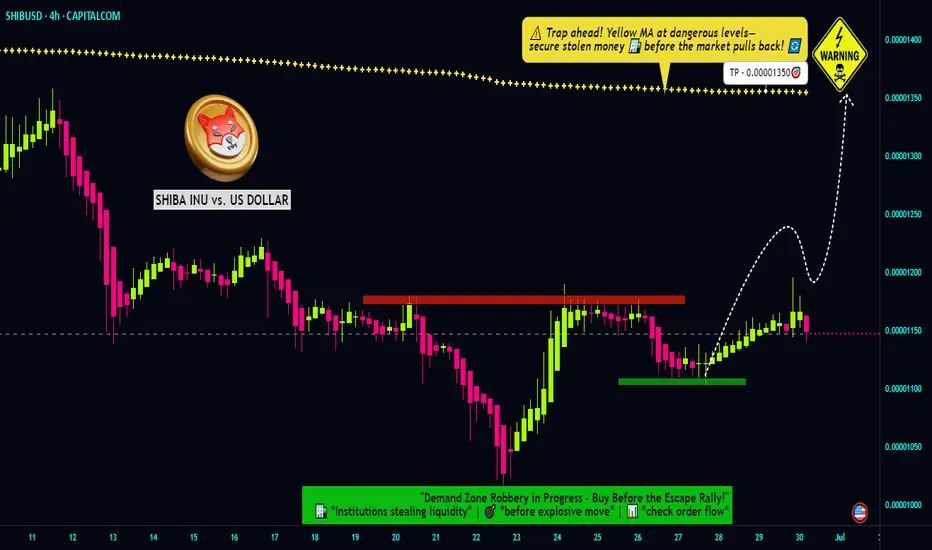
We’re executing a bullish move towards the Yellow MA Zone, a high-risk territory filled with consolidations, trap setups, and a potential reversal. The battlefield is tight, but the rewards are sweet for those who play it smart. 🎯💸
🔑 ENTRY STRATEGY – “Vault Access Granted” 🚪📈
💥 Entry Type: Buy/swing
💡 Zone: Pullback entries near swing lows (within 15–30m timeframes)
🕵️♂️ Stealth Entry – Wait for candle signals or limit orders near key liquidity zones.
🛡️ STOP LOSS – “Secure the Exit” 🛑🔐
📌 Placed just below recent swing low at 0.00001050 (30m TF)
🎯 SL adapts to your lot size, trade size, and number of entries.
🏴☠️ TARGET – “Escape Before Alarms Go Off” 🎯💨
💰 Target: 0.00001350
⏳ Optional: Trail your SL and exit on signs of exhaustion.
💼 Scalpers’ Side Mission – “Quick Loot Runs” 🧲⚡
Scalp only on the Long side; use trailing SLs and follow the robbers’ path.
Big wallets? Enter now. Small bags? Wait and follow the swing wave. 🕶️🚀
🧠 Strategic View
Market sentiment remains bullish, but the zone is volatile.
Use macro analysis, COT data, on-chain insights, and sentimental clues for confirmation. 🧠📊
⚠️ Important Notice – Market Hazards Ahead 📉📰
🔔 Watch out for major news releases!
✔️ Avoid new trades during high-impact events.
✔️ Use trailing SLs to guard profits.
✔️ Monitor market developments regularly – stay one step ahead.
💖 Support the Mission
If you love this robbery blueprint, 💥Hit the Boost Button💥 and join the Thief Trading crew for more profitable adventures! Every click fuels our next plan. 🏆💪❤️
📢 See You in the Next Raid!
Stay tuned for more high-stakes missions and daily loot setups!
📲 Follow for the next crypto break-in.
🐱👤🚨 Thief Traders never sleep... we scan, we strike, we secure the bag.
SHIBUSDT
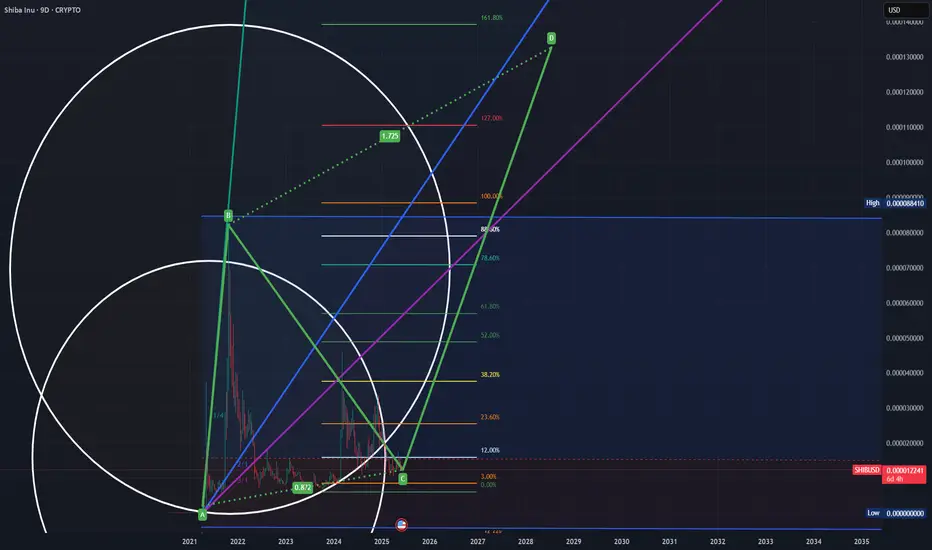
Shiba Inu Still Early Massive Wave yet Bullish —1,558% PPThe blue pattern on the chart is an analog of the purple pattern but bigger.
It is still early for Shiba Inu (SHIBUSDT) because the action is happening below MA200. The long-term bullish bias is only confirmed once the action moves and closes above this level.
This shouldn't be considered bearish because we have a clear higher low based on the two different consolidation patterns. The purple one produced the main low and the blue one the higher low. Multiple higher lows.
Lows—support confirmed—in August 2024, April & June this year. And that's it. This weekly candle is now full green and everything is about to turn positive crazy. Shiba Inu has been bearish since March 2024.
There was some bullish action in November 2024 but it ended as a lower high, what a bummer. All this time with no new highs, no major growth. This cycle is coming to an end. The null cycle, the boring cycle, the little-to-no-profits cycle is over... That's awesome. What does Shiba Inu has in store for us?
A new all-time high to start. Maximum growth. Euphoria, higher prices; growth. It will be awesome.
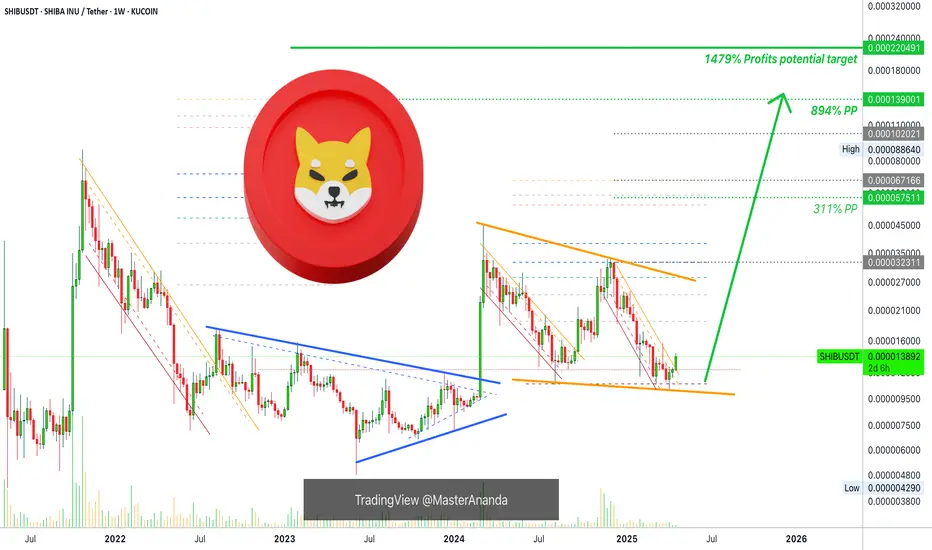
I am giving you all of the targets for Shiba Inu (SHIBUSDT). The highest one is 0.000220491. Total profits potential reach 1,558% from current price.
There are two resistance levels of interest below the previous ATH: 0.000067612 & 0.000057511.
Minimum new 2025 all-time high we will go for 0.000103188 for 676%.
You can find more numbers and targets by doing a close-up on the chart.
I hope you find this information useful.
Your support is appreciated.
Namaste.

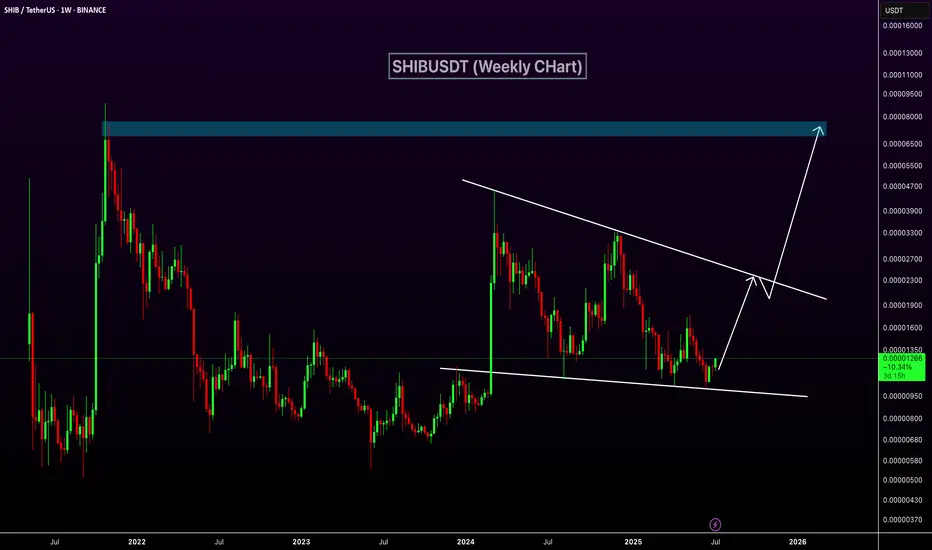
SHIBUSDT Bounces Strongly from Wedge SupportSHIBUSDT is forming a bullish falling wedge on the weekly chart, showing signs of reversal after bouncing from key support at 0.00001000. A breakout above the wedge resistance could trigger strong upside momentum in the coming weeks.
Entry at current price
Stop Loss: .00000890 (Below the Wedge Support)
TP1: 0.00001700
TP2: 0.00003100
TP3: 0.00007000
$1000SHIBUSDT CRYPTOCAP:SHIB
You all Panic and Sell While Whales Buy Ever sold at the exact bottom, just before the bounce?
Mass fear always becomes the perfect entry for whales, while regular traders are running away.
In this post, I’ll break down how their mindset beats ours, and how to flip the script on your own fear.
Hello✌
Spend 3 minutes ⏰ reading this educational material.
🎯 Analytical Insight on PEPEcoin:
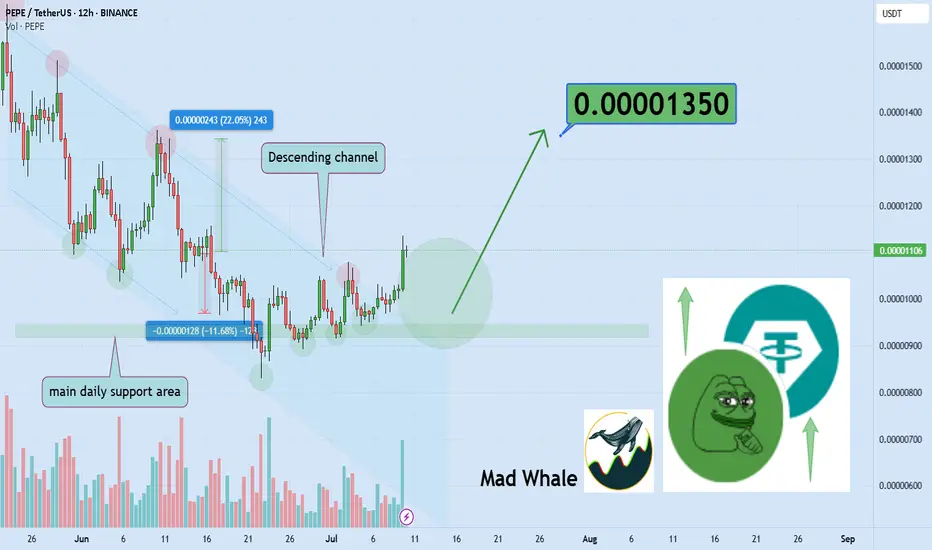
BINANCE:PEPEUSDT has broken above the descending channel resistance as well as a significant daily resistance level, supported by a solid increase in trading volume 📈. This confirms genuine buying interest and momentum in the market. Based on this breakout, I expect at least a 22% upside, with a target near 0.0000135 🚀.
Now , let's dive into the educational section,
🧠 Emotions Lie. The Chart Doesn’t.
In crypto markets, our first reaction is rarely logical. When prices dump, fear kicks in, not analysis.
That’s exactly when the big players step in. They know retail won’t buy the bottom; they chase green candles, not red opportunities.
🐋 What Whales Think That Retail Doesn’t
Whales wait for emotional exhaustion, full-on fear or full-on greed.
They don't enter with the crowd. They enter when the crowd wants out. That’s not coincidence. It’s a setup.
🧨 Self-Sabotage: The Retail Playbook
Retail traders usually:
Sell in panic on the dump
Buy in FOMO on the pump
Quit after liquidation
Whales don’t react to price, they react to opportunity.
📉 Why Real Bottoms Never Feel Safe
When a real bottom forms, it feels terrible. News is negative. Social media screams "SELL."
No one trusts the recovery. That’s why most miss it. Comfort does not equal opportunity.
⏳ Silence and Patience: Whale Superpowers
In sideways markets, retail gets bored and walks away.
Whales? They accumulate silently. They don’t seek confirmation. They seek positioning.
📊 TradingView Tools That Reveal Whale Moves
TradingView isn't just a charting site, it’s a weapon if you know what to look for:
Volume Profile shows zones where the most trading occurred. If price drops but volume remains dense, that’s hidden buying.
OBV (On-Balance Volume) tracks if smart money is loading while price moves slowly.
Combine RSI + MA to spot where sentiment diverges from logic.
Set up your own TradingView layout with these indicators. Use the data, not your gut.
🧲 Is This Crash A Hidden Invitation?
Every major dip asks one quiet question: “Do you still know the game?”
The smart money listens while the rest scream. The market has rhythm, if you hear it, you win.
🛡 Recap
Next time the market’s bleeding red and everyone’s afraid, zoom out.
Don’t listen to your fear, listen to the chart. Let TradingView’s tools be your edge, not just your screen.
✅ Final Thought:
Whales feed on our fear. So next time you're scared, don’t run, observe.
That fear might be your best entry, not your worst exit.
✨ Need a little love!
We pour love into every post your support keeps us inspired! 💛 Don’t be shy, we’d love to hear from you on comments. Big thanks , Mad Whale 🐋
📜Please make sure to do your own research before investing, and review the disclaimer provided at the end of each post.
SHIB – One Last Chance for a MoveGiving CRYPTOCAP:SHIB one last shot to do something big.
It’s sitting at a strong pivotal level with some clean weekly SFPs forming.
A 2x looks doable, especially considering how well it’s been holding—though it may take time.
CRYPTOCAP:PEPE and CRYPTOCAP:DOGE are showing strength too, so SHIB isn’t alone here.
The key? CRYPTOCAP:BTC needs to cool off and give alts some breathing room over the next two months. Otherwise, BINANCE:SHIBUSDT could drop another 50%.
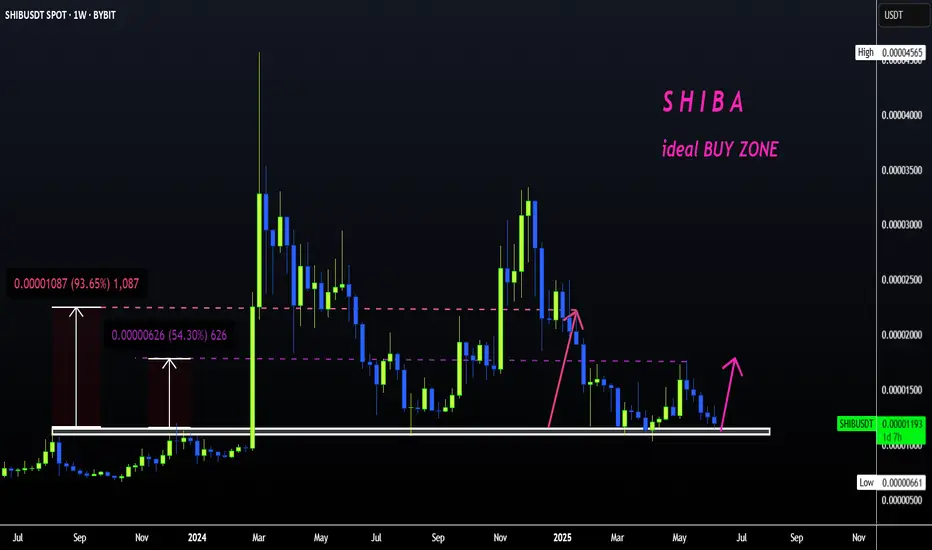
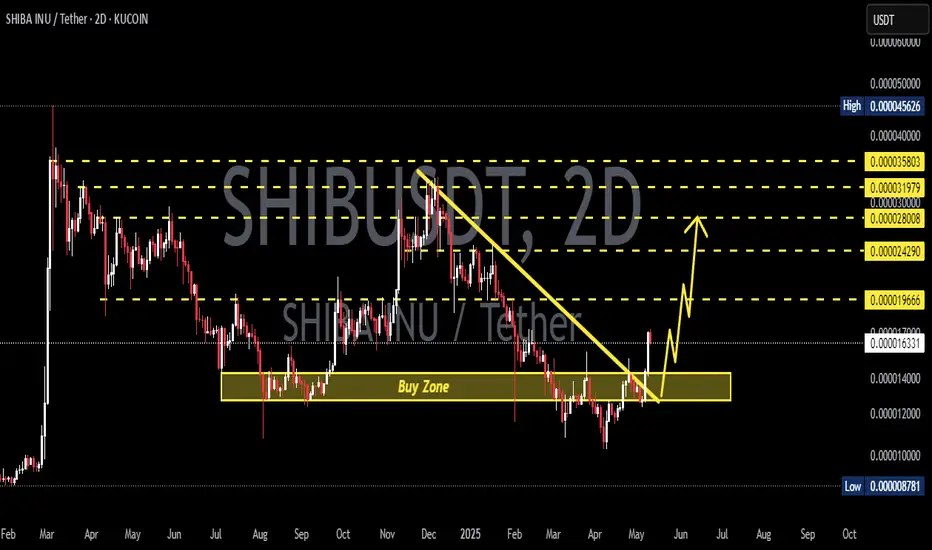
SHIBA +100%?? | BEST Buy OPPORTUNITYSHIBA has been in a downtrend for many weeks.
From here, upside is likely - especially if we look at the consecutive amount of "red" weekly candles (blue on this chart).
A 40% bounce zone is easily possible from this zone. Even at modest, 20% would be ideal:
____________
BYBIT:SHIBUSDT
SHIB/USDT is in Bullish TrendSHIB/USDT is looking good to go up side it is showing good retracement on daily chart and also showing bullish divergence on daily chart it can be buy current price or if some one want to be more sure then buy after new HH

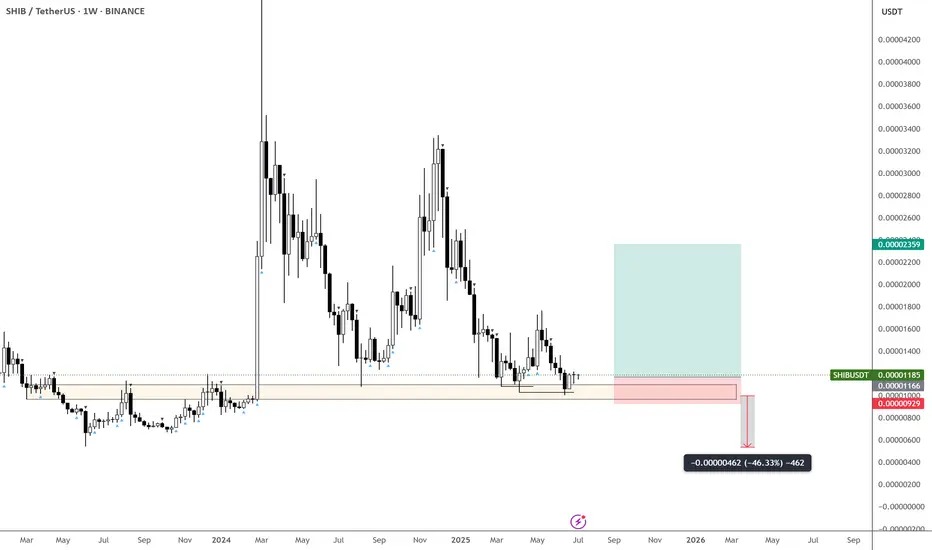
SHIBUSDT: Price Weakness & Your Next Short OpportunityMy focus is on SHIBUSDT, and the picture is clear: price is weak. This isn't a market where buyers are proving their strength; in fact, the opposite is true.
Most traders are confused by volatility. But you need to see the real opportunity. My analysis points to this: both red boxes I've marked on the chart are prime zones for short opportunities. They represent powerful selling regions.
Here's why, and your plan for action:
Red Box Power: These zones are where sellers are truly in control. I'm actively looking for price to engage with these areas.
Green Box Uncertainty: As for the green box, its strength is questionable. I'm not confident it will hold as reliable support for a bullish move, reinforcing my overall bearish view.
Confirm the Downside: Your decisive move comes with confirmation:
Volume Footprint: I'll be scrutinizing the volume footprint to see clear distribution from sellers.
CDV (Cumulative Delta Volume): Look for CDV to turn deeply negative, affirming seller dominance.
LTF Breakdowns: On the low timeframes (LTF), demand concrete breakdowns. Price must fail, retest the red boxes as resistance, and then continue lower. This is your undeniable signal.
My general bias remains bearish. I only trade assets showing a sudden increase in volume, and while this is a short setup, the volume dynamics confirming weakness are what I'm seeking.
Keep a sharp eye on those red boxes. If these confirmations line up, you'll uncover precise, high-probability short entries. This is where smart, confirmed decisions are made.
📌I keep my charts clean and simple because I believe clarity leads to better decisions.
📌My approach is built on years of experience and a solid track record. I don’t claim to know it all but I’m confident in my ability to spot high-probability setups.
📌If you would like to learn how to use the heatmap, cumulative volume delta and volume footprint techniques that I use below to determine very accurate demand regions, you can send me a private message. I help anyone who wants it completely free of charge.
🔑I have a long list of my proven technique below:
🎯 ZENUSDT.P: Patience & Profitability | %230 Reaction from the Sniper Entry
🐶 DOGEUSDT.P: Next Move
🎨 RENDERUSDT.P: Opportunity of the Month
💎 ETHUSDT.P: Where to Retrace
🟢 BNBUSDT.P: Potential Surge
📊 BTC Dominance: Reaction Zone
🌊 WAVESUSDT.P: Demand Zone Potential
🟣 UNIUSDT.P: Long-Term Trade
🔵 XRPUSDT.P: Entry Zones
🔗 LINKUSDT.P: Follow The River
📈 BTCUSDT.P: Two Key Demand Zones
🟩 POLUSDT: Bullish Momentum
🌟 PENDLEUSDT.P: Where Opportunity Meets Precision
🔥 BTCUSDT.P: Liquidation of Highly Leveraged Longs
🌊 SOLUSDT.P: SOL's Dip - Your Opportunity
🐸 1000PEPEUSDT.P: Prime Bounce Zone Unlocked
🚀 ETHUSDT.P: Set to Explode - Don't Miss This Game Changer
🤖 IQUSDT: Smart Plan
⚡️ PONDUSDT: A Trade Not Taken Is Better Than a Losing One
💼 STMXUSDT: 2 Buying Areas
🐢 TURBOUSDT: Buy Zones and Buyer Presence
🌍 ICPUSDT.P: Massive Upside Potential | Check the Trade Update For Seeing Results
🟠 IDEXUSDT: Spot Buy Area | %26 Profit if You Trade with MSB
📌 USUALUSDT: Buyers Are Active + %70 Profit in Total
🌟 FORTHUSDT: Sniper Entry +%26 Reaction
🐳 QKCUSDT: Sniper Entry +%57 Reaction
📊 BTC.D: Retest of Key Area Highly Likely
📊 XNOUSDT %80 Reaction with a Simple Blue Box!
📊 BELUSDT Amazing %120 Reaction!
📊 Simple Red Box, Extraordinary Results
📊 TIAUSDT | Still No Buyers—Maintaining a Bearish Outlook
📊 OGNUSDT | One of Today’s Highest Volume Gainers – +32.44%
📊 TRXUSDT - I Do My Thing Again
📊 FLOKIUSDT - +%100 From Blue Box!
📊 SFP/USDT - Perfect Entry %80 Profit!
📊 AAVEUSDT - WE DID IT AGAIN!
I stopped adding to the list because it's kinda tiring to add 5-10 charts in every move but you can check my profile and see that it goes on..
SHIBUSDT 6D Analysis SHIB ~ 6D Analysis
#SHIB Buy back gradually from here if you still have confidence in this coin with a short term target of at least 20%+ from this support.
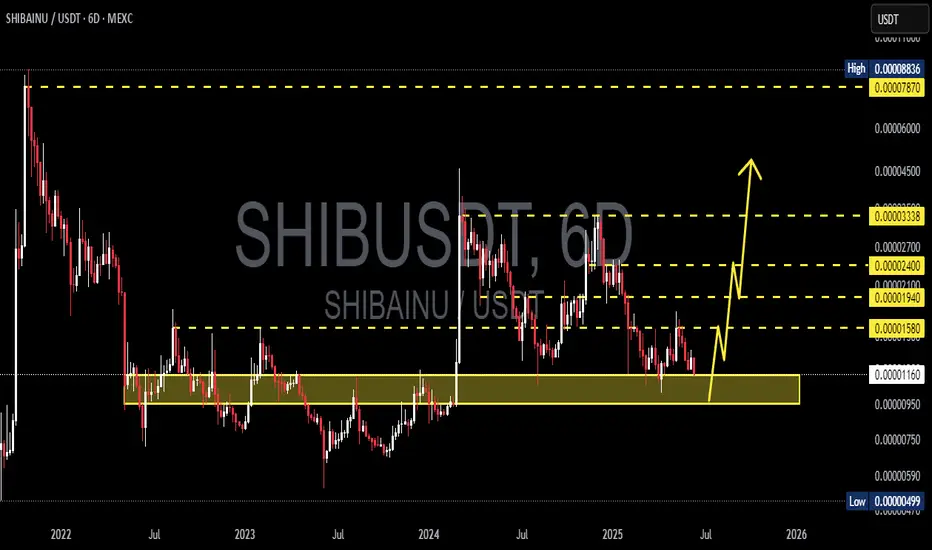
Stacking Shib and some other crap ERC20 tokens.It is time IMO to start stacking for the alt coin pumps.
here are a couple targets I have to sell 25% of my stack.
This is a risky play and could still take another year to work out????
NOT FINANCIAL ADVICE!!!!
SHIB'S FUTUREMy scenario is like this.
* The purpose of my graphic drawings is purely educational.
* What i write here is not an investment advice. Please do your own research before investing in any asset.
* Never take my personal opinions as investment advice, you may lose your money.
Shiba Inu Crypto: A Useless Coin That Can Still Make You RichHey everyone, welcome back to a new supply and demand crypto analysis. Today, I will analyse one of the most unexpected — but potentially lucrative — investment opportunities in the crypto space right now: Shiba Inu Metaverse crypto.
Yeah, I know what you’re thinking… “Isn’t Shiba Inu just another meme coin?”
And yes, fundamentally, it’s not trying to solve world hunger or revolutionise finance. But guess what? You don’t need a coin to be helpful to make money from it.
All you need is to understand price action and supply and demand. That’s it.
What is Shiba Inu?
So let’s break it down. Shiba Inu started as a meme — a direct competitor to Dogecoin. It’s an ERC-20 token on the Ethereum network with a massive circulating supply and a huge following. Over time, it has evolved and launched its own ecosystem — including Shibarium, SHIB: The Metaverse, and other utilities.
But let’s be real: Shiba Inu is not about real-world utility. It’s about speculation, community hype, and timing the market right based on simple but powerful trading concepts.
Daily Timeframe is Trending UP
Right now, things are shifting in our favour on the daily timeframe. We’ve just entered an uptrend — a key change in market structure — and more importantly, we’ve got a new imbalance forming around $0.00001320. This is the next key level where we’re waiting to re-enter the market.
Why wait? Because smart investors don’t chase candles. They wait for the price to return, where demand will likely kick in again. That level is $0.00001320. Once price returns there and confirms demand, we buy — and we ride the next wave.

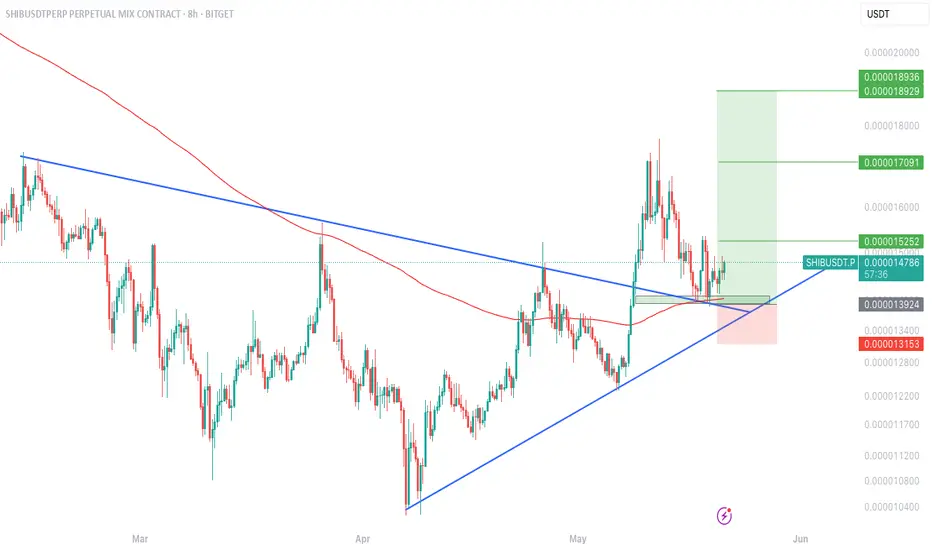
$SHIBUSDT – Major Retest Holding!CRYPTOCAP:SHIB is retesting a key breakout zone after breaking through a long-term descending trendline + 200 EMA. The structure remains bullish with a clean higher-low forming at the confluence of support.
📊 Technical Breakdown:
Breakout from descending triangle
Bullish retest of trendline + 200 EMA
Price printing higher lows above key support
🎯 Targets:
TP1: 0.000015252
TP2: 0.000017091
TP3: 0.000018929
🛑 Stop-loss: 0.000013153
📍 Entry Zone: Around 0.000014785
If bulls hold this zone, SHIB could see continuation toward mid-May highs and beyond.
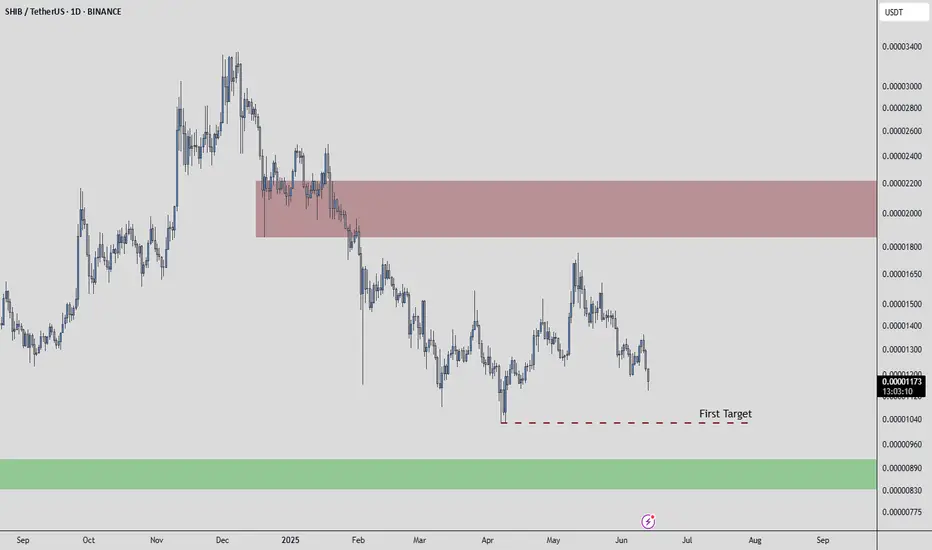
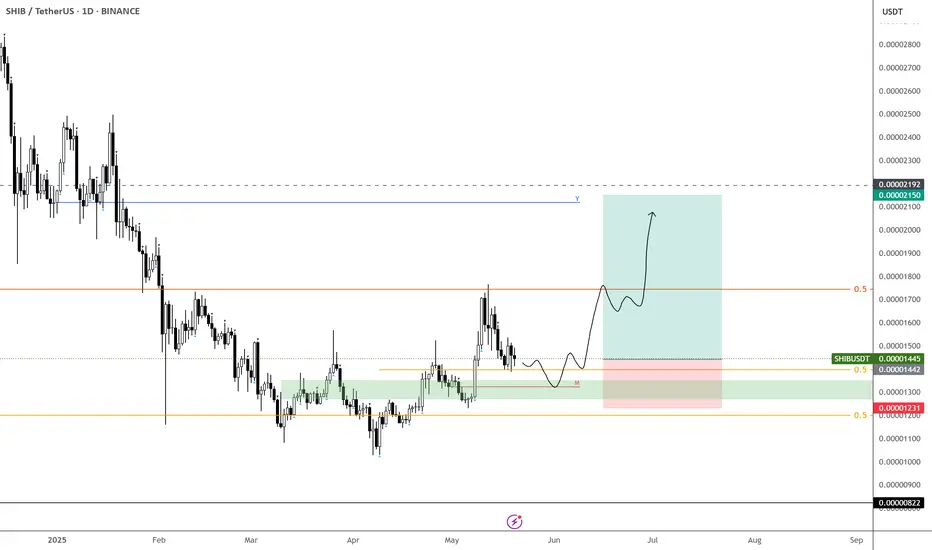
SHIB – Long Here, Aiming for 50% Upside
Time to go long on CRYPTOCAP:SHIB and ride this wave.
Doesn't look like it's going much lower—I was hoping to grab some a bit deeper into the green zone, but that might’ve been too picky.
Stepping in with a decent-sized position here. Will add more if it dips.
Planning to hold through June, market conditions permitting. First target: +50%.
BINANCE:SHIBUSDT
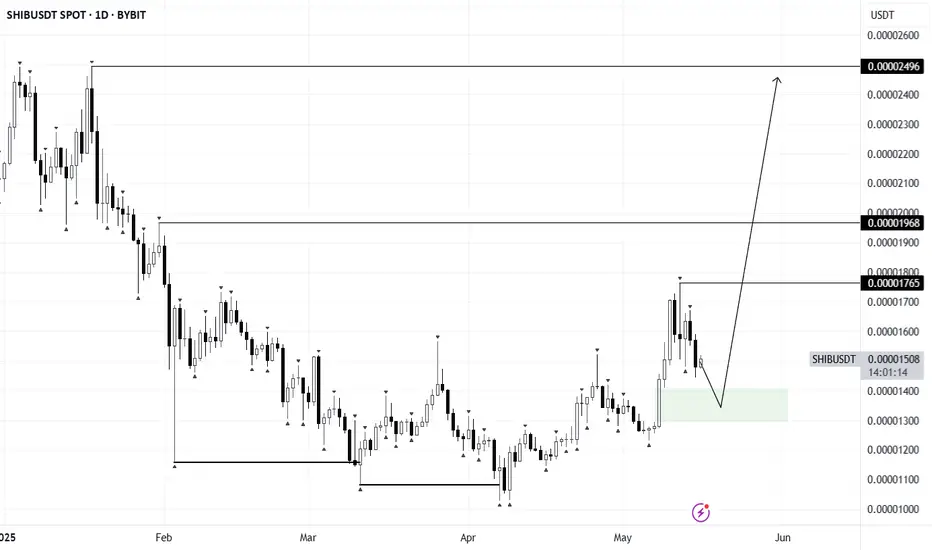
SHIB/USDTWe're seeing liquidity grabs followed by the start of a local bullish move.
Looking to enter long from the highlighted zone, but only if proper conditions and confirmations align.
🎯 Upside targets: 1765 – 1918 – 2496 points
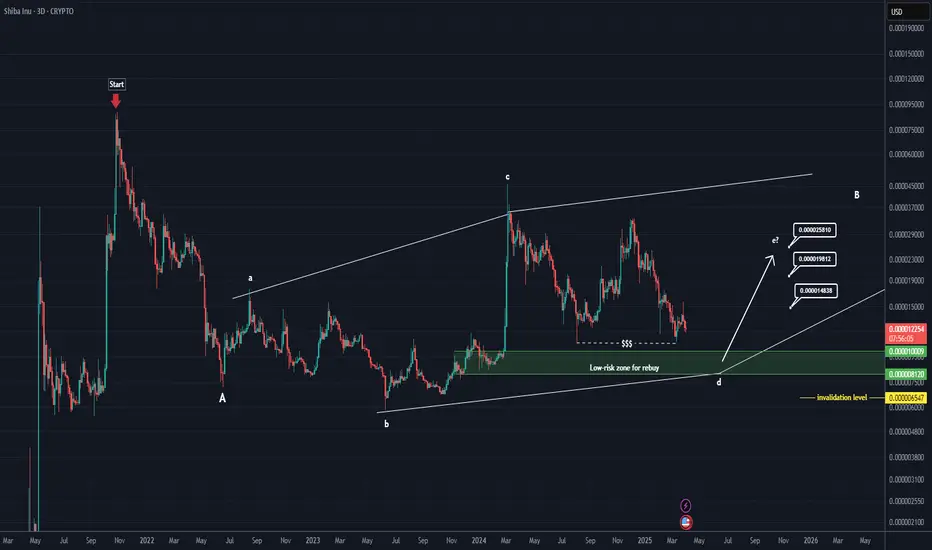
SHIB New Update/Roadmap (3D)The correction for this coin started from the point where we placed the red arrow on the chart.
The price appears to be inside a Triangle or Diametric, nearing the end of wave D.
The green zone is a low-risk rebuy area.
There is a liquidity pool on the chart, which we expect to be swept soon.
Targets are marked on the chart.
A weekly candle close below the invalidation level will invalidate this analysis
For risk management, please don't forget stop loss and capital management
When we reach the first target, save some profit and then change the stop to entry
Comment if you have any questions
Thank You
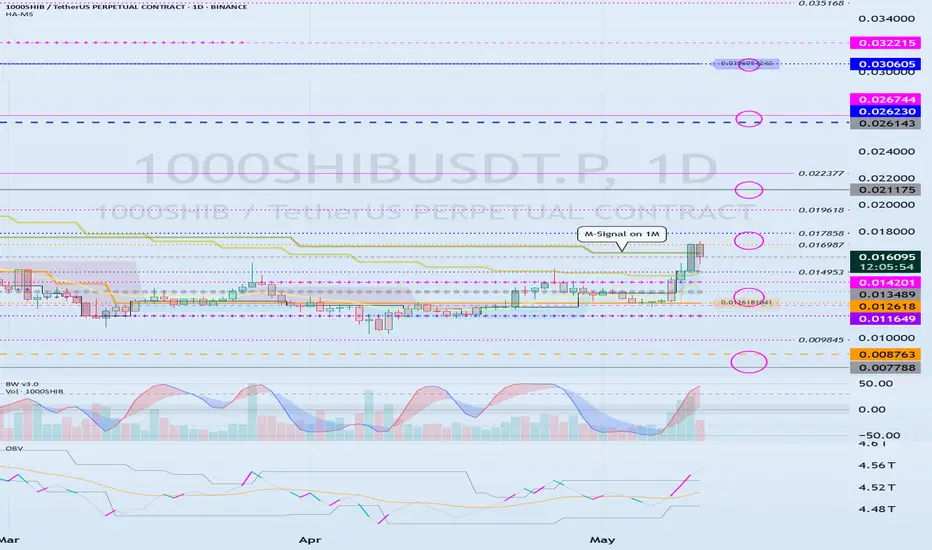
Support and resistance zone: 0.016987-0.017858
Hello, traders.
If you "Follow", you can always get new information quickly.
Have a nice day today.
-------------------------------------
(1000SHIBUSDT.P 1W chart)
The key is whether the M-Signal indicator on the 1M chart can rise above and maintain the price.
If the price rises above the important zone of 0.021175-0.026744 and maintains, the uptrend is likely to begin.
If it fails to rise, you should check for support near 0.008763.
-
(1D chart)
In order to maintain the price above the M-Signal indicator of the 1M chart, it is important to see if it can rise to the vicinity of 0.016987-0.017858 and receive support.
Since the volume profile section is formed at the point of 0.021175, it is important to see if it can receive support in this section.
If it fails to rise, it is necessary to check for support in the vicinity of 0.012618-0.013489.
-
Since the StochRSI indicator has entered the overbought section, it is expected that the rise will be limited even if it continues to rise further.
Therefore, it is recommended to first check for support in the vicinity of 0.016987-0.017858.
-
Thank you for reading to the end.
I wish you successful trading.
--------------------------------------------------
- Explanation of the big picture.
I used TradingView's INDEX chart to check the entire range of BTC.
I rewrote it to update the previous chart by touching the Fibonacci ratio range of 1.902 (101875.70) ~ 2 (106275.10).
(Previous BTCUSD 12M chart)
Looking at the big picture, it seems to have been maintaining an upward trend following a pattern since 2015.
In other words, it is a pattern that maintains a 3-year upward trend and faces a 1-year downward trend.
Accordingly, the upward trend is expected to continue until 2025.
-
(Current BTCUSD 12M chart)
Based on the currently written Fibonacci ratio, it is displayed up to 3.618 (178910.15).
It is expected that it will not fall again below the Fibonacci ratio of 0.618 (44234.54).
(BTCUSDT 12M chart)
Based on the BTCUSDT chart, I think it is around 42283.58.
-
I will explain it again with the BTCUSD chart.
The Fibonacci ratio ranges marked in the green boxes, 1.902 (101875.70) ~ 2 (106275.10) and 3 (151166.97) ~ 3.14 (157451.83), are expected to be important support and resistance ranges.
In other words, it seems likely that they will act as volume profile ranges.
Therefore, in order to break through these ranges upward, I think the point to watch is whether they can receive support and rise near the Fibonacci ratios of 1.618 (89126.41) and 2.618 (134018.28).
Therefore, the maximum rising range in 2025 is expected to be the 3 (151166.97) ~ 3.14 (157451.83) range.
In order to do that, we need to see if it is supported and rises near 2.618 (134018.28).
If it falls after the bull market in 2025, we don't know how far it will fall, but based on the previous decline, we expect it to fall by about -60% to -70%.
Therefore, if it starts to fall near the Fibonacci ratio 3.14 (157451.83), it seems likely that it will fall to around Fibonacci 0.618 (44234.54).
I will explain more details when the bear market starts.
------------------------------------------------------
SHIBUSDT 2D AnalysisSHIB ~ 2D Analysis
#SHIB Buy on retest of this buy zone with short term target of at least 15%+ from here.
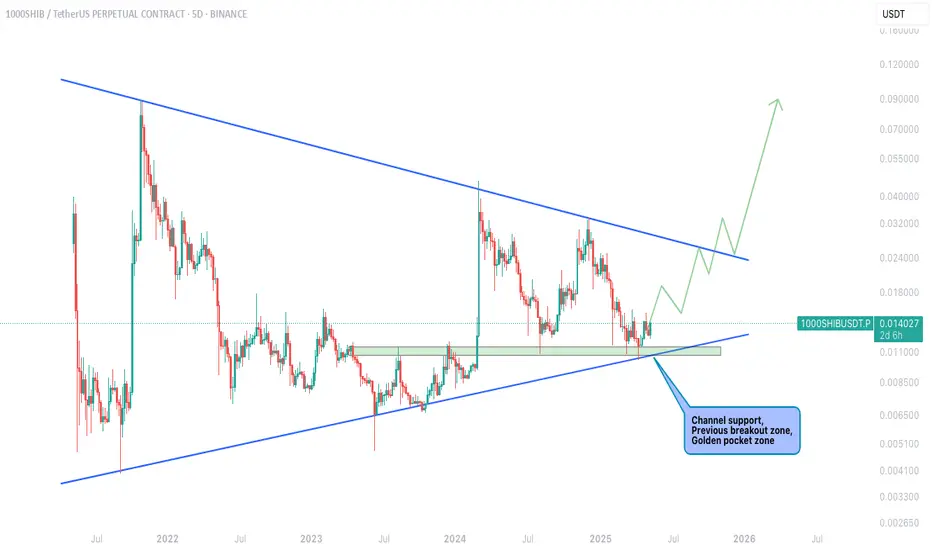
SHIBUSDT – Perfect Confluence Zone Holding Strong!CRYPTOCAP:SHIB has just bounced from a critical confluence zone, combining:
✅ Channel support
✅ Previous breakout zone
✅ Golden pocket retracement
This triple-layered support has historically acted as a powerful launchpad, and the price is already showing early signs of strength.
The price structure is tightening inside a long-term wedge, and a breakout from the upper resistance trendline could trigger a massive upside leg.
First breakout test near 0.024
Potential long-term move toward 0.07+
In shorter timeframe, CRYPTOCAP:SHIB broke out of its long-standing falling wedge pattern and is now retesting the breakout zone. With bullish volume creeping in, this move could ignite a powerful trend reversal toward the 0.0000239 zone. Ideal structure for spot entries with defined risk!
SHIB could be coiling for something massive. Keep an eye on structure and volume.
If you find this analysis helpful, please hit the like button to support my content! Share your thoughts in the comments, and feel free to request any specific chart analysis you’d like to see.
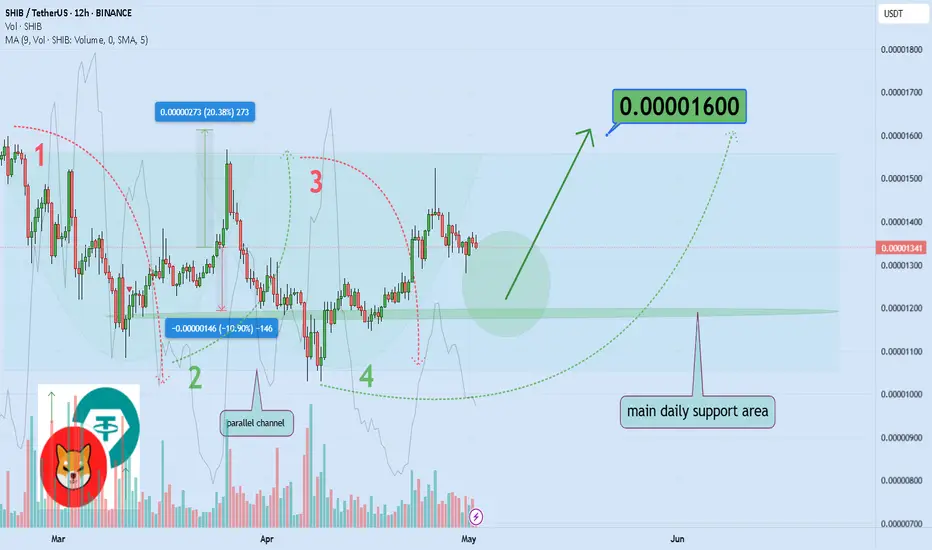
Shiba Inu Eyes 20% Surge, Targeting 0.000016 Breakout SoonHello and greetings to all the crypto enthusiasts, ✌
All previous targets were nailed ✅! Now, let’s dive into a full analysis of the upcoming price potential for Shiba Inu 🔍📈.
Shiba Inu has recently seen an extraordinary surge in trading volume, suggesting imminent large-scale activity likely driven by whales. The asset is currently trading within a parallel channel, indicating a period of consolidation. In the short term, I anticipate a potential price increase of at least 20%, targeting the key level of 0.000016.📚🙌
🧨 Our team's main opinion is: 🧨
Shiba Inu's massive recent volume hints at big whale moves ahead, and with price in a parallel channel, I’m eyeing a 20% jump toward 0.000016 soon.📚🎇
Give me some energy !!
✨We invest hours crafting valuable ideas, and your support means everything—feel free to ask questions in the comments! 😊💬
Cheers, Mad Whale. 🐋
SHIBUSDT Is Flashing Major Bearish Warnings – Are You Ready??Yello Paradisers, Have you been keeping an eye on SHIBUSDT? If not, now is the time. The market is showing clear signs of weakness that could lead to a significant bearish move, and many traders may not be prepared for what’s coming.
💎SHIBUSDT is currently looking bearish after forming a clear bearish Change of Character (CHoCH) on the higher timeframe. Adding to this, the price action on the lower timeframe is showing an internal Change of Character (I-CHoCH) originating from a 4-hour bearish Order Block (OB). This setup substantially increases the probability of a continuation to the downside.
💎What we are focusing on now is the potential pullback. If SHIBUSDT pulls back to fill the Fair Value Gap (FVG) or develops a bearish pattern from the Order Block, it would provide a strong short opportunity with an excellent risk-reward profile.
💎However, it is crucial to remain cautious: if the price breaks out and closes a candle above the identified Order Block, it would completely invalidate the bearish idea, and we would need to step aside from any short positions.
Remember, Paradisers, sustainable trading success comes from patience and disciplined execution. There is no need to rush. Waiting for confirmation will always keep you on the winning side. Be smart, wait for the right setup, and always trade like a professional. This is the only way you will make it far in your crypto trading journey.
MyCryptoParadise
iFeel the success🌴

It is good price to add some shibBoth fractals and patterns show me that shiba is bullish. But we need to wait for the white area to confirm.

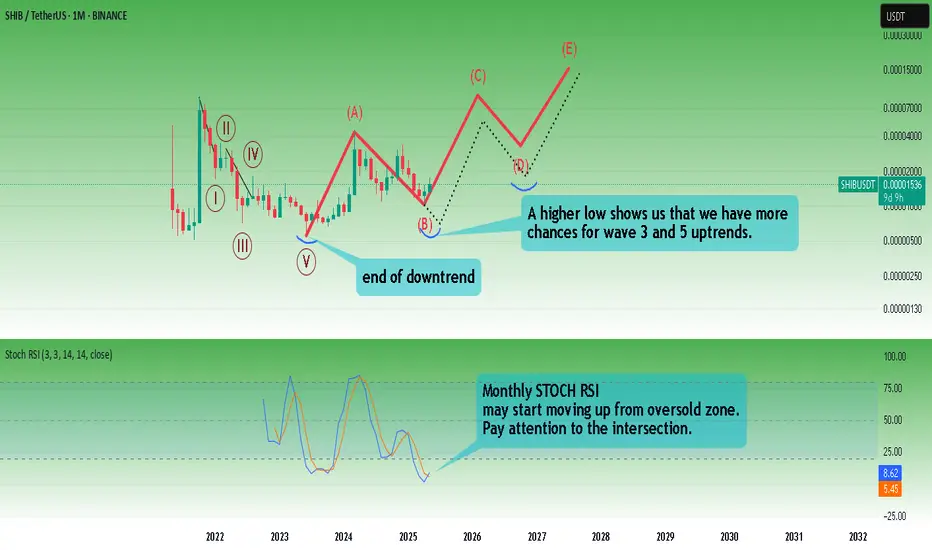
Shiba Inu 1,479% Bullish Wave Starts Now (2025 Bull Cycle)Shiba Inu is now starting a new rise similar to early 2024, February, but much stronger much stronger.
Good afternoon my fellow Cryptocurrency trader, here we have a long-term chart.
The structure of the chart is quite revealing and leaves no room for doubts. SHIBUSDT is bullish now.
There was a correction after the March 2024 high ending in higher low. This then proceeded to produce a lower high and then a new lower low. The action is now bullish as it recovered above the August 2024 low.
Three weeks closing green now, trading green as this one is yet to close. This week is the confirmation as closure happens above long-term support. Touch and go. The action moved below on a wick just to recover, this is a strong bullish signal and when the week ends at 0.000012500 or higher full bullish confirmation is in. The 2025 bull market starts.
Early 2024 was the initial bullish breakout and this breakout produced massive growth, it was great but nothing compared to what is coming next. The next wave will be many times bigger because 2024 was still part of the transition year while 2025 is the bull market. 2026, after the peak and new All-Time Highs, a bear market will develop.
The bear market is followed by a new period of sideways, transition and then a new bull market. The market moves cycles and these are repeated over and over like night and day. 4-years based on the Bitcoin halving. It can extend but most likely it will continue to be the same.
The targets can be seen on the chart. Maximum growth, strong comes ahead.
» A nice target sits at 0.000139 for 894% and new ATH potential up to 1,479% at 0.000220. We will have to wait and see, it is too early but the market is turning green now and will continue to trade green. It can happen that it go higher rather than lower based on the chart. It can happen that rather than overestimating the potential of this pair, we are underestimating it, this too would be good, the more it grows the better it gets.
Namaste.