Shopify Strong Support Long & Possible Continuation Play
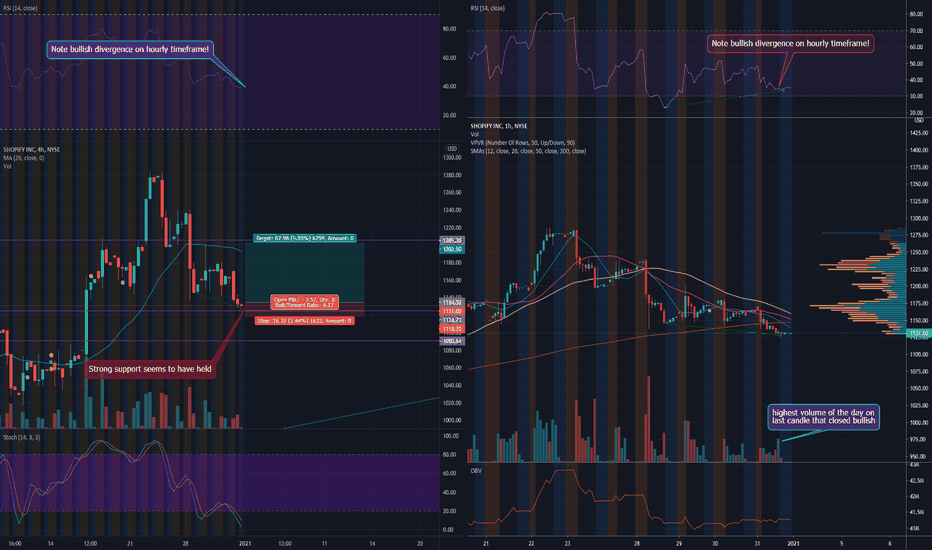
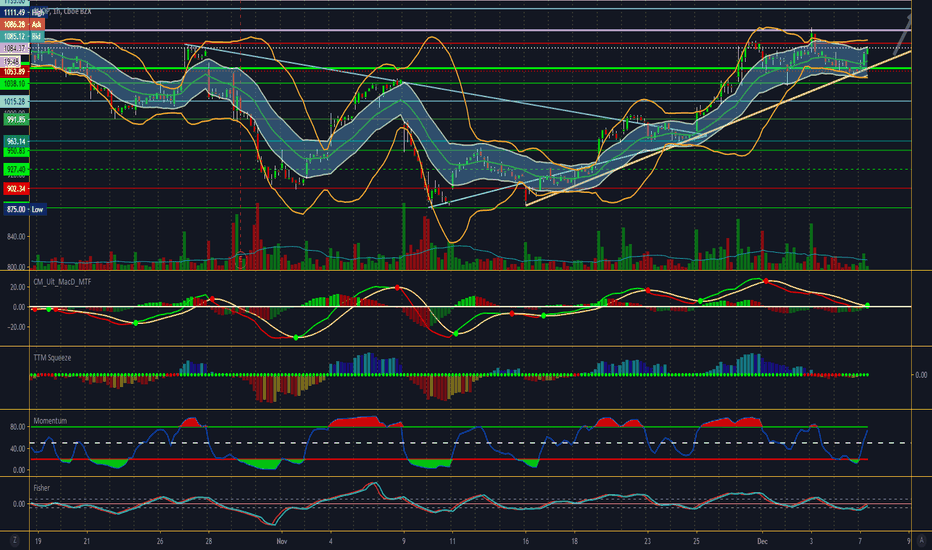
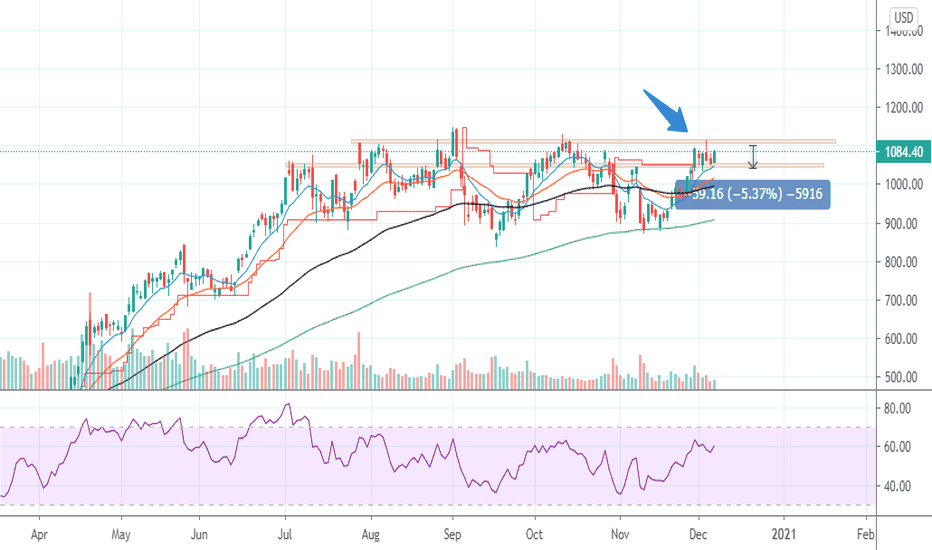
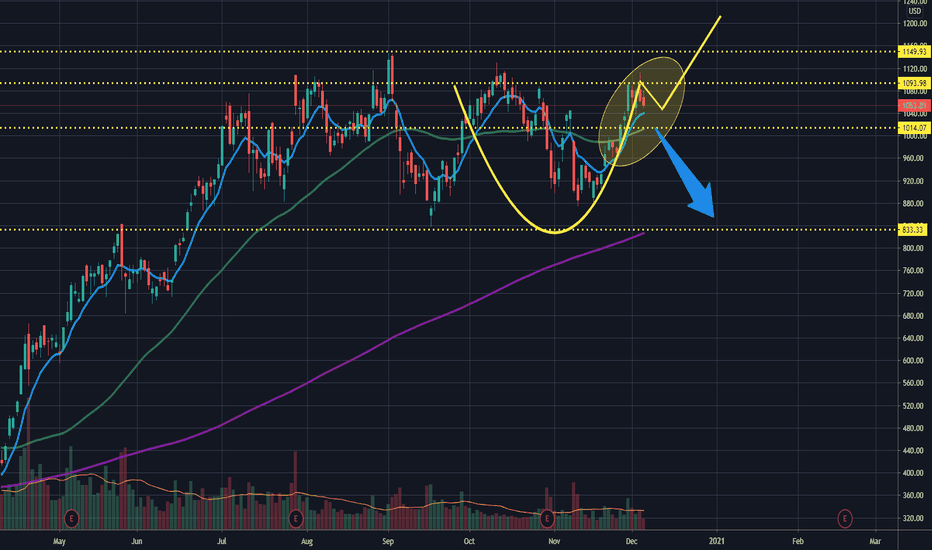
SHOP Daily timeframe seems to be testing top of previous range which is a strong support
Volume dropped until last hour
Bullish divergence on hourly RSI
Bullish volume spike last hour of the day (highest hour volume of the day)
My target is previous resistance range
This Is Not Finacial Advise
SHOP
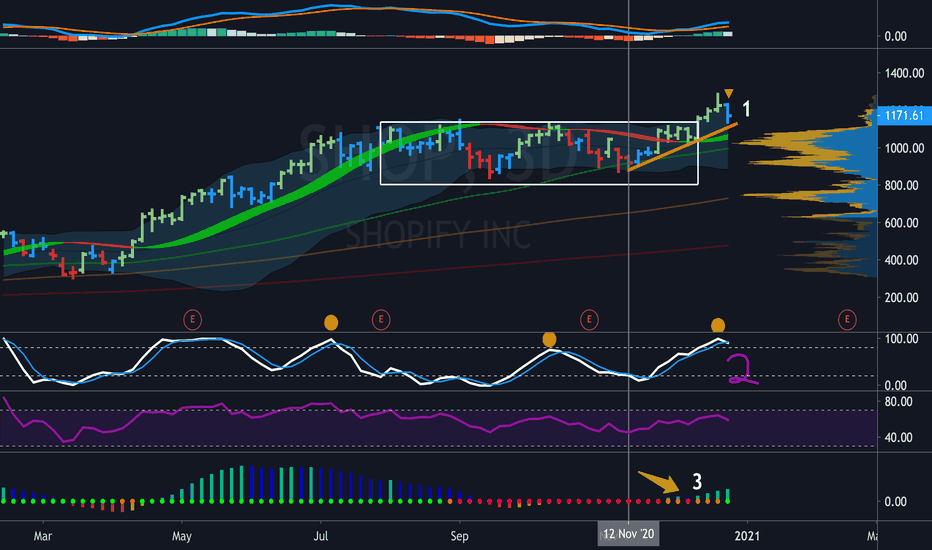
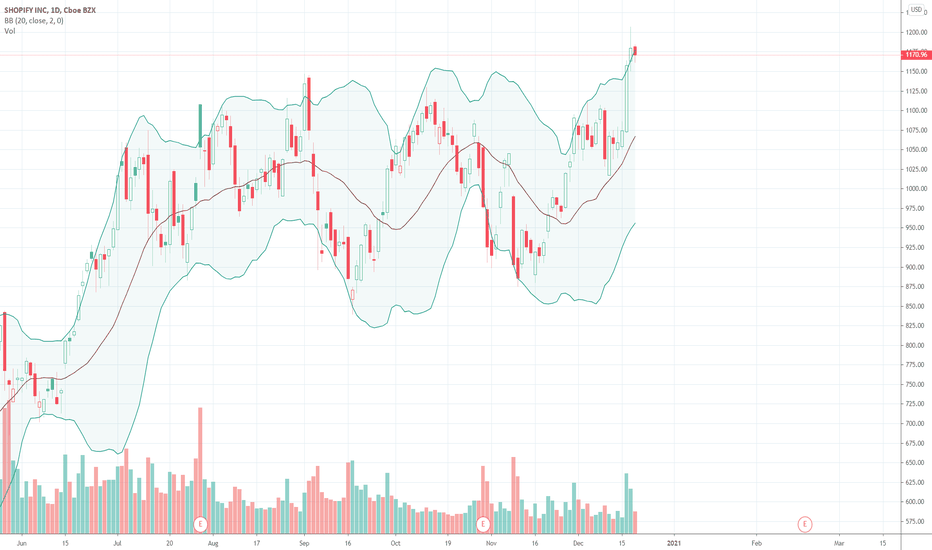
SHOP@1172:Retracement likely to $1000 from a 40% gain of Nov LowThe stock gained near 40% from its Nov low of 860 to a recent high of 1285, propelled by a 3D Squeeze that fired for 7 bars. Squeeze usually fires for 7 to 8 bars, so we are likely entering a consolidation phase with a probable retracement to $1000 or 50 MA.
It's Stoch/RSI has a good history of forecasting price trajectory and the last candle also hinted at a high open/low close.
SHOP is very liquid and not subject to a short squeeze, other than enthusiastic buyers who have demonstrated less power to move growth stocks in the past week or so. There is a hint of rotation from high powered names to companies with real profit.
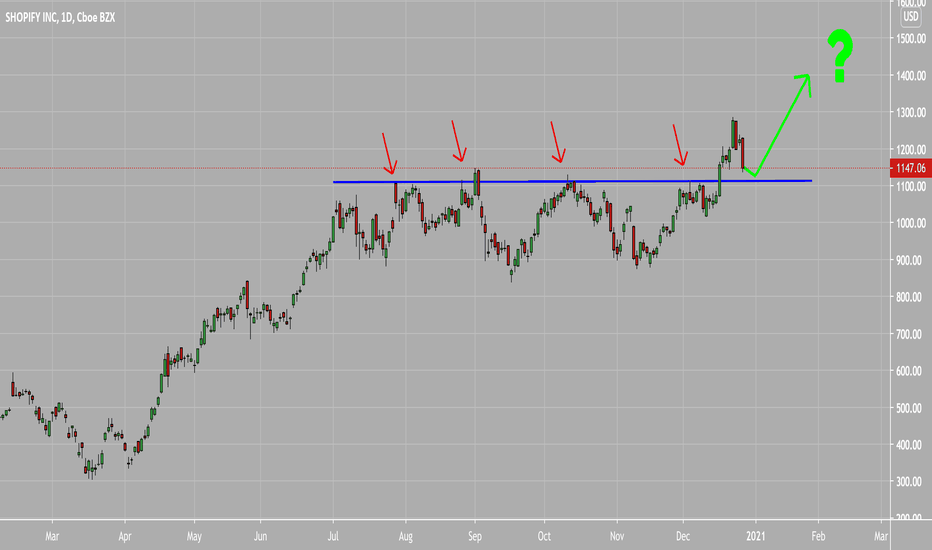
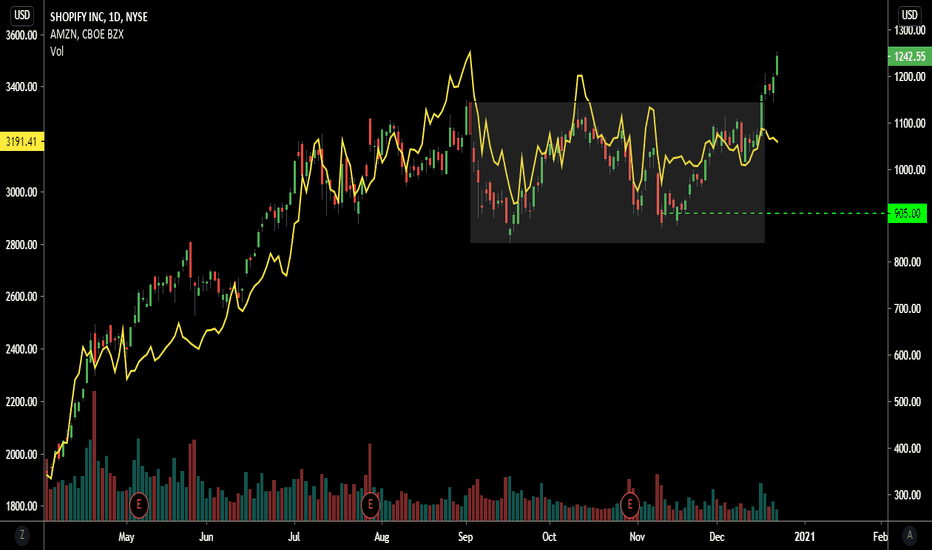
Only clear skies ahead?Our range play has turned into a full continuation phase to the upside. We couldn't have predicted this strong of a bounce it has even outperformed AMZN. I could list a series of "fundamental stories" for why it has had a great run but when you trade with a model you don't have any. As long as shop holds above its previous range state and the net up vs down volume stays positive we will continue to hold.
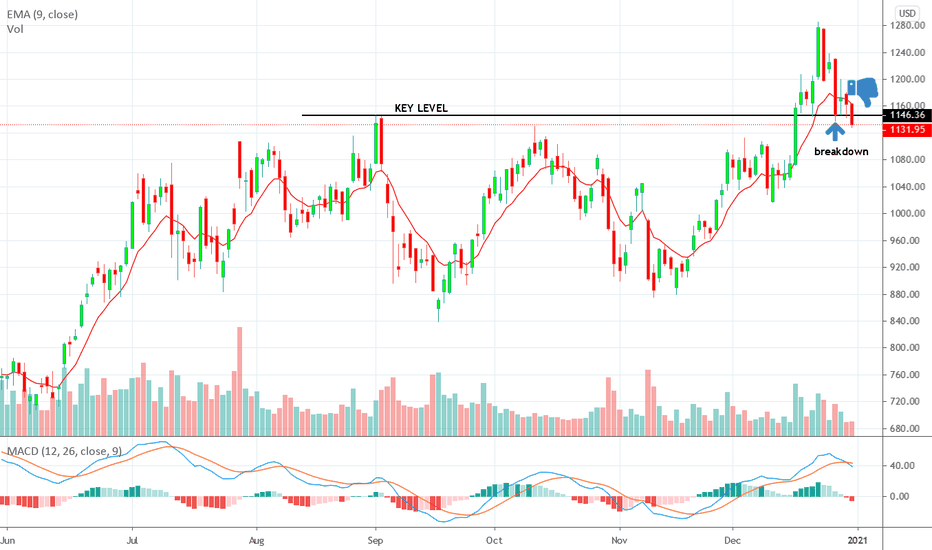
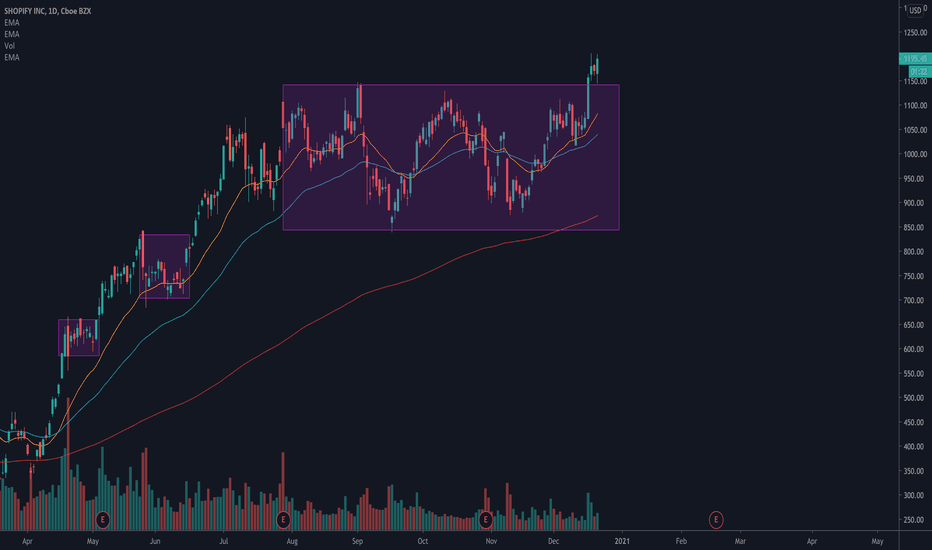
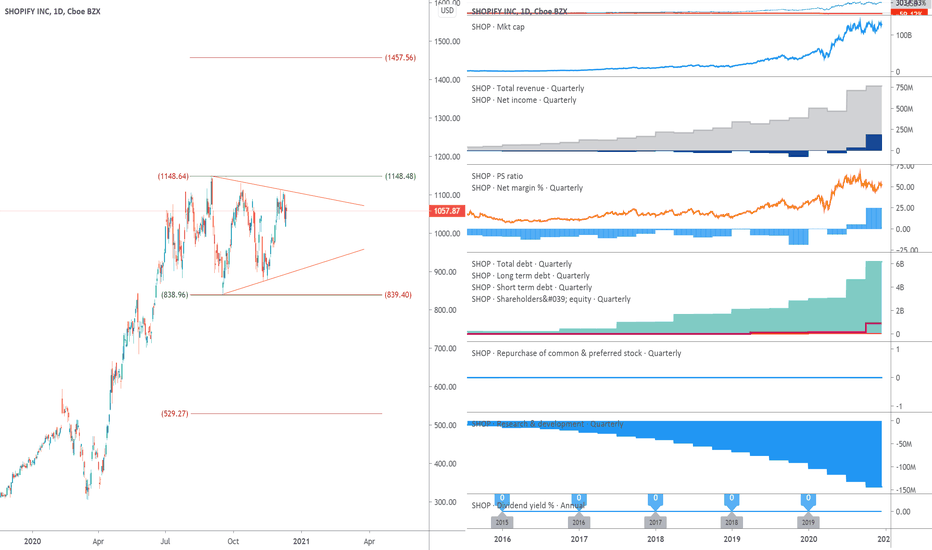
$SHOP breaking out and held its backtest$SHOP has been ranging for a few months now. It has finally broken out and held its backtest.
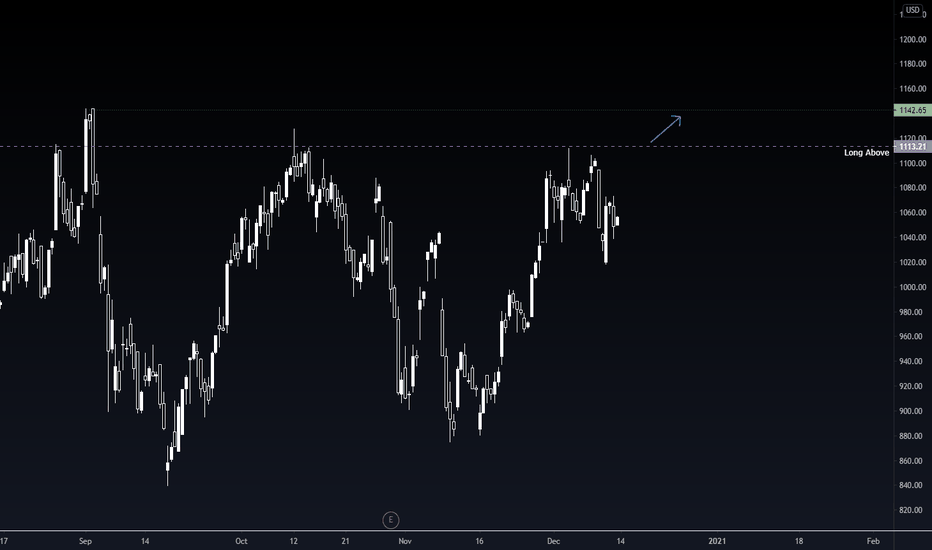
$SHOP - Long above 1113 - #SHOPThere's a huge resistance line at 1113. I intend on going long above 1113 and take partial profit around 1142, the previous ATH. I'll likley leave some runners to aim for 1200.
Shop is breaking out again! may test 1107SHOP is breaking out nice again...We may test 1107 but SHOP has to get through 1093 first. Then next big speed stop is 1134..my one concern is Volume is below the 90 day average...will see
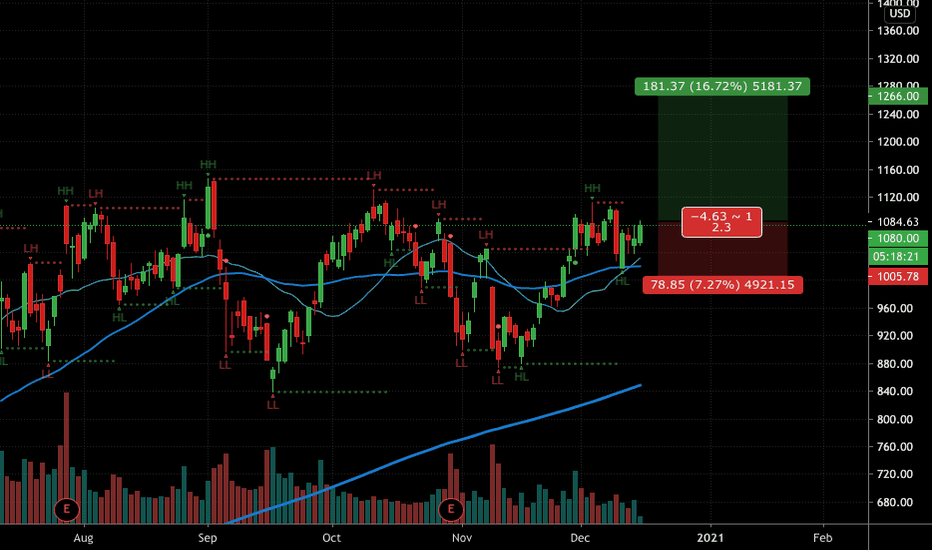
SHOP handleSHOP has formed a nice little handle here presenting nice R/R. Im in from a little bit lower when I found a little entry. The stop is wide, but if we break higher, I may add to the position and raise the stop. Will be stalking.
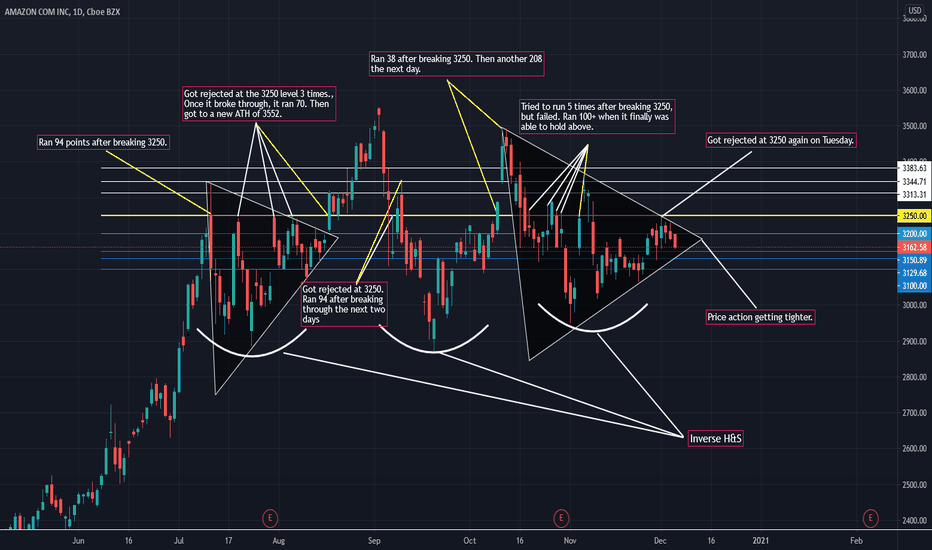
AMZN These are the things I look for when drawing my levels. I don't use any indicators because I believe they can be misleading and cause an inadvertent bias. I look at a trade from multiple angles. Its not as simple as entering into a trade just because a stock broke a level. You have to align your trade with News events, Upgrades, Strength of sector, Strength of market etc..
1. Analyze price action
I look at how many times a stock fails at a certain resistance area.
i.. If AMZN fails at 3250 multiple times, that means that's a strong level. and when it finally does break, a big move can happen.
2. Stock Patterns
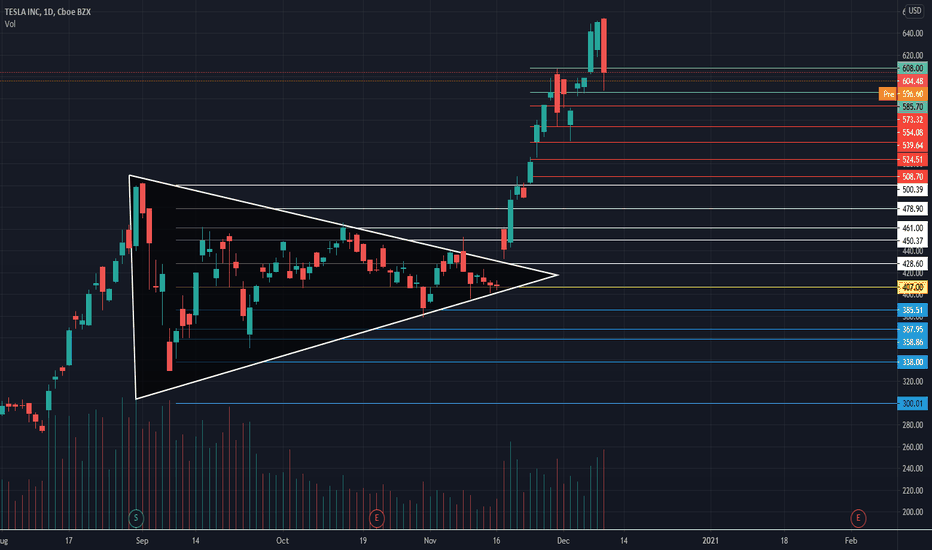
a) Pennant, Bull Flag/Bear Flag, H&S/Inverse H&S, Wedge, ascending/descending triangle
2. Correlation with SPX/SPY
a) Is AMZN moving up while SPX is moving down? This indicates that AMZN price action is strong. Is AMZN moving down with SPX moving up? This indicates that AMZN price action is weak.
b) You also have to look at what the stocks in the sector you are trading are doing. Say AMZN does break 3250 but the tech sector is weak that day, and SPX is weak, this can drag AMZN down.
3. News.
I check pre-market for news every morning. Did the stock get an upgrade/downgrade? Is there any news being anticipated?
If you are are patient and wait for breakouts at key levels, these types of trades can present a great risk/reward ratio. You don't need to trade everyday. You can make 25-30 trades a year and make $100k+ relatively easily while only risking a small amount of money. Don't be in a rush to trade everyday. Preserving capital and just waiting for the best setup is 80% of trading.
