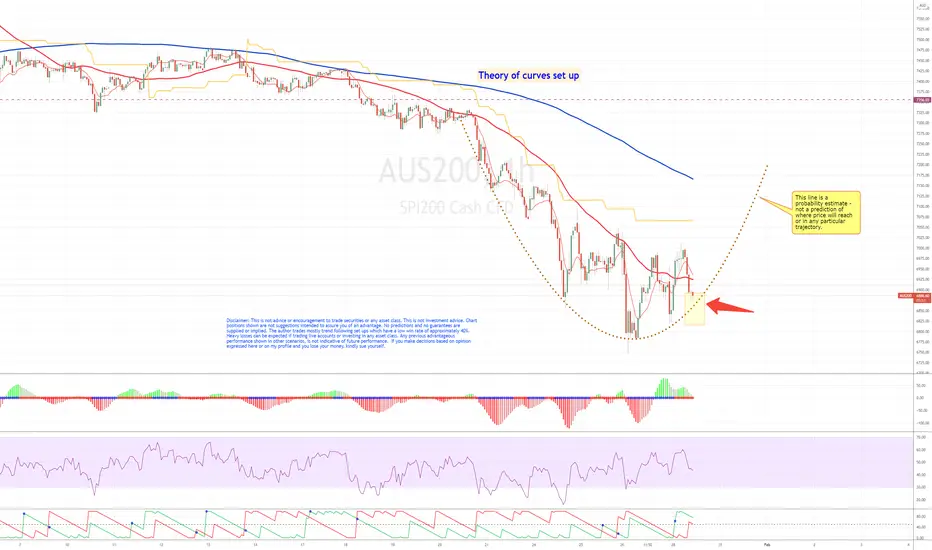
AUS200 (1H): Potential move northThis is a theory of curves setup (TOCS) ; looking at the price action of the AUS200.
In TOCS, thee is usually a 55% chance of movement in the leading half of the curve (based on personal experience). Better than 50% is good in finding entry points for trend following positions. Zoom into the chart if text overlaps candles.
The AUS200 has been curving up nicely. Of course charts don't obey these curves - that's why there is a remaining 45% chance of the setup failing.
There is no target for an exit point in trend following. So, entry is the big issue. Exit points are determined by the market when price moves threw a trailing stop on a lower time frame. There is no prescription as to how to work that out because it depends on the price action in a lower timeframe. It is no possible to know that until if happens.
What's in favour of a north side attempt? Always look higher e.g. the daily time frame where the RSI is in a deep trough and which will appear attractive to 'punters'.
Disclaimer: This is not advice or encouragement to trade securities or any asset class. This is not investment advice. Chart positions shown are not suggestions intended to assure you of an advantage. No predictions and no guarantees are supplied or implied. The author trades mostly trend following set ups which have a low win rate of approximately 40%. Heavy losses can be expected if trading live accounts or investing in any asset class. Any previous advantageous performance shown in other scenarios, is not indicative of future performance. If you make decisions based on opinion expressed here or on my profile and you lose your money, kindly sue yourself.
Short-long
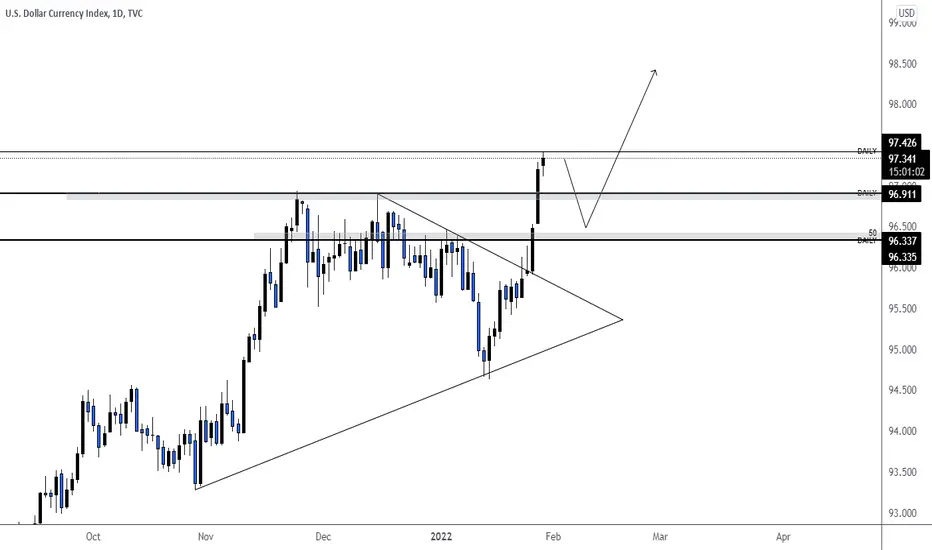
DXY 28/01/2022Looking for pullbacks before continuation of bullish momentum.
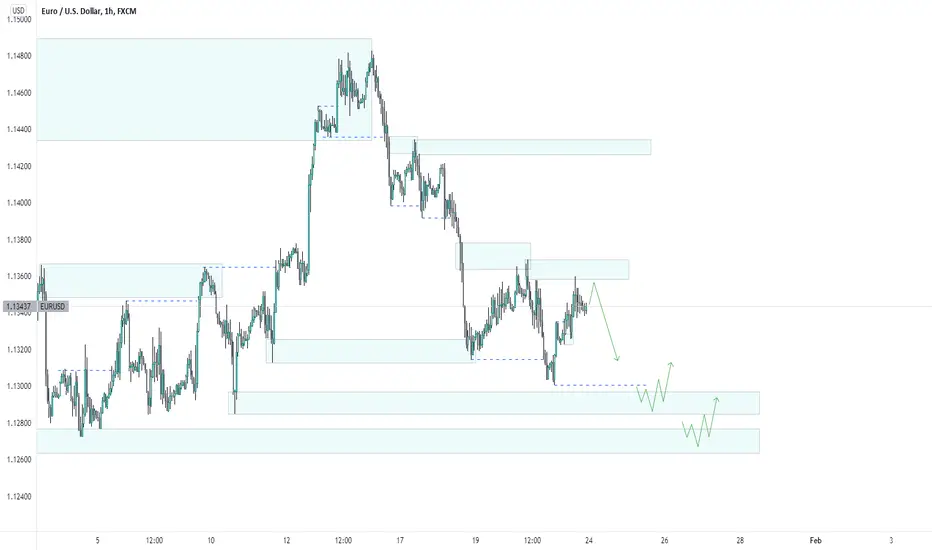
After this weeks fundamentals (FOMC) - DXY is over extended, so I would like some pullback. If we could get a pullback, it means that we could have some pullbacks on: GBPUSD, AUDUSD & EURUSD, before a continuation to the downside.
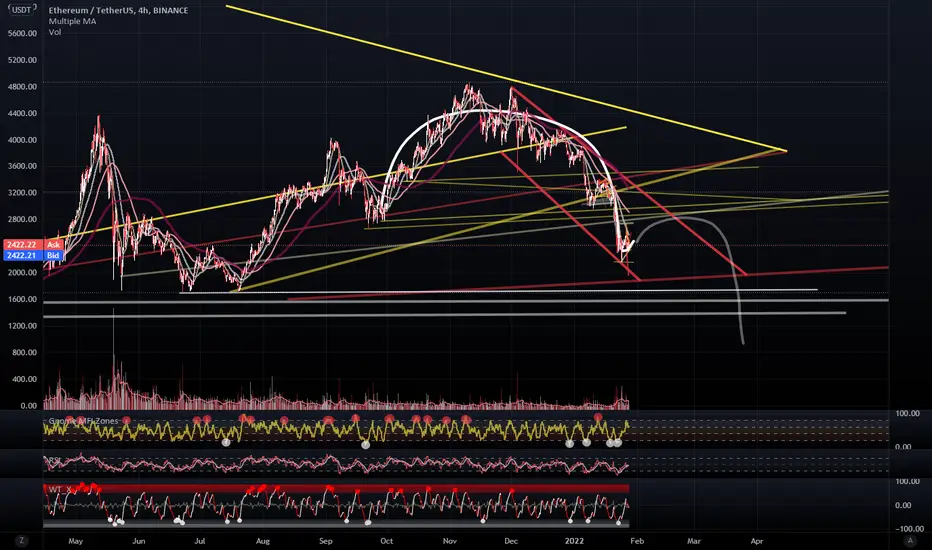
Eth might be forming a weak HNS on the daily...Just hypothesizing.....eth either just tanks from here or does a wave up to complete a weak HNS/inverse cup and handle pattern, similar to what BTC has on its daily chart.
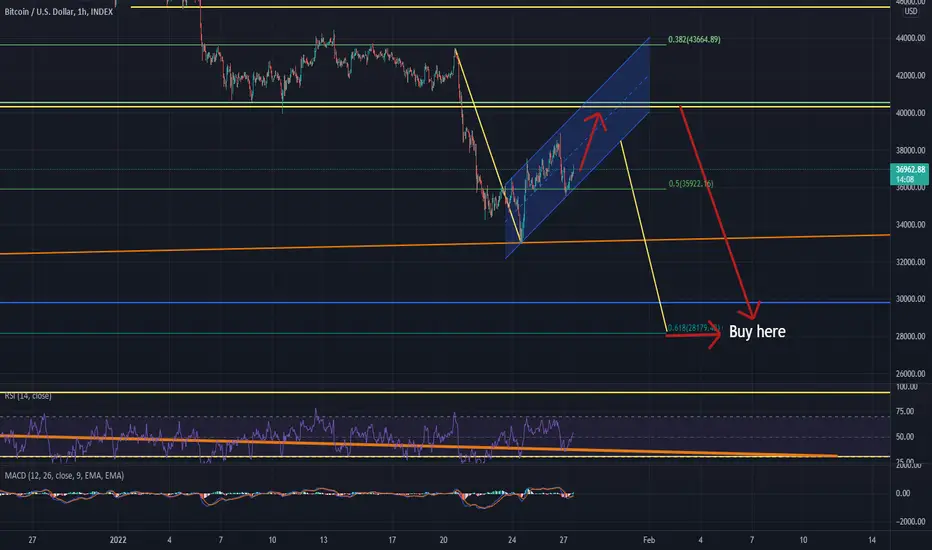
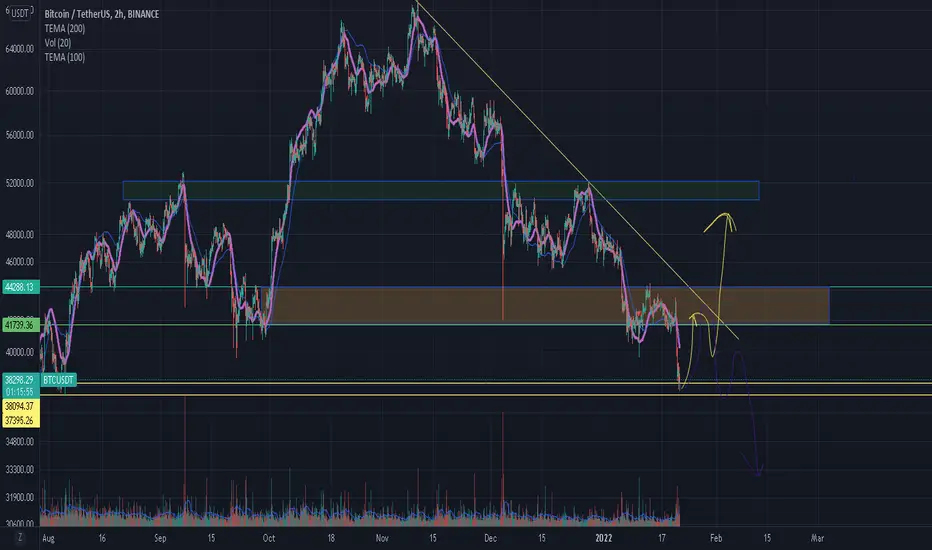
Hitting ~28k$ very soonBTC does look like its forming a bearflag. Could potentially hit the big resistance at ~40k$ before breaking out of this channel to the downside.
Pricetarget of this bearflag is at ~28,1k$ which would automatically mean we hit also the golden ratio.
This would be the best target to reach to be able to reverse the market and continue with the bull market.
To the guys who are familiar with elliott waves:
In my opinion wave C should be finished quite clearly once we hit the 40k$ and come down to 28k$ then.
Please just correct me if I am wrong.
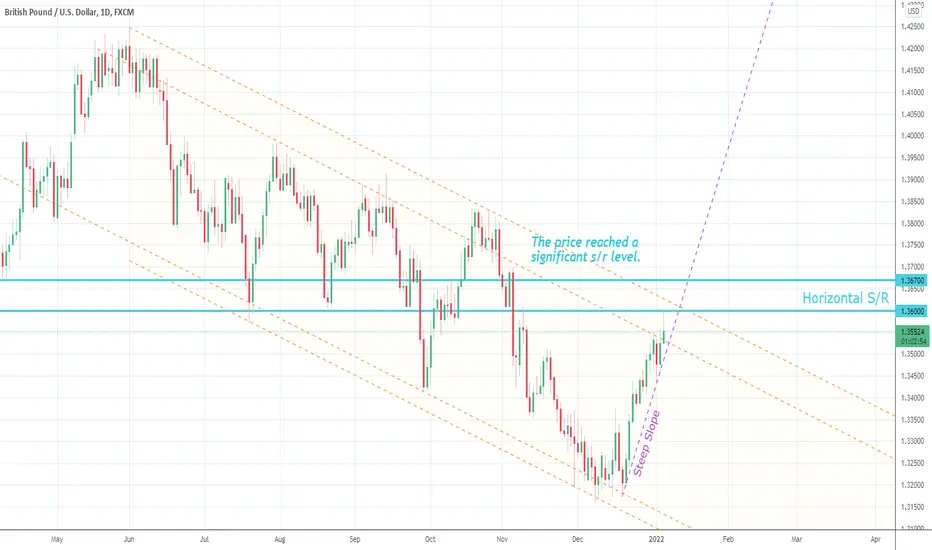
GBPUSD reached resistance (1D) 5 Jan 2022GBPUSD has been seriously on the rise, but can it break resistance areas and the channel's upper bound?
Where do you guys think it is headed?
DAX: DEATH CROSS - BEWAREThis is a death cross on the 4H time frame. It may not show on many higher time frames.
Some traders wait to see the death cross on the 1D time frame. By the time that develops, the market is ready to rebound.
I always stay 'under the hood' of the daily time frame, cuz that's where the action begins.
The 4H is my fav time frame to get an idea of what's happening, based only on my experience.
The DAX and other indices have basically followed Wall Street and the NASDAQ - they're all interconnected by undersea cables. Some $USD 10 trillion in financial transactions pass in those per day.
Anyways the markets have been so heavily pumped that I don't think the FED can save them now. This time around in contrast to 2020, it is so overheated it's now become silly.
Air money cannot support markets forever. Right now people are losing billions (collectively) as the markets head south.
Will they throw in the towel? Not soon enough.
If you're a trend follower the 2H or 4H ATR lines are nice ones to follow.
Disclaimer: This is not advice or encouragement to trade securities or any asset class. This is not investment advice. Chart positions shown are not suggestions intended to assure you of an advantage. No predictions and no guarantees are supplied or implied. The author trades mostly trend following set ups which have a low win rate of approximately 40%. Heavy losses can be expected if trading live accounts or investing in any asset class. Any previous advantageous performance shown in other scenarios, is not indicative of future performance. If you make decisions based on opinion expressed here or on my profile and you lose your money, kindly sue yourself.

EURJPY short term buy and continuation sell setupa setup on how I got the small term buy to about 128.900 area. market is currently ranging at the moment. expected for it to hit trendline, resistance line and fib 61.8 before it continues down to 127.500 in the demand zone

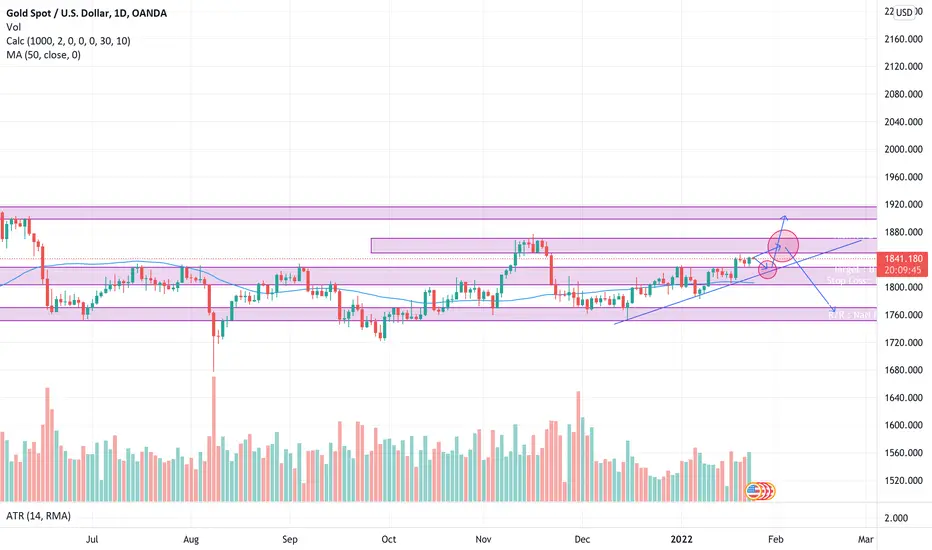
Long or short on goldOff the basis of the levels of support and resistance in the past I feel these are the two out comes possible… as I always say like many others, Remember to be reactive and not predictive. So wait for the setups :)
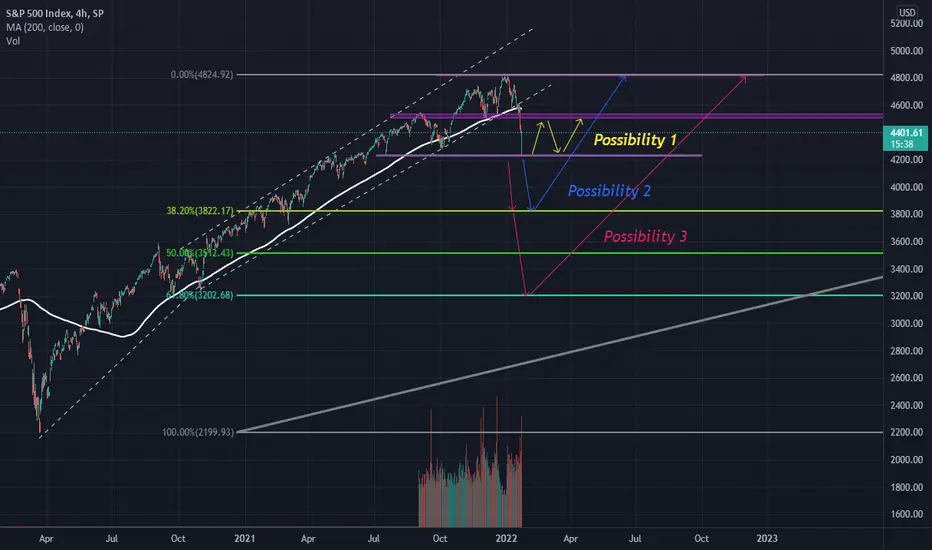
SPX in the next days.Hello everyone. Today we're gonna see the different possibilities for SPX in the next days.
We have a good opportunities to trade in short and long but don't forget manage your risk.
Possibility 1: Just trade in the laterals for short or long trades.
Possibility 2: We should wait the price break the resistence and wait for pullback, then we can looking for short trade. If your trade down to the 38% of Fibonacci, we should wait to decide if we have opportunities to have a long or short trade.
Possibility 3: If we entered in the possibility 2, we can trailing the trade and get more ratio of benefits.
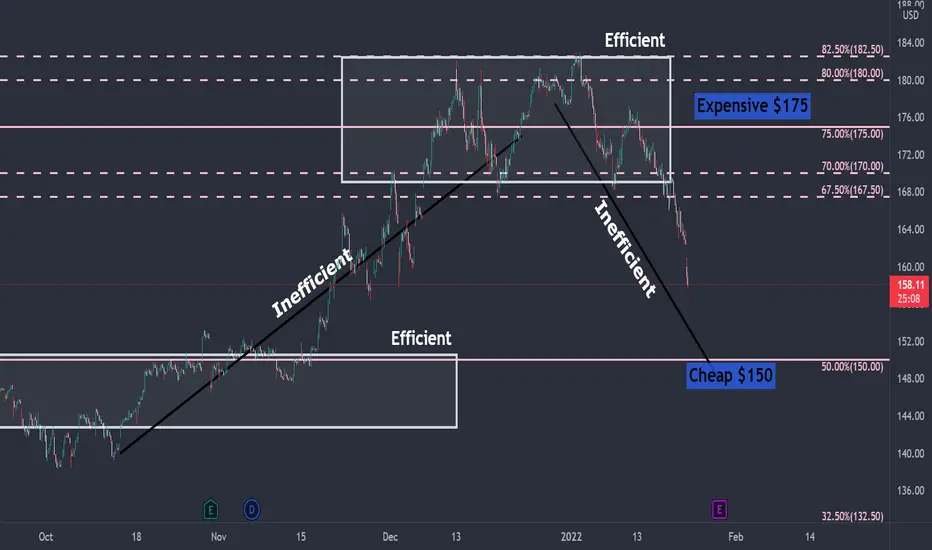
APPLUless the dollar began a new trend down I would not long any stocks. APPL is Expensive at $175 and Cheap at $150 best move would be to wait till an efficient market appears and take the trade rather than taking a trade based on the PA now
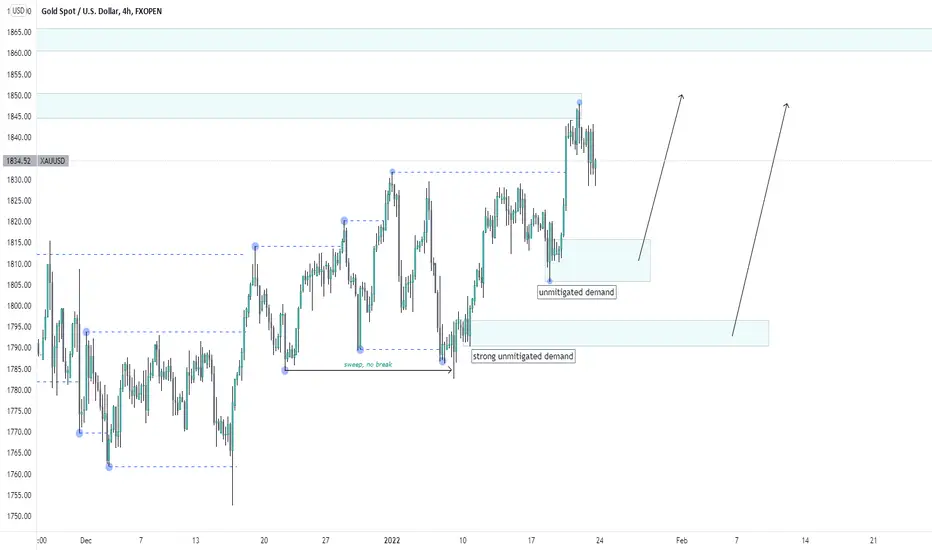
XAUUSD BearishGold is now showing weakness and is breaking structure on lower timeframes I will be looking for shorts and buys when we enter one of those demand zones. when we hit a demand zone I will patiently wait for a clear break of structure
and clear demand.
keep in mind we are still bullish on higher timeframes!
this is no financial advice!!
BTC heading to an inevitable ~30,000k markBitcoin is heading down towards an inevitable ~30,000k mark in correlation with July 2021 mark.
Triangle pattern, Linear Regression and Fibonacci.
Long term shorts will be profitable
Traders should prepare long trades to trigger at sub ~30k marks.

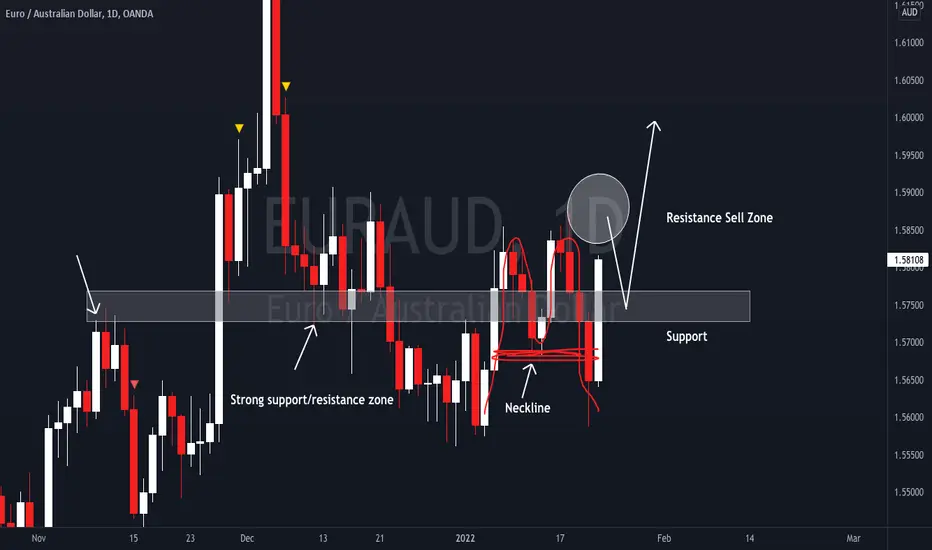
EURAUD Bounce from Resistance and More UpsideWelcome back! Here's an analysis of this pair!
** From the daily perspective, the market has completed an "M" pattern and broken above the neckline of the pattern. We can expect a retest of the previous support before a potential rejection to the upside.
Do you agree? Let us know your thoughts in the comments!
Please support this idea with a LIKE if you find it useful and Click "Follow" on our profile if you'd like these trade ideas delivered straight to your email in the future.
Thanks for your continued support!
Brian & Kenya Horton, BK Forex Academy
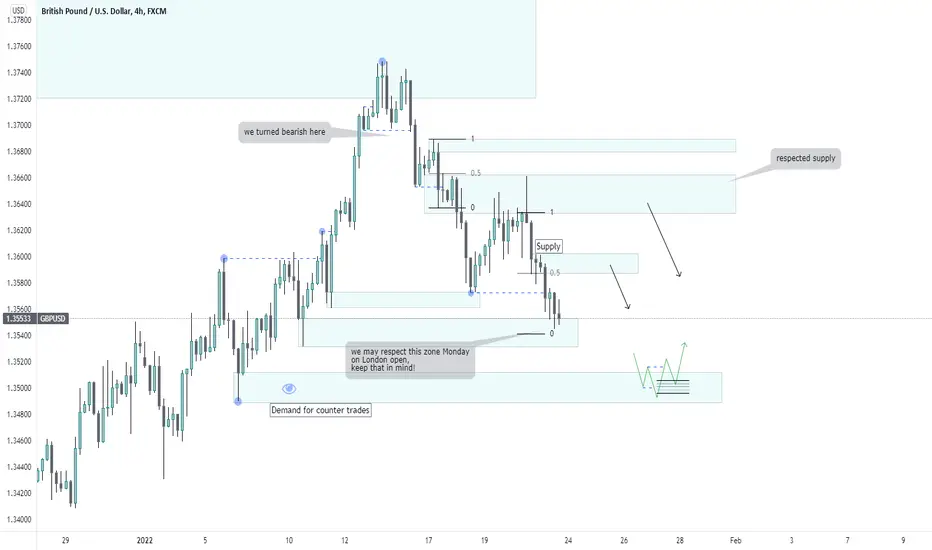
GBP USD Bearish Moves!!GBP USD turned bearish and I will be looking for shorts. Maybe some long counter trades but that really depends on the market structure. As you can see is we have a supply above us and we maybe have a break of structure there to short from. We are now landed on a demand zone and we maybe will respect it to retrace into our first supply, keep an eye out on these zones on the lower timeframe.
this is no financial advice and don't ask me when to buy or when to short I'm only here to show how I look at the market!
EUR USD incoming Demandeur usd is still bullish and we are about to enter the demand zone soon but first I will look for shorts to the demand zone and from there I will be happy to look for buys
this is no financial advice.
and don't ask me when to buy this is not a signal page! it's for the people that wanna know where to look at!!
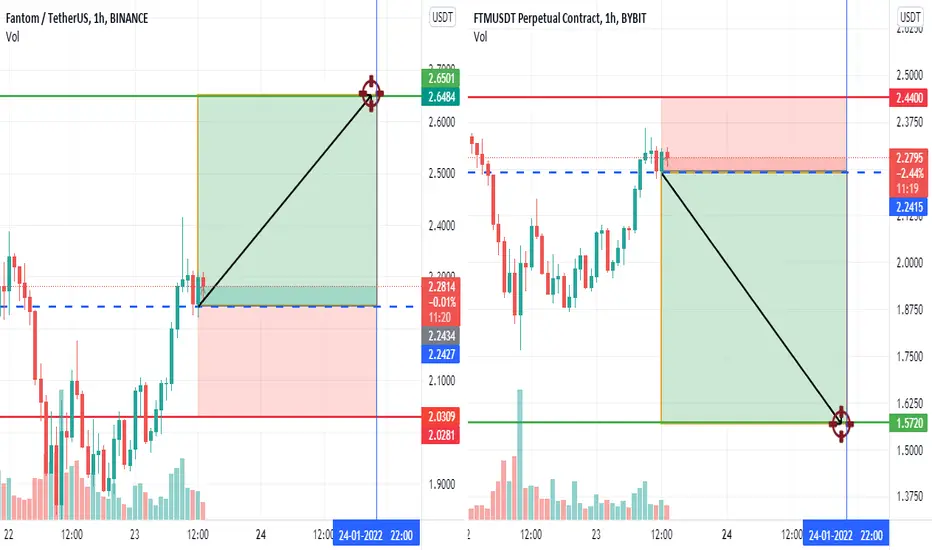
FTM/USDTHello everyone, if you like the idea, do not forget to support with a like and follow.
leverage trade 9x 😉
#ftm #ftm/usdt #bitcoin #btc #btc/usdt #leverage #short #long #crypto #cryptocurrency
Why Your Shorts Are Not Winning - Part 2The trend continues to be your friend until the very end.
This is 2 day chart that I posted in the beginning of the year that continues to be in play since the COVID meltdown in early 2020.
Price has been in a strong uptrend with very few pullbacks. Even the pullbacks result in dramatic reversals and pumps to the upside.
Here is where it gets interesting. We are approaching the top of the channel and the last time we touched the top of the channel, we had a strong pullback.
Is the market melting up, only to reach the top of the channel and turn back? Is price going to breakout of this huge channel? I think we're going to find the answers to these questions very soon.
Good luck. Never play the breakouts, wait for the retests. When it feels really right, it's probably wrong, and when it feels very wrong it's probably right.

GETTING READY: Looking back to 2020In this video I look back to early 2020, to see how the 40% collapse in the DJI happened.
Am I preparing for a collapse or correction? Yes I am. Preparing does not mean I am predicting.
What is see looking back is, that a 2 hour ATR trend south had developed. It is the best fit. I had tried 1H trend but that did not fit well enough, where price would stay below he ATR line.
This index has been pumped up on implicit guarantees coming from the FED. We saw a similar scenario in the mortgage markets around 2008.
Readiness is everything. When you're in a trend down, you won't really know for sure because you can't see the whole trend, like we see now looking back to 2020.
This time around, I'm getting ready. The last major correction occurred in Feb 2020. So I am on high alert all now. I'm watching every 2hour switch.
Disclaimer: This is not advice or encouragement to trade securities or any asset class. This is not investment advice. Chart positions shown are not suggestions intended to assure you of an advantage. No predictions and no guarantees are supplied or implied. The author trades mostly trend following set ups which have a low win rate of approximately 40%. Heavy losses can be expected if trading live accounts or investing in any asset class. Any previous advantageous performance shown in other scenarios, is not indicative of future performance. If you make decisions based on opinion expressed here or on my profile and you lose your money, kindly sue yourself.

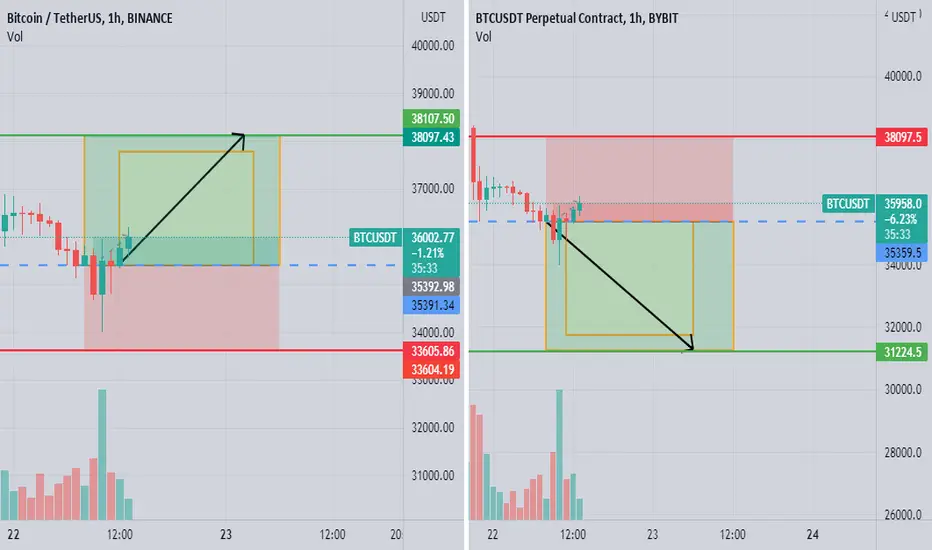
BTC/USDTHello everyone, if you like the idea, do not forget to support with a like and follow.
leverage trade 35x ;)
btc dip analysedbitcoin will test a pump but if we don't hold 41k will dip to 35k after 32.5k , if you gays want to use features be carefull wait for suport confirmations , the bear market started
DAX: Head and Shoulders pictureIt looks like a head and shoulders to me on the 4H time frame, but always debatable.
Sentiment changed on this index many days ago, as seen in the 4H ATR line (on this time frame only).
This short setup is for true trend followers (not trend continuation). That means it is much higher risk to much higher reward ratios.
There are stop losses in trend following, but no predefined exit points. The markets decide the exit.
As usual you take your own risk and your own losses.
Disclaimer: This is not advice or encouragement to trade securities or any asset class. This is not investment advice. Chart positions shown are not suggestions intended to assure you of an advantage. No predictions and no guarantees are supplied or implied. The author trades mostly trend following set ups which have a low win rate of approximately 40%. Heavy losses can be expected if trading live accounts or investing in any asset class. Any previous advantageous performance shown in other scenarios, is not indicative of future performance. If you make decisions based on opinion expressed here or on my profile and you lose your money, kindly sue yourself.

Zoom almost bottomed will consolidate between 180-220Zoom is a great company to hold on to , But you cant judge based on shorter timeframes. You need to start Dollar Cost Averaging in this Range for the next 18-24 months. This is where the consolidation happens. I have 200 shares and ready to buy 400 more for the next 2 years, I am long in 5 years time horizon, but in the near term 180-190s is in the cards, Hence Short.

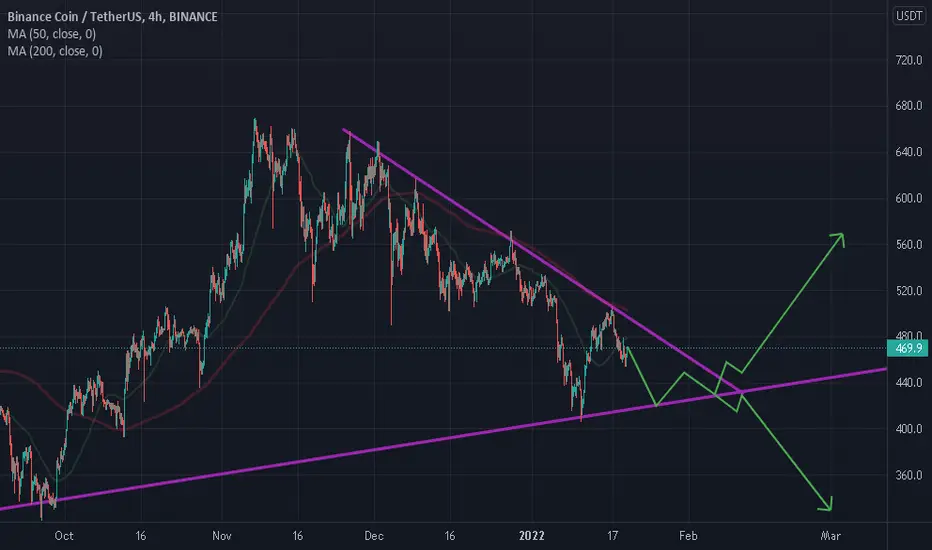
BNBBNB Continually respecting the upper triangle line, soon it Break out lest see which direction because there is 2 trend lines 1st is main support line and 2nd is resistance line.