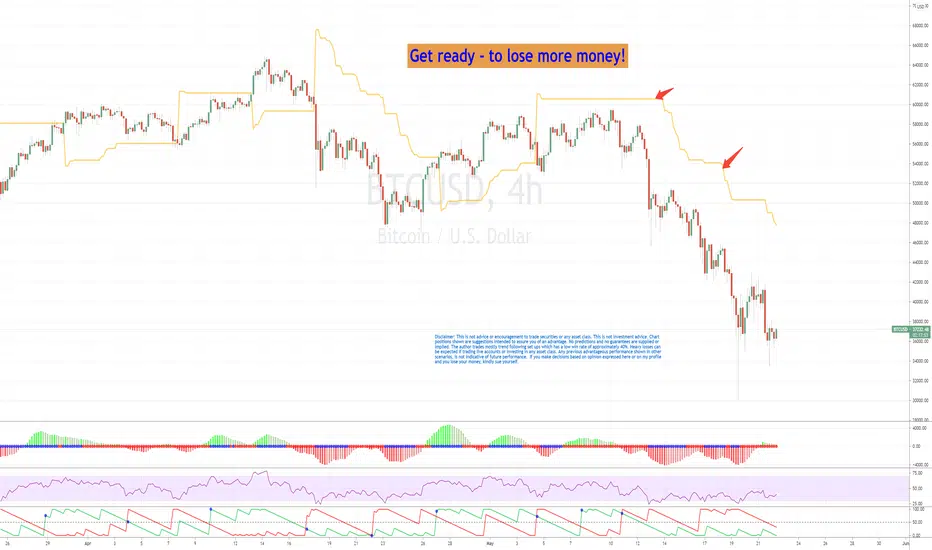
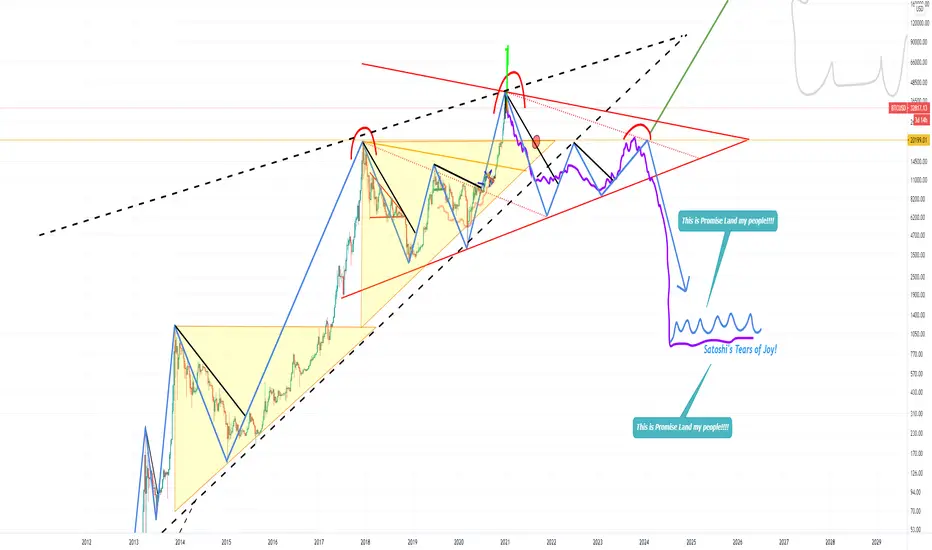
BTCUSD: Diamond hands? Make more or lose more. Some will learn, some won't learn and some need to feel the pain but still won't learn.
Few may recall that recently (linked post below), I said that the sharp switch on the Daily ATR was indicative (not predictive) of a trend switch for the south.
That was transformed into a other lower time frame trend switches. On this chart you see a flattening of the 4H ATR then price collapses. The reasons are not important because this is technical analysis (TA). TA tracks the collective direction of sentiment and has built in many of the underlying fundamental issues.
The 4H time frame is important in about 75% of all trading instruments - which doesn't mean that you just jump in on first sign of a 4H switch (long or short).
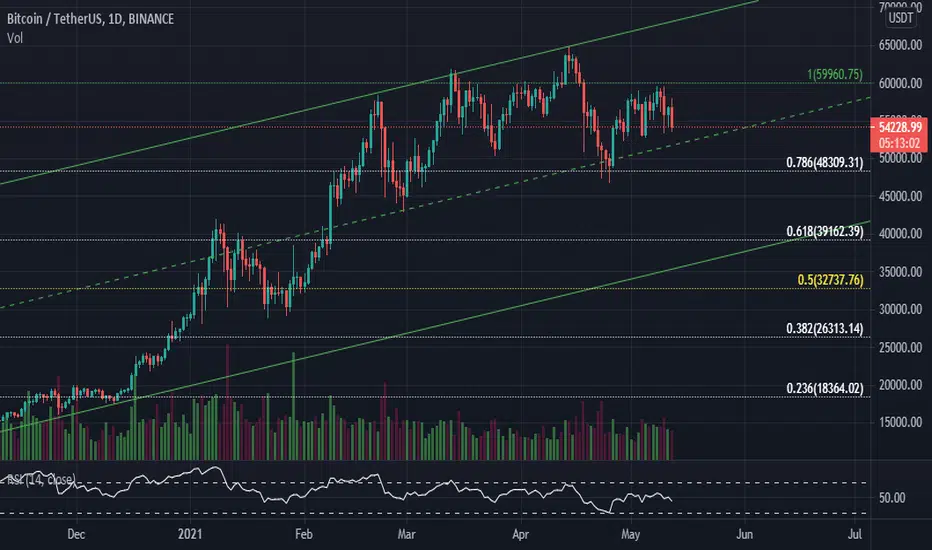
In the 4H scenario shown here, I fully expect (not predict) price to return to a 'psychologically magical' $50,000. If it does short-sellers will be looking for a short with a reasonably tight stop loss probably at $56,500-ish. Oh yes, that means a loss, if shorting - for a trend following scenario moving south. And of course, anybody doing proper trend following knows that losses are heavier than any other trading methodology - but that the gains are tremendously more. (Read that brutal disclaimer below)
For those wishing to gamble going long, also expect a rough ride north to around $50,000 if it gets there- with heavy potential losses.
I do not promote gambling. Taking calculated, measured and affordable risk is not gambling.
Whatever you do, watch out for tweets like 'diamond hands', from you know who (and to be clear, it's not from me)! If you don't know about this, what are you doing trading Bitcoin?
Disclaimers : This is not advice or encouragement to trade securities on live accounts. Chart positions shown are not suggestions intended to assure you of an advantage. No predictions and no guarantees are supplied or implied. The author trades mostly trend following set ups which have a low win rate of approximately 40%. Heavy losses can be expected if trading live accounts. Any previous advantageous performance shown in other scenarios, is not indicative of future performance. If you make decisions based on opinion expressed here or on my profile and you lose your money, kindly sue yourself.
Short-long
Talking To My Crypto Buddies Like 🤑🚀📈Saving Time With Little Talk. (Down) The CoinSLayer 👨💻😈 only knows (Down)
Looking for Directions??? Let me help you ⬆⬇⬅➡↪↩ Get it lol Good Bye!
My DM's: Digguss#101 "BITCOIN is programed to pump Have Fun Staying Poor Bro!!!"
Me: "okie-dokie" 🙃
What are your thoughts? Is it bad that people like to realize gains and say "Cool! More Dollars now!" Most will answer with an emphatic "YES!!!" LOL Or am I really the only person that's down to pull profit and even short a little??? LOL
No Advice to give just thoughts that I can't shake after the last 6 years in the world of "CRYPTO"
🤷♂️ #Fixed IDK Protect Your Neck!
🙏FOR JUST A HEALTHLY PULLBACK!
""KEEP CALM AND MANAGE THY RISK!""
I am The CoinSLayer 👨💻😈
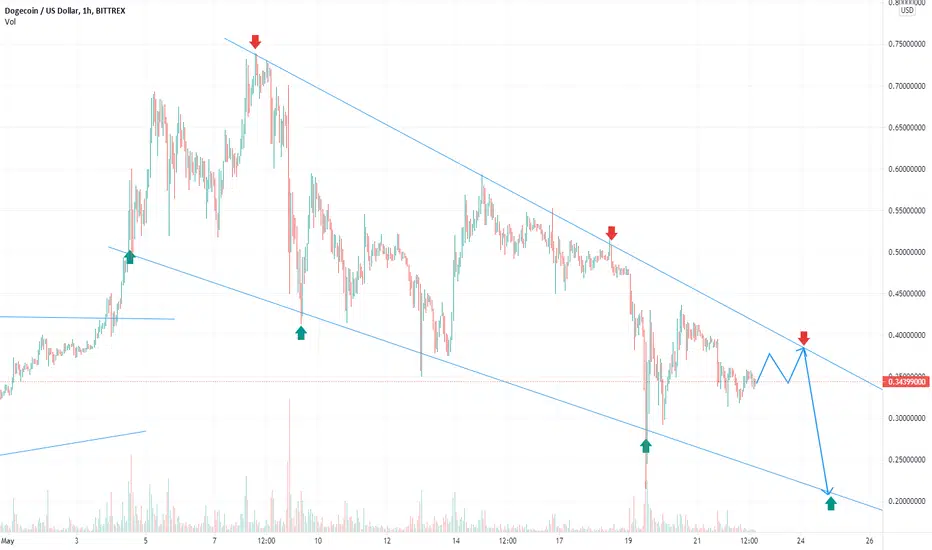
DOGEUSD Check this out Just my prospective Comment below DOGEUSD Check this out Just my prospective on DOGE- Comment below what do you think of my chart and other possibility's
Bitcoin - scenario for next 5 days (possible triangle symmetr.)Bitcoin - scenario for next 5 days (possible triangle symmetr.)
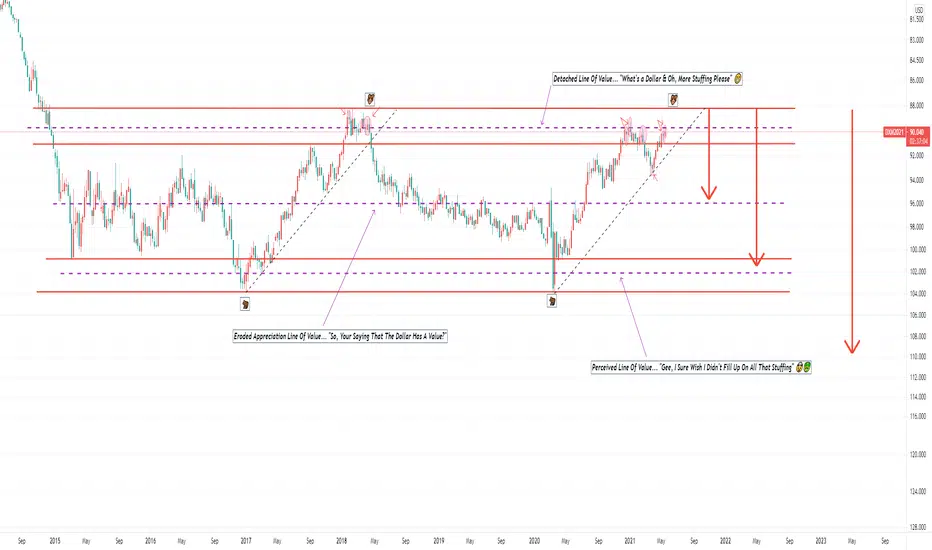
I am Sure That This Makes Perfect SenseUnderstandably I know it's not a universally loved idea however we could very likely be standing at the edge of a clif f. I am not the arbitrator of truth knowing the reality of where we are headed. There lives a real possibility that the love of Bitcoin and hope of what it can do and the price included may have clouded the judgment of many. LOL Enjoy the ride you paid for it right? It's all normal moves some big and some small. I am glad I was able to RE-POST this after it was taken down back in Dec... Oh well it's here again! I am referring to that Monster.
I like Bitcoin but... "You never know, You never know."
What are your thoughts? Is it bad that people like to realize gains or just something else?
-No advice to give just thoughts that I can't shake after the last 6 years in the world of "CRYPTO"
""KEEP CALM AND MANAGE THY RISK!""
Now what after a nice big win on NQ?I hope you catch the big quick drop on NQ with my last idea. I also hope you exited fast before the rebound. I got out almost at the bottom. I got out after the Doji formed at the bottom. I didn’t stick around for confirmation and just took my money and run!
Now NQ back up and consolidating. You can see my short and long set up. We are looking at descending triangle which books say often leads to further downtrend. My experience tells me it is 50/50 chance either way. All I know for sure is price will break out through the hypotenuse (resistance) or it will break down below the leg of triangle (support). So be patient, wait for confirmation of breakout before you enter my position. Or if you are aggressive just enter at first sight of candle break through. Both ways have good points and bad points. Personally I like to do it both ways, but it depends on what I am looking at to.
Safe trading. Please thumbs up me if you like this.
♥️ Ms. Bunny

A Horrifying Good News!The good news is that if 48K support area cant hold, we may see 39K area, even for a short period of time or as a wick. But i think it may take several days. BUT!!! It will be beginning of an even better period for crypto and we will see best of it in coming times.
48k BTC (or even better, 39k BTC!) here we come...
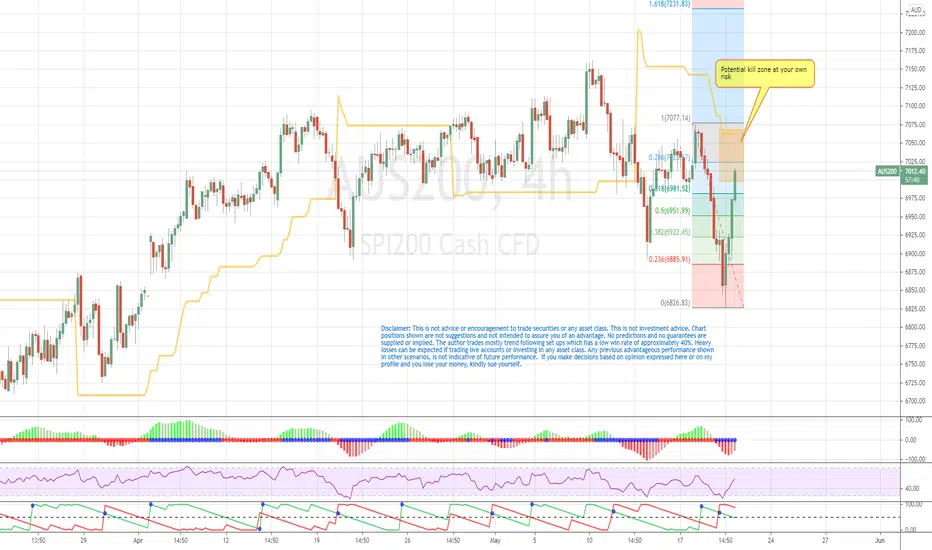
Aussies in the crosshairsA potential kill zone is shown. DO NOT enter if you cannot lose money!
It's this simple: price below amber 4h ATR.
Disclaimer: This is not advice or encouragement to trade securities or any asset class. This is not investment advice. Chart positions shown are not suggestions and not intended to assure you of an advantage. No predictions and no guarantees are supplied or implied. The author trades mostly trend following set ups which has a low win rate of approximately 40%. Heavy losses can be expected if trading live accounts or investing in any asset class. Any previous advantageous performance shown in other scenarios, is not indicative of future performance. If you make decisions based on opinion expressed here or on my profile and you lose your money, kindly sue yourself.
Beartrend till August, September 2021?I am not buying any alts or bitcoin till i see the RSI red line is crossed. This can happen approx in 3-4months
But if you wanna set buy orders set it 35% - current BTC value.
For the Alts 45%, 60% - current value of the alt coin or token.


ADA trend is now over it sold pass the 61.8 supportThe ADA Trend is over it now has be over sold and this is a indicator that there has been too much selling and ended the trend. If you are long-term then just HDLE but if you're day trading I would watch very close and may need to buy back at a lower price.
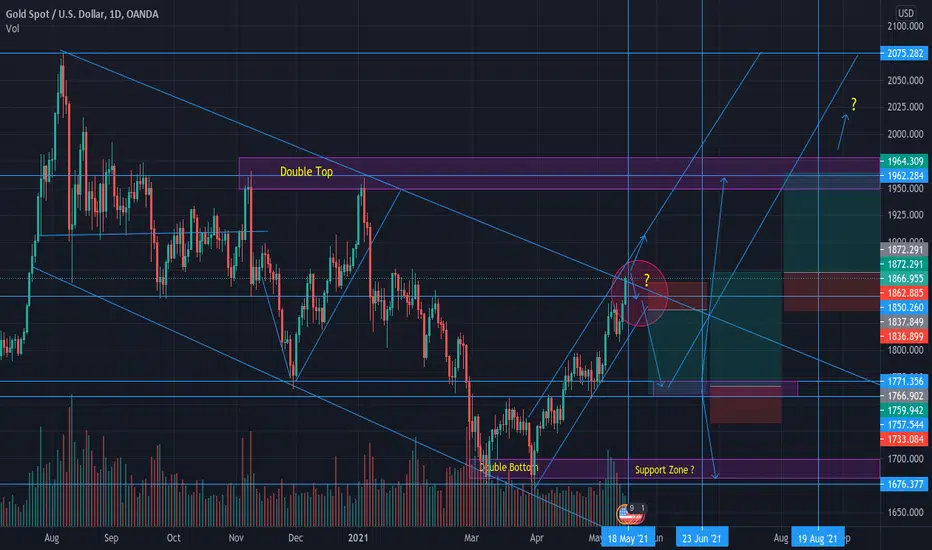
The Summer Short (Update) ... Or Long... ? The next day or so is crucial to see how the daily close is and if we come back into the zone or whether it closes outside the zones and begins to create a new one. Patience is key but my analysis for this update is self-explanatory. Do you think we could see 1950-2000 towards the back end of summer into august? Let me know your thoughts below..
This week for NQ.My bias is a long setup on NQ. But as you can see I have a long and short set up trigger because you never know what price will do. If you wait for your trigger you will be right on direction 100% of time. This does not mean you make money as this is depend on your risk management which by far is most important thing in trading.
Long trigger
Wait for 4 h candle close above purple rectangle. As always you can enter on breakout for aggressive trade or on retest of what would then be support for safe entry. You can see that price is already above both the fast and slow hull (yellow and blue lines), so this is extra level of support and why my long bias.
Short trigger:
Enter if 4h candle close below purple rectangle. You can choose safe or aggressive entry. If short price target hit then look for further drop to weekly support.
Target prices for both long and short entry shown.
Hope you all happy safe trading. Be safe and use good risk management!
♥️ Ms Bunny.
Remember I love your thumbs up in my idea. The more the better! And comments welcome!

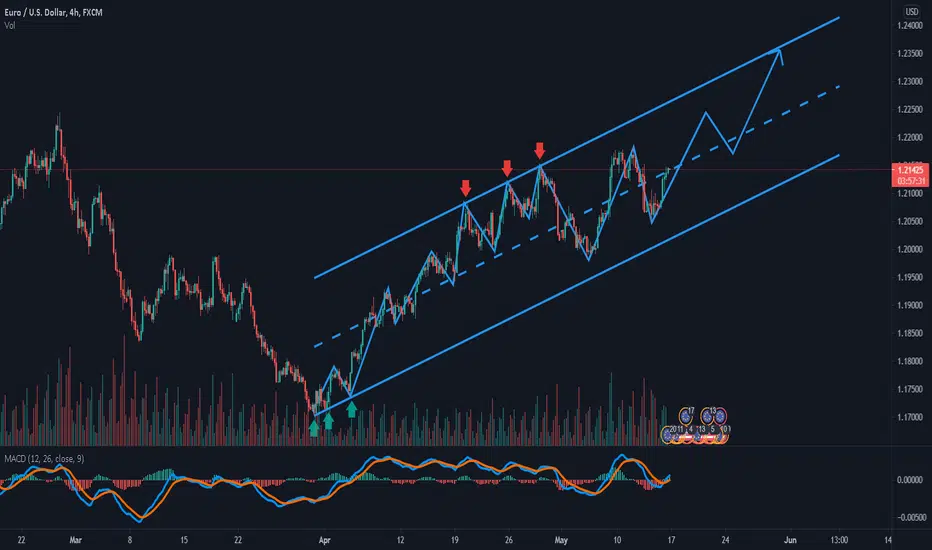
Eur/Usd Channel Scheme
Target one: buy 1.22450
Target two: buy 1.23600
Don't forget to look the economic calendar.
THANK YOU!
GOOD LUCK!
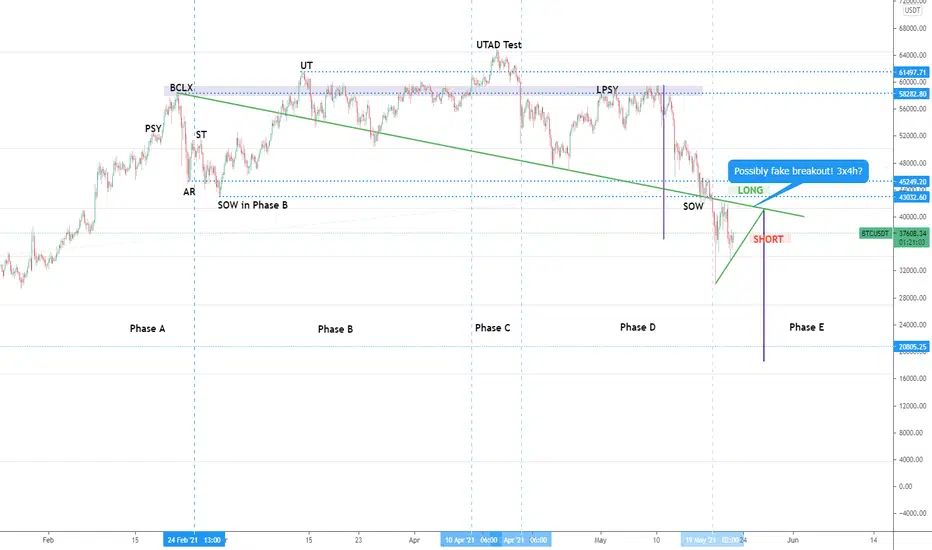
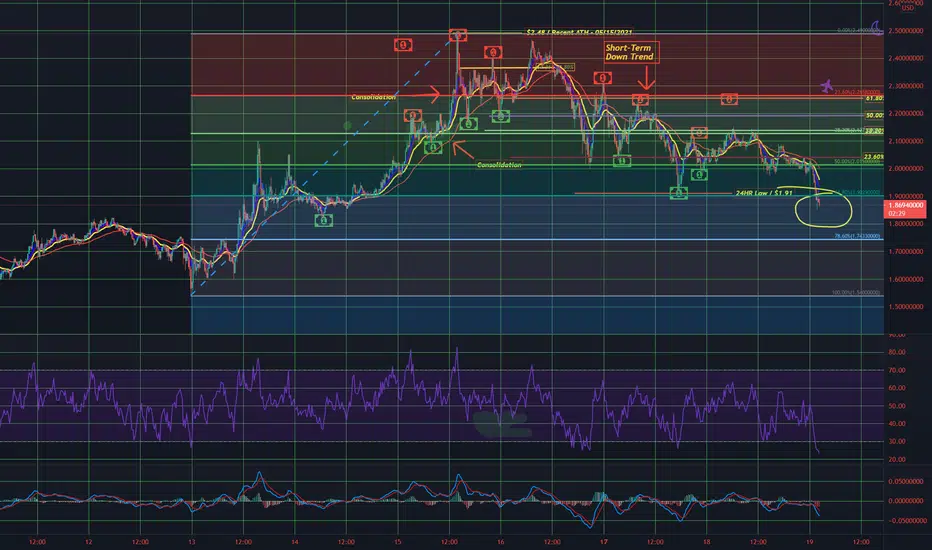
2 Options from my point of view (PA+RSI)Hello people!
This is not the financial advice nor any expert view as most of You is more experienced and educated than ME so bear that in mind! Thanks.
As I see it we have two options after what last dip hasnt seen some bigger volume to push the price higher and turn the sentiment into more bullish thing (Yellow circle 1, denied path of green trend).
O1 - We will move sideways for sometime until some huge investment takes place. Then we will start our next rocket flight.
O2 - One more sell off to the 43k support with a medium fast dip creating the local bottom followed by huge rise (Yellow circle 2, quick price action with purple line, bull continues).
As for RSI there is still some space to drop on weekly chart to the long term supports. (Cant post the pictures cuz of low reputation :( ... oh well)
Lets see what Bitcoin does next. Be aware of big players moving the price in high pace and with big differences.
Be happy with your trades and stay safe.
Cheers!

EURJPY: Another probable lossThis is a simple structure level situation. It's at what seems to be a resistance area. There are no predictions here.
It's this simple: if you can't lose stay out.
Disclaimer: This is not advice or encouragement to trade securities or any asset class. This is not investment advice. Chart positions shown are not suggestions and not intended to assure you of an advantage. No predictions and no guarantees are supplied or implied. The author trades mostly trend following set ups which has a low win rate of approximately 40%. Heavy losses can be expected if trading live accounts or investing in any asset class. Any previous advantageous performance shown in other scenarios, is not indicative of future performance. If you make decisions based on opinion expressed here or on my profile and you lose your money, kindly sue yourself.

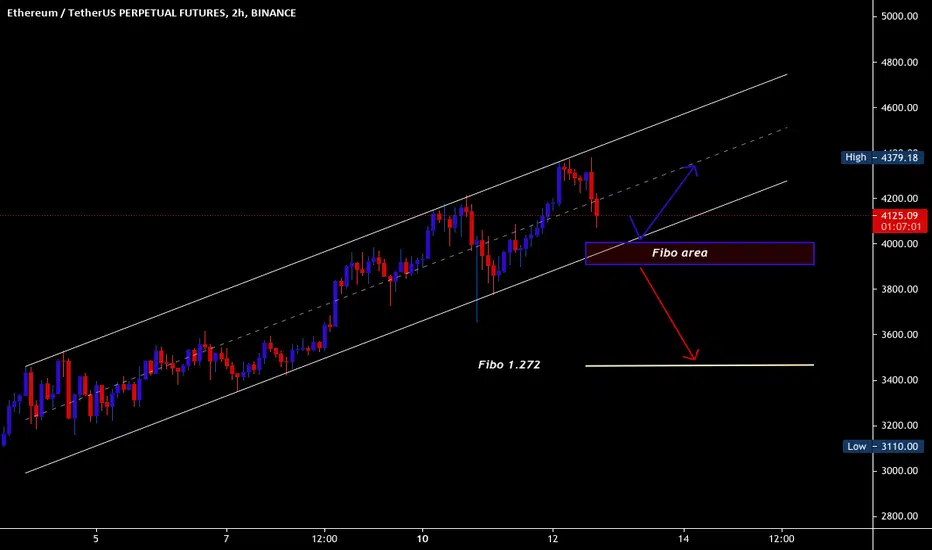
ETHUSDT parallel channelHi Buddys..
Channel floor can indicate a very important position for buying or selling
Be sure to money management and stop loss
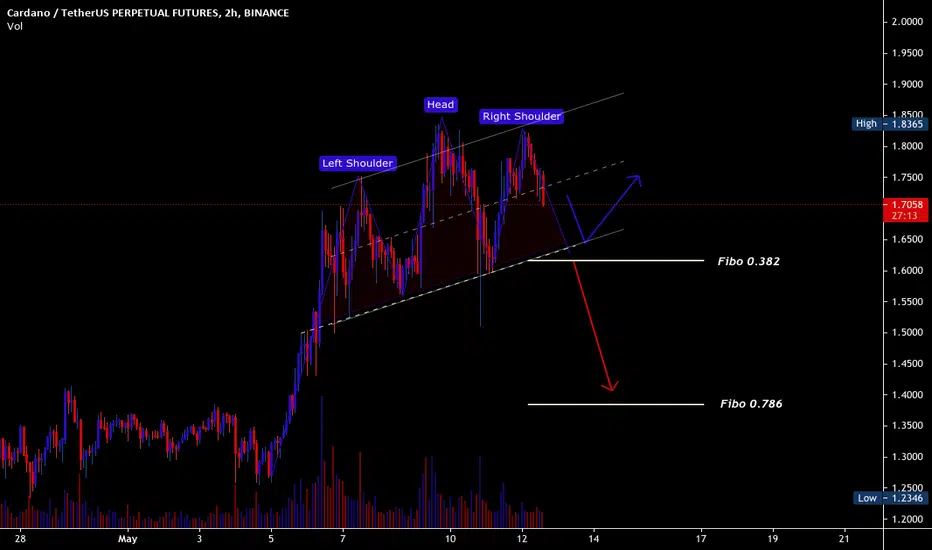
ADAUSDTI see the head and shoulders pattern
If Bitcoin continues its downward trend and ada break parallel channel and fibonacci 0.382
We can see lower prices
Upcoming week for NQYou can see here that price is currently between a daily support and resistance as MACD slightly on the rise. On Friday price regain a important daily support:
Case 1:
Price break through daily resistance (black line) buy. You can buy on retest of what would then be support for a conservative entry or on breakout of this same line for a aggressive entry. Personal opinion is I like aggressive entry because I am impatient and I just want to be in. But I still use good risk strategy and I never lose much. It is riskier but also more reward. Overall I don’t think much difference between aggressive or conservative entry by my own backtesting. You can see the Hull moving average right above which usually is a strong resistance/support. So if it breaks through the Hull I would add too a buy position.
Case 2:
Price loses the daily support it just regained. In which case this is a false breakout. False breakouts often lead to sharp reversals. So if daily support (white line) is lost is would sell. Then see what price does at the first black line (support). If it can’t hold this line we may be in for a bigger drop down 12700 which is a spot I have been eyeing for a while. See previous idas n links. So if price can’t hold support at about 13345 I will add to my short and hopefully ride this down to 12700.
I will try to post other ideas this week too if I can. I haven’t been posting ideas as much because I just got a big unexpected promotion at work so I try to learn a new part of my job. But I will hopefully be posting many new ideas again.
Thank you for reading. Happy trading! And please give me a thumbs up and a follow 😌
🥰Ms Bunny.

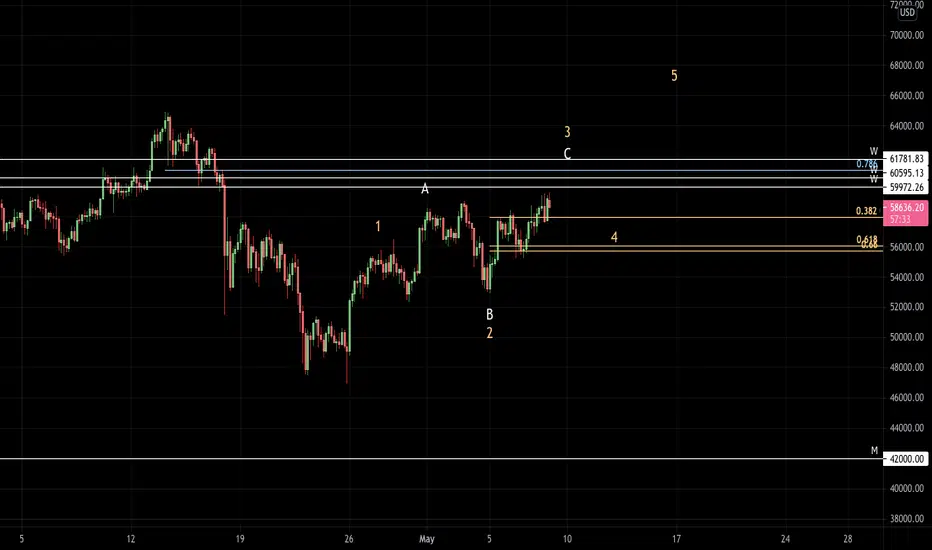
BTC SHORT INTO LONG-EWI will be taking a short off of the 0.786 retracement/weekly levels based on a confluence of two Elliot wave counts-on being a c wave of a correction of the impulse down and the other being the end of wave 3 of the impulse up. Therefore profit taking 1 will be quite quick at the 0.382 and I will be waiting to see the reaction at these levels to decide whether or not to enter a long position on a different account. If we fall through this support them my target will be the monthly level and I will take a long off of that level. If we bounce off of the 0.382 (PT1) I will enter a long for the 5th wave of impulse and then enter a short, and then enter a long as this will be part of a bigger impulse move
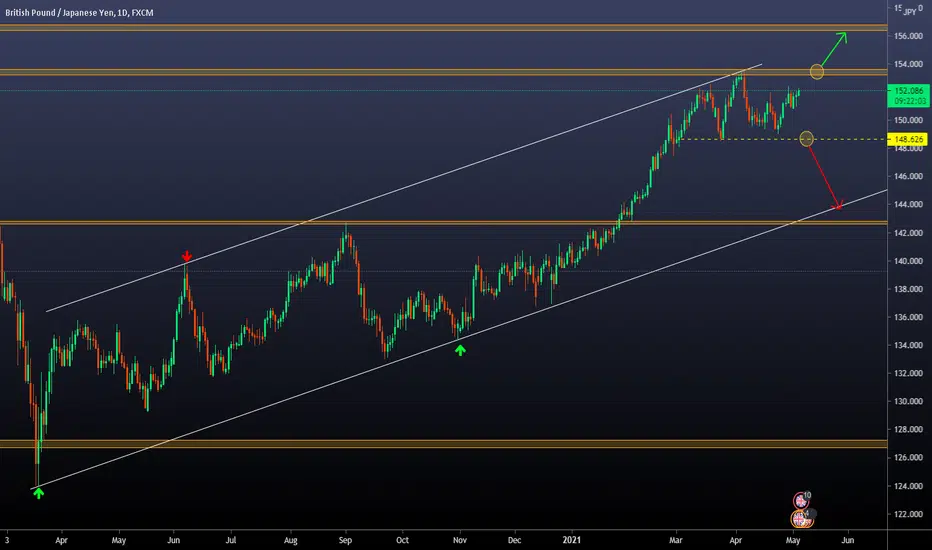
GBP/JPY Bullish or Bearish?Good morning traders! This is our analysis on the GBP/JPY pair.
First of all, the answer to the title of the post is that nobody is certain if the price will have a bullish or bearish behavior! But what we can do is establish what decision we will make based on whether certain behaviors occur that put the scenario and the odds in our favor.
With that said, let's move on to the analysis:
🔸First, we see the clear and marked uptrend on the daily chart. Indisputable. Higher highs and lows within a bullish channel.
🔸What has generated many doubts in recent weeks is the recent behavior of the price, quite choppy remaining in a range, but this happens because the long-term chart is not taken into account and we focus on low temporality charts. ALWAYS look at the big picture.
🔸The current consolidation process, we personally choose NOT to trade within it. We are expecting one of the following two behaviors:
🔸Bullish Scenario:
In case we see a bullish break of the resistance zone, we will wait for a correction or retest to look for a trade towards the next resistance zone.
🔸Bearish scenario:
In case we see a bearish break of the Support zone, we will wait for a correction or retest to look for a trade towards the Ascending Trendline or the next support zone.
Flight Centre (ASX:FLT) Short term proposition Flight centre has been beat down since Covid-19 and as of today is 3rd most shorted stock on the ASX. This acts as some unflattering news for traders however could there be a potential upward movement?
From my charting line i was alert today that FLT has seemed to touch and rebound on its support level after its 5% drop due to bad returns which personally indicates a bullish idea as despite negative news is unable to break this level.
This had brought me to two possible conclusions. FLT will continue to be beat down by the shorts and maintain in sideways movement or FLT will rebound of the support level and reach its resistance level as shown in the diagram.
