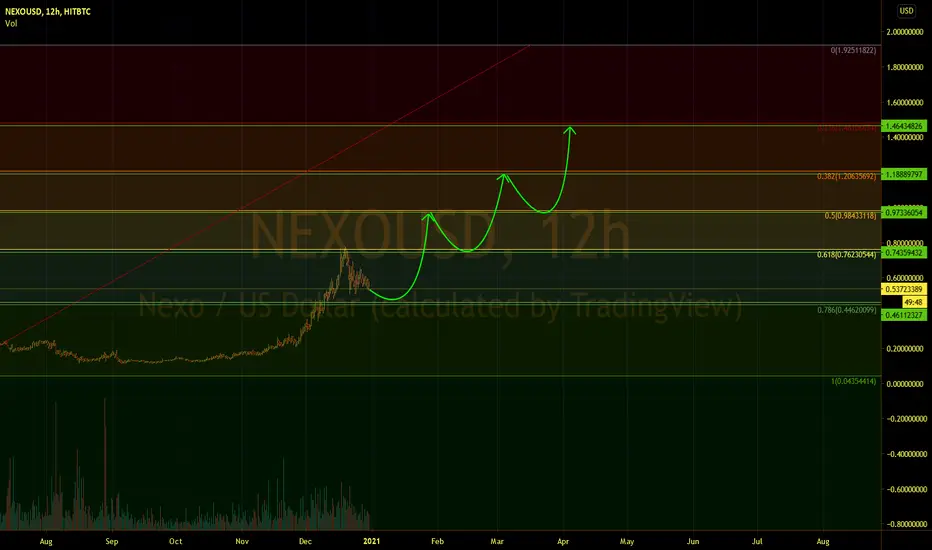
NEXO/USDT 12 Hour Chart Looking into Alt Season 2021In this idea we see Nexo is falling to support and will start climbing in January. This is confluent with my chart of Bitcoin where Bitcoin will fall into a consolidation region approx January 14th. once Bitcoin has stabilized we will enter a 1-3 month alt season. If you agree throw me a like and follow me for more unique ideas and concepts that keep you in the gains.
Short-long
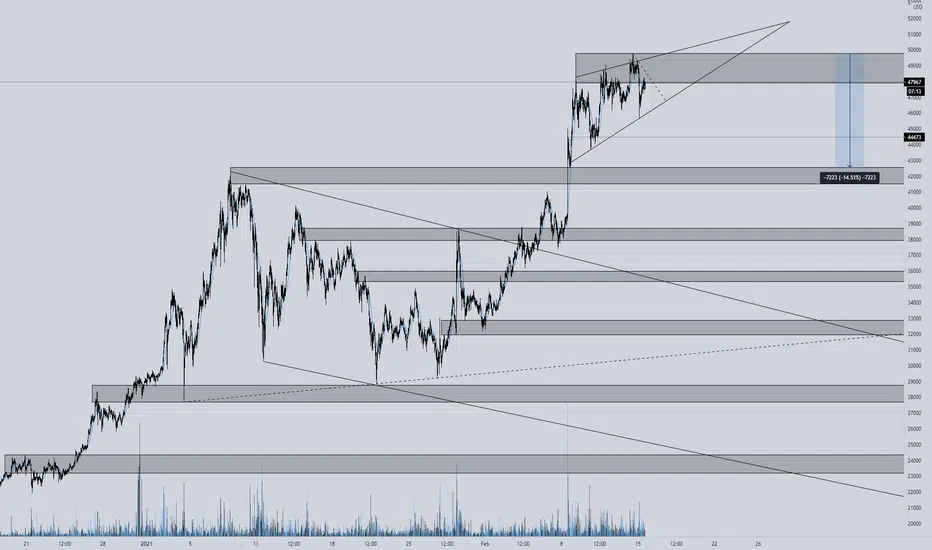
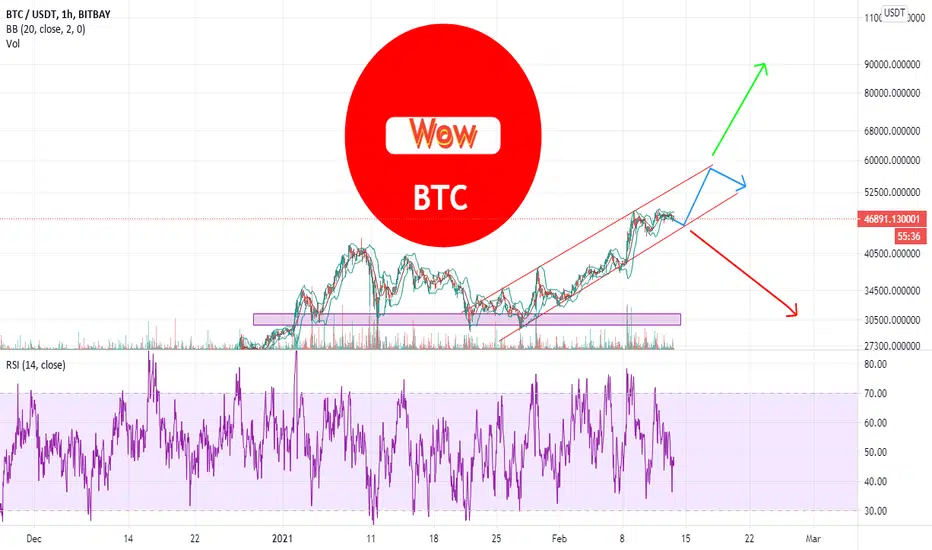
Potential 14.1% pullback (market structure/rising wedge) BTC Good morning traders,
Considering the thought we may see yet another pullback after rejecting from the psychological level of $50,000 is never a bad idea.
A 14.1% pullback from the current ATH (just under $50,000) would bring us back to the previous ATH, which would be nothing more/less than a retest for structural integrity purposes.
Greed/fear level is currently at 93, yesterday it was 95 (only a -2 after a $5000 decrease in price) which is also alarming.
Funding is currently 0.1392, and predicted to be 0.1590 (funding is still high, and after breaking down from the mini rising wedge in my previous post it wouldn't surprise me to see this bigger rising wedge playout the same way we've seen many other one's in 2021 play out.
Target #1: $44,444 & will post attachments/updates letting everyone know what I'm doing
Summary: looking for a pullback to either validate support at lower levels, or continue the downward pressure towards the current target.
Please get this technical analysis to 30+ likes to unlock more content in coming days! 👍
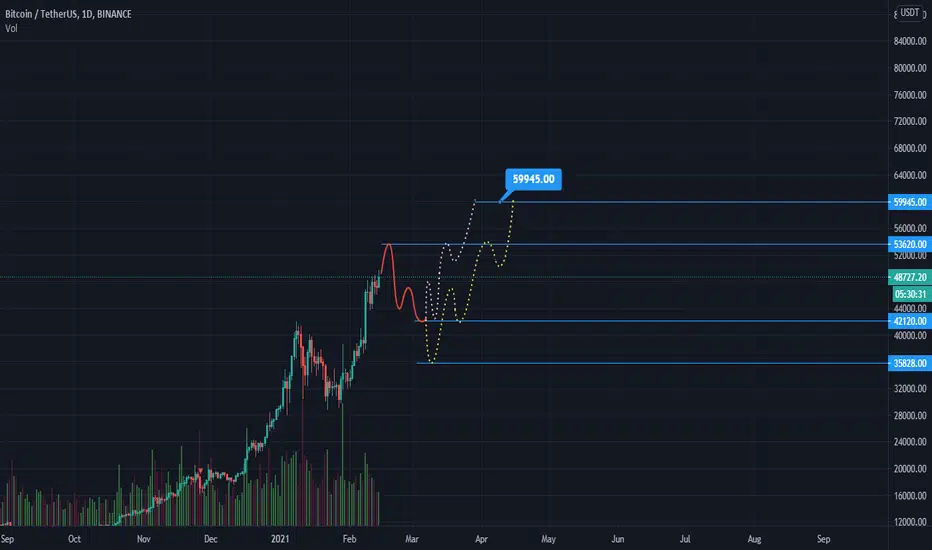
A Most Needed Correction and a Littke AscendNot much remains to say. Completion of current wave at 53620 and a consequent correction to 42120. Afterwards, two scenario may happen which both lead to the same price: 59945.
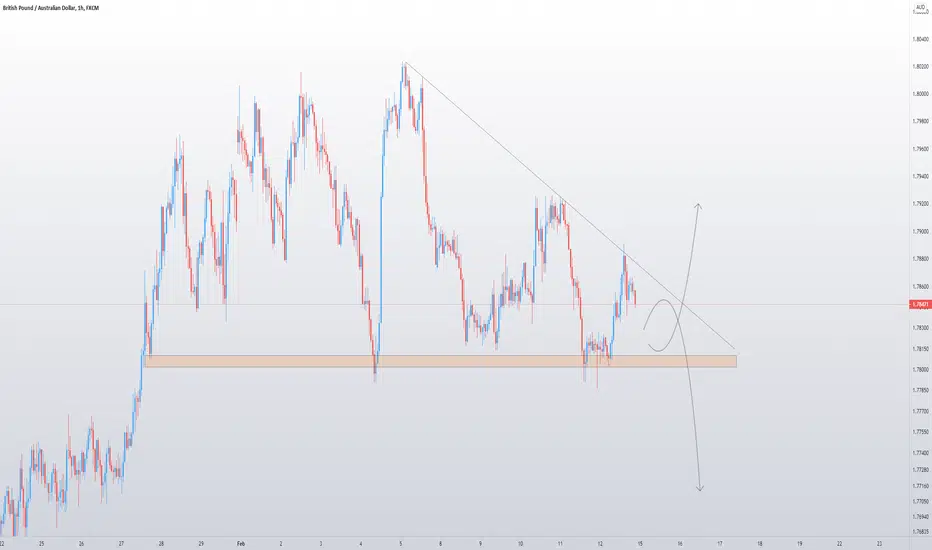
GBPAUD SIGNAL - WEDGE PATTERNCan see the support level is quite strong for a while, it has been tapping few times so the support level can become more weaken? There is 2 ways either the price will break the resistance level or the support level, Wait for the price action to make entry.
Trade at your own risk.
my Btc ideayouwin is here
i hope
Hope for the future
It's coming soon enough
How much can we achieve?
Hope for the future
It will belong to us
If we believe
If we believe
then it's okay :)

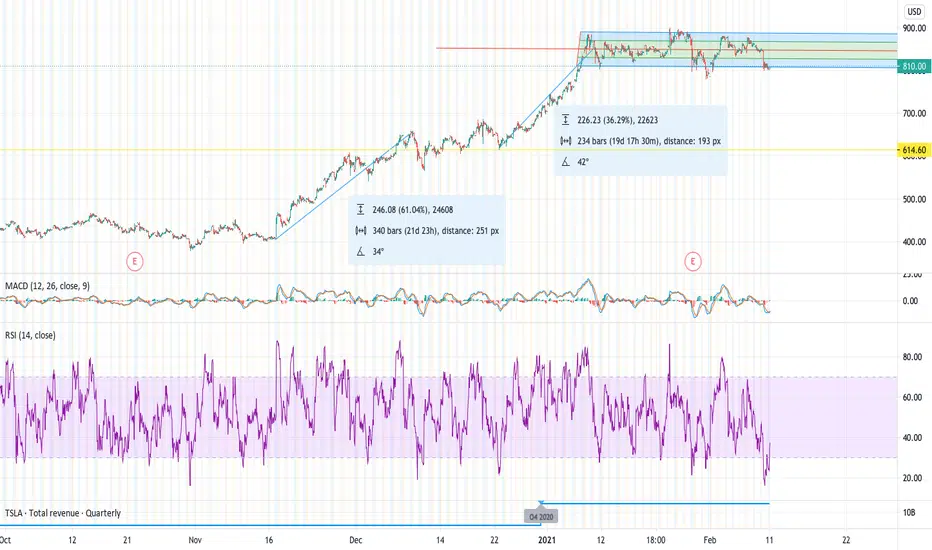
Bitcoins are a bear to Tesla sympathyIt is a commonly known fact that cryptocurrency is a blatant attack on earths climate.
It is also a commonly known fact that Tesla's aim is to get the fossil fuels out of transportation.
Therefor Tesla Inc should NOT engage to buying any form of crypto currency unless it is solely mined and powered by renewable energy.
If not, sympathy for this company will drastically drop and it will lose many of its "commonsense investors". They might seek refuge to solar,wind, drinking water and hydrogen stocks.
What would be the next price target if Musk pushes this brainfarth?
Also, what if this is just a scheme to troll Bitcoin investors and Tesla Inc short sellers? Both would suffer immense loses if it were to be a joke after all...
Trading volume is low these days. How long will people hold their breath before deciding to go or stay?
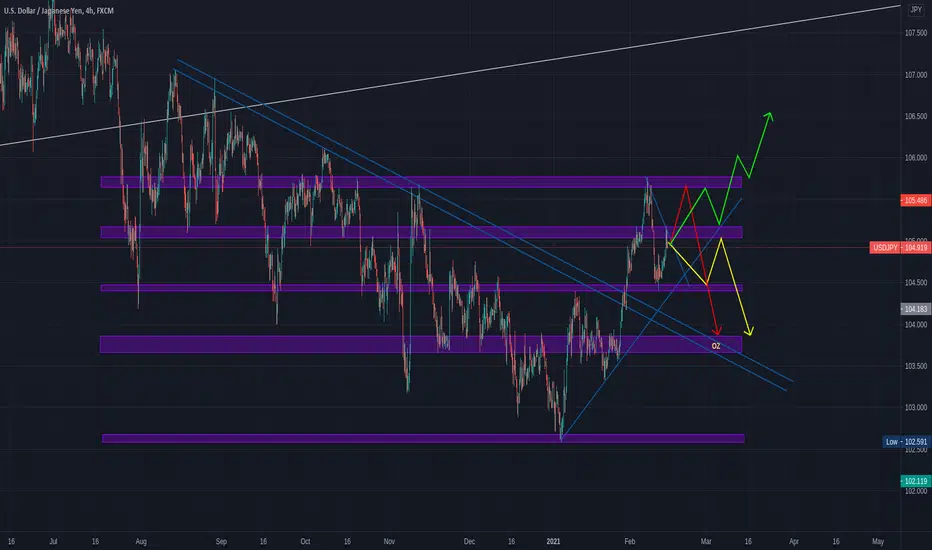
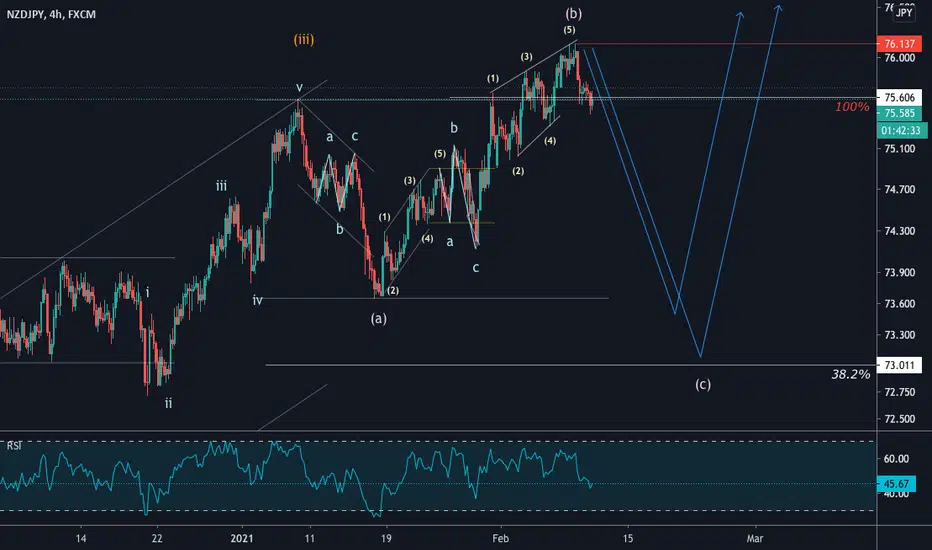
NZDJPY - POTENTIAL LONG AREAI am currently neutral on NZDJPY because I prefer following the overall trend and this trade would be countertrend.
NZDJPY seems to be forming a great FLAT PATTERN. I will be looking for a LONG position between 73,600 and 73,000.
From my perspective I think the market will retrace until 73,000 because that would be 38,2% of Wave 3.
Again , this might NEVER happen because this is pure speculation on a potential long area and that's why I won't take any short, the market could just keep going up and follow his uptrend from the current price.
Normally Wave C is quicker than Wave B and Wave B took 21 days, so within the next month we should know if this setup will be ready.
I will be posting another analysis about NZDJPY if the market reach the lower area as shown on this analysis.
Trade carefully and be patient.
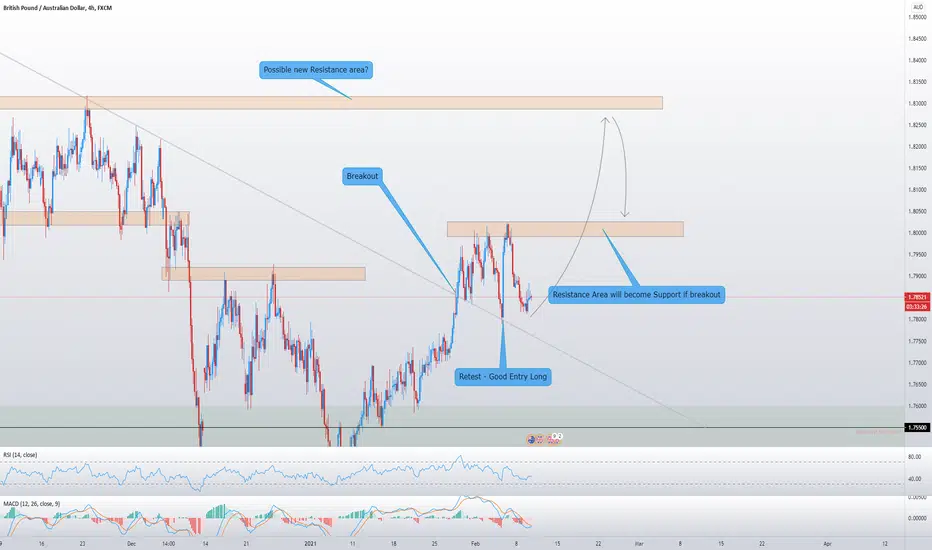
GBPAUD - BREAKOUT KEY LEVELSThis is my personal view, If the BXY price is still showing strong uptrend then i assume GBPAUD price will start to climb up.
Trade at your own risk.
AUDCAD - BREAKOUT SOONThis is my personal view and i do believe the price will either break out the support area or resistance level, Wait for price action to make entry and trade at your own risk.

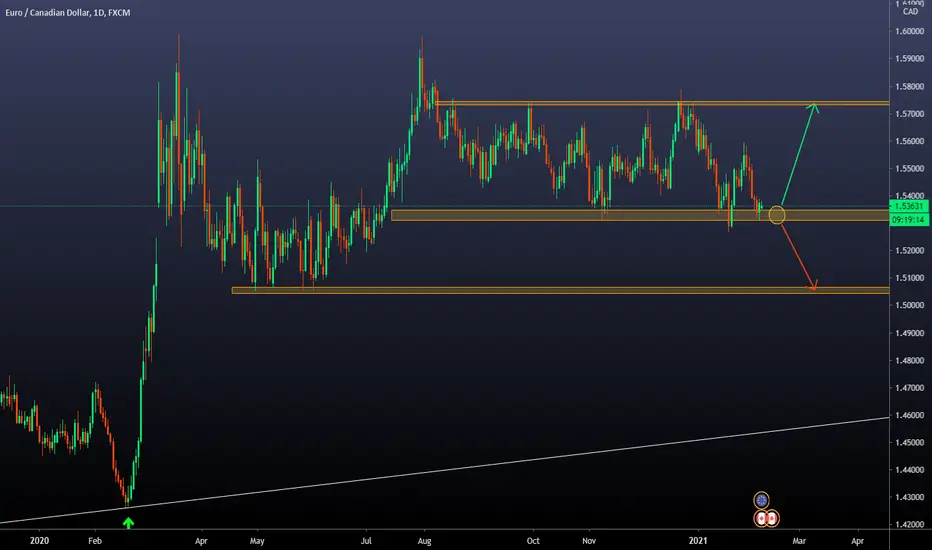
EUR/CAD About to Break the Range?Good morning traders, today we bring you an analysis on this pair that has been showing a particular behavior for a long time.
🔸As we can see, for about a year that the price has been without a clear trend on the Daily Timeframe. Of course, if we decrease the timeframe, we will find minor trends, but after the strong bullish momentum, all we can see is a consolidation.
🔸At this moment, the price is against a support zone, and every time it faced it, it generated an upward movement, which is why we consider that possibility.
🔸In case that vision fails, we must take into account a possible downside breakout, which if this happens, the downward movement target would be the support zone at 1.51000.
Is it time to short the Corn Market???CBOT:ZC1!
In recent times most commodities have been heavily inflated. So when is it time to short these things on a macro scale? Well, if seasonality tells us anything, typically corn prices start to fall once we enter the month of June.
There are 2 areas of supply on this chart, 1 of which we are already sitting in while the other is sitting at 627-680.
