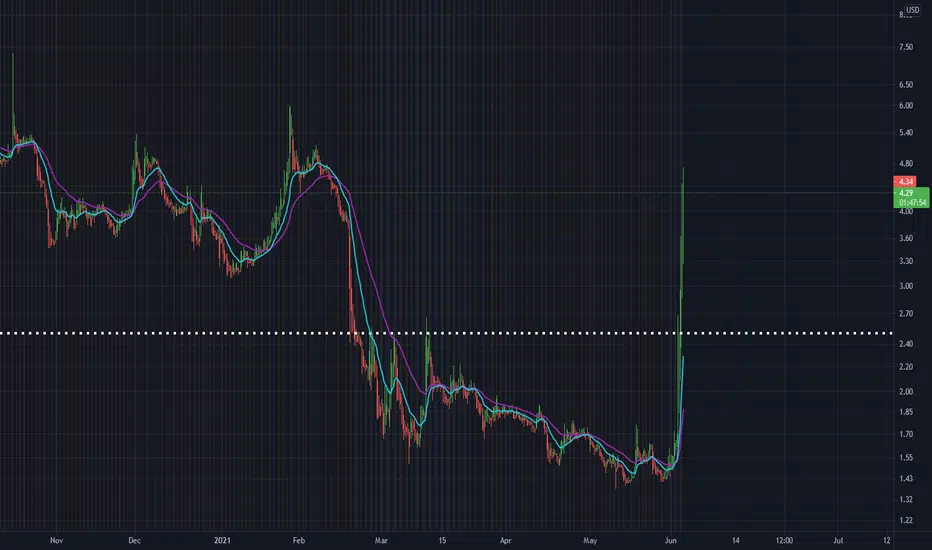
Short-pattern
GTT Gap filledHealthy pattern in the next weeks around 4.5$ and 3.5$ until we could target the next breakout.
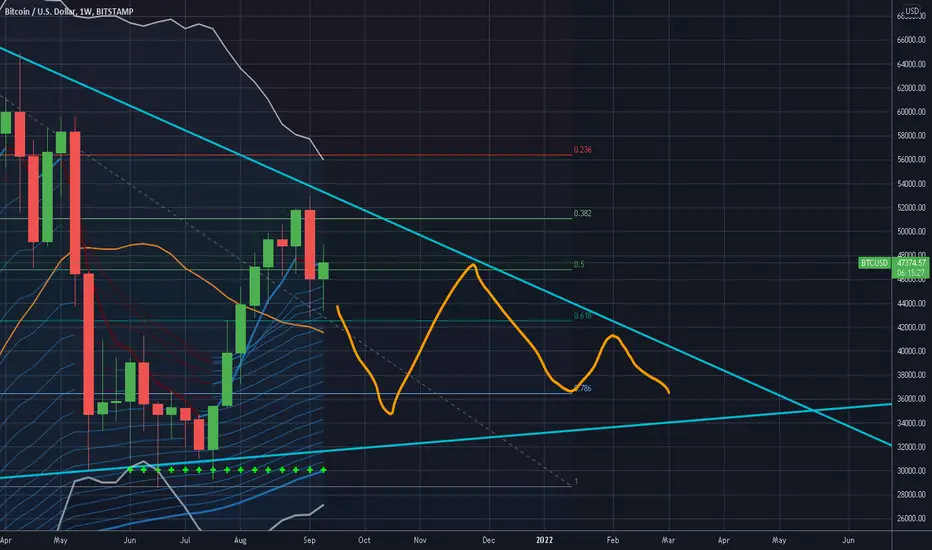
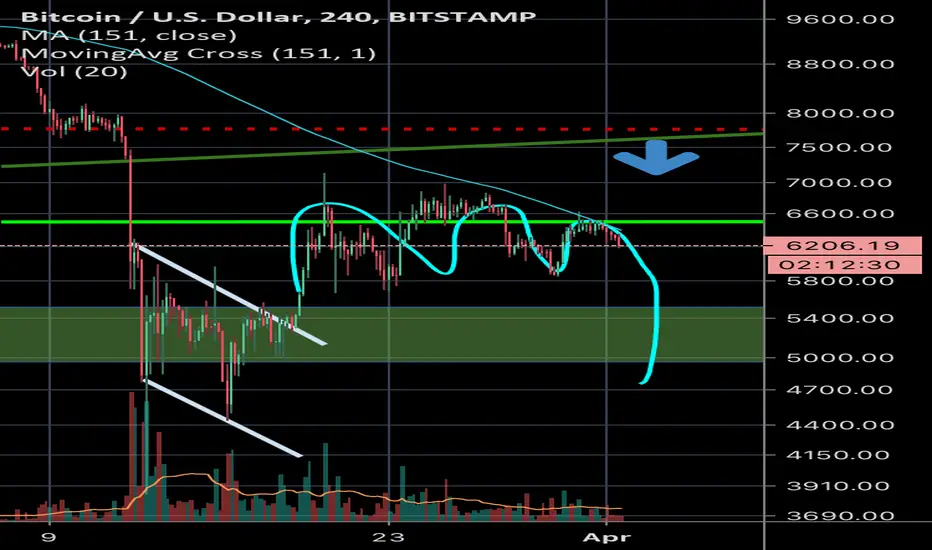
Inverted cup & handle with a bearish pennantHello fellow trader
As one may see in the chart, two patterns were formed by the price.
The first light blue marked is an rather choppy inverted cup and handle formation. I have outlined the target calculation of the pattern in the center of it.
The time frame is a valid one, c&h structures need at least several weeks to be taken into consideration. Also that it occurs within a yearly low implies further validity.
The second much more obvious, is a bearish pennant. Its calculus is outlined on the right side.
Both targets intersect at around 10k.
If we look at the past there are little structures which might act as support within the projected range. This could imply that we don't achieve the target, either positively or negatively.
Volume & Stoch RSI tells us we could expect a decline within the coming days.
If the price breaks upwards, over the mark of the max(c&h) and closes there within the daily time frame, this thesis has been invalidated (It might form a bearish flag, so the drop wont be off the table, depending on the price action).
Trade safe.
Nik

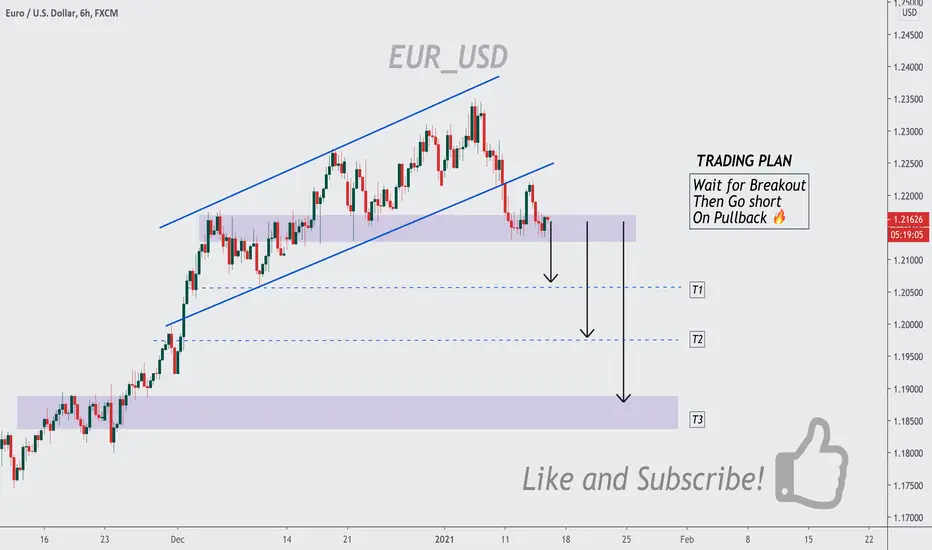
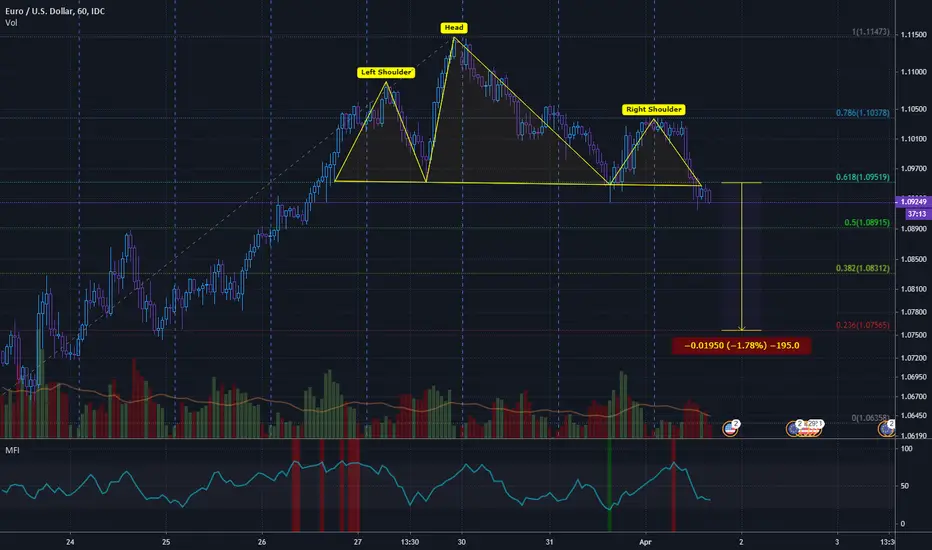
🏛EUR_USD IF BREAKOUT 👉🏻THEN SHORT↘️
☑️ EUR_USD broke out of the bearish flag pattern
And fell to the support area
The pair looks weak and the correction is overdue
Therefore, IF we see a breakout of the current support
Then we go short
With 3 targets in mind
The final one being the next support area
SHORT ↘️
✅Like and subscribe to never miss a new idea!✅
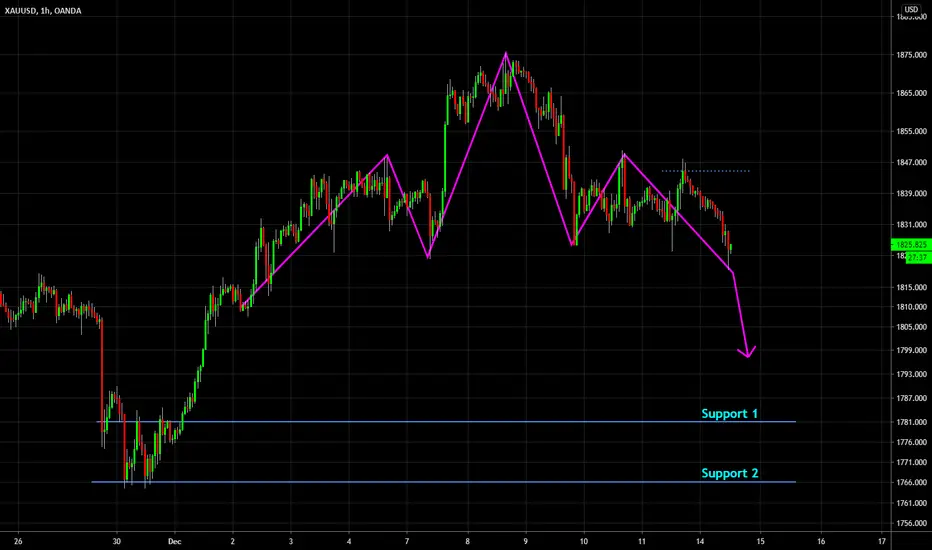
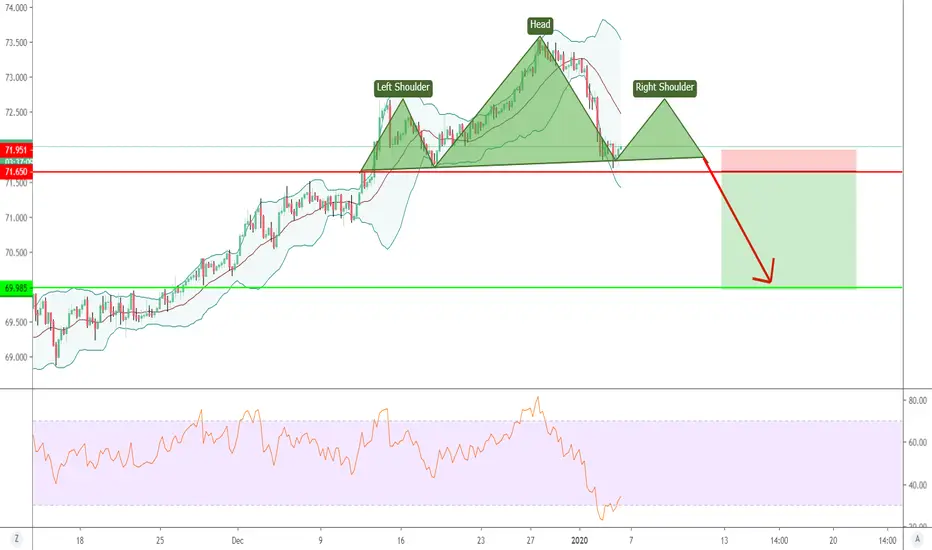
GOLD Bearish Head & Shoulders Pattern SpottedGOLD has formed a bearish head and shoulders pattern over the last couple of weeks. Today, I think the pattern has completed.
The two marked support lines are my targets, please do your own DD.
Also check out my other Gold idea!
CADJPY could go downside more. Observe it to take this trade.This Pair has formed nice patterns, so it could go downside at any time.
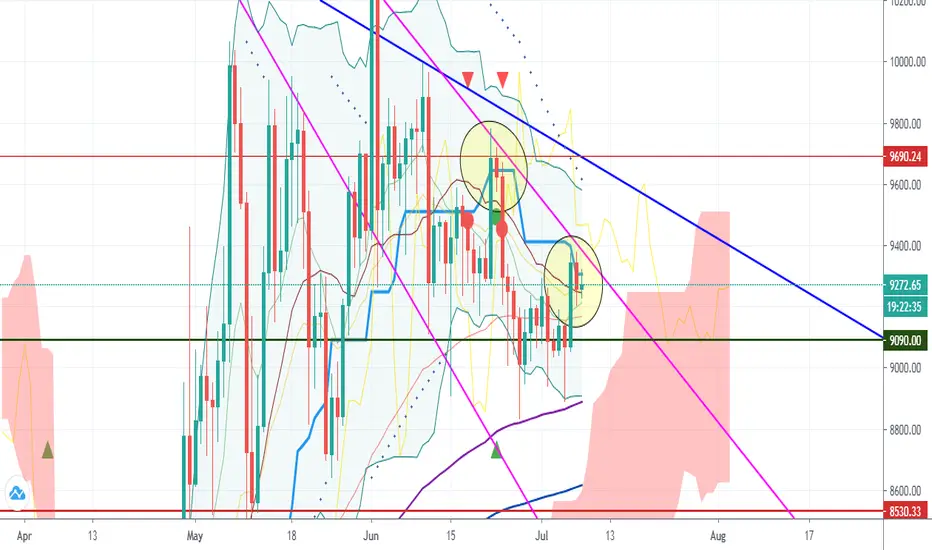
BTC Bearish - Same pattern in 1 monthHi everybody.
In both circle BTC has not potential to grow up against Kijun Line (Blue Line). Also The candle is the same.
So I think ascending channel will break in this week.
Have fun with more money reach :)
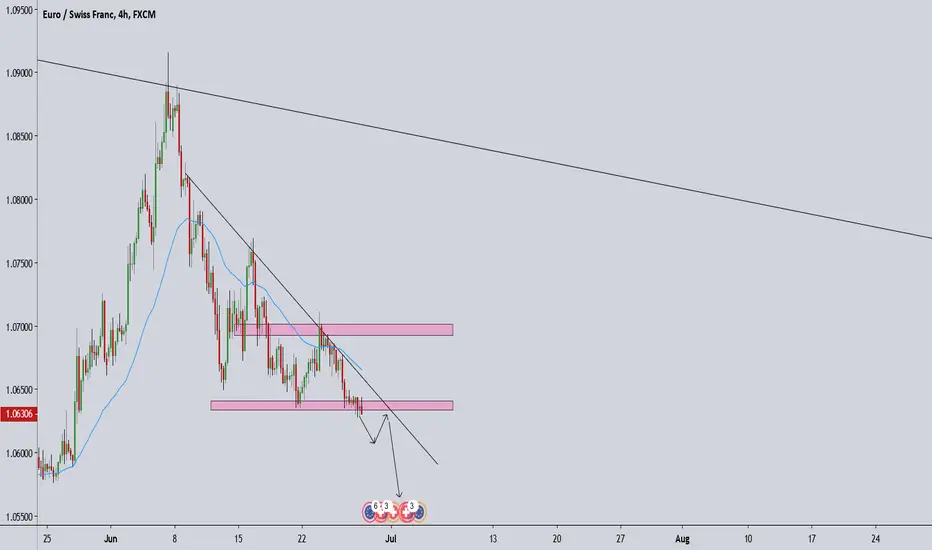
EURCHF-SHORTPotential Short on this pair- Keeping it basic here and going with a breakout (clear breakout, nothing corrective) and a retracement to this previous support.
The confluences I'm looking for to take this trade are this to retrace to a fibonacci level, the fibonacci level to correspond with a level of previous structure and a bearish candle close on the 2HR or 4HR.
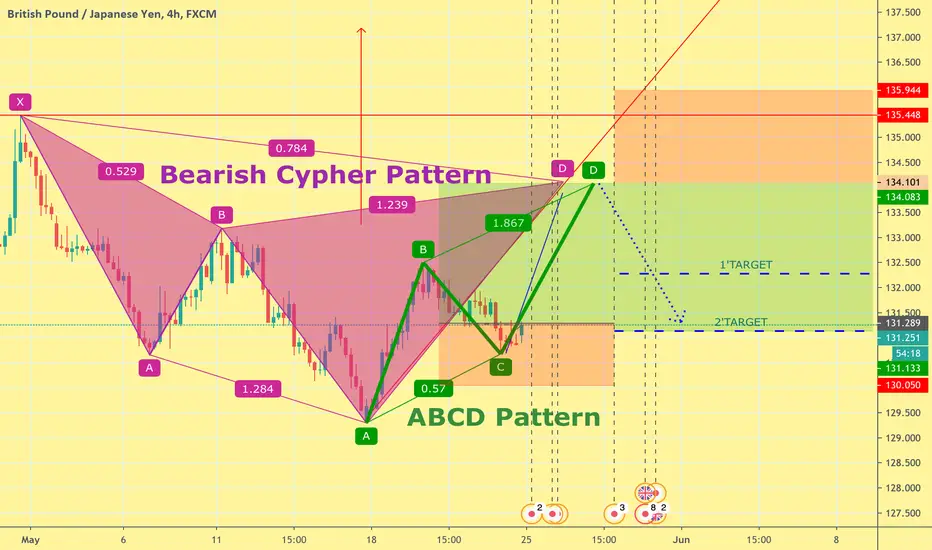
🤑GBP/JPY -BULLISH ABCD PATTERN Completes BEARISH CYPHER PATTERN🤑⭐️CHECK THIS OUT!!!⭐️
💷💴💷💴💷💴💷💴💷💴💷💴💷💴💷💴💷💴💷💴💷💴💷💴💷💴💷💴💷💴💷💴💷💴💷💴💷💴💷💴💷💴💷💴💷💴💷💴💷💴💷💴💷💴💷💴💷💴💷
CHANCE OF DOUBLE ENTRY...😱
WE JUST OPEN A LONG POSITION RIDING A NICE ABCD PATTERN TILL PROFIT AND THEN OPEN A SHORT POSITION (WITH 2 TARGETS) TO RIDE THE COMPLETATION OF A BEARISH CYPHER PATTERN.
WE HOPE PRICE HITS ALL 3 TARGETS 💰💰💰
💷💴💷💴💷💴💷💴💷💴💷💴💷💴💷💴💷💴💷💴💷💴💷💴💷💴💷💴💷💴💷💴💷💴💷💴💷💴💷💴💷💴💷💴💷💴💷💴💷💴💷💴💷💴💷💴💷💴💷
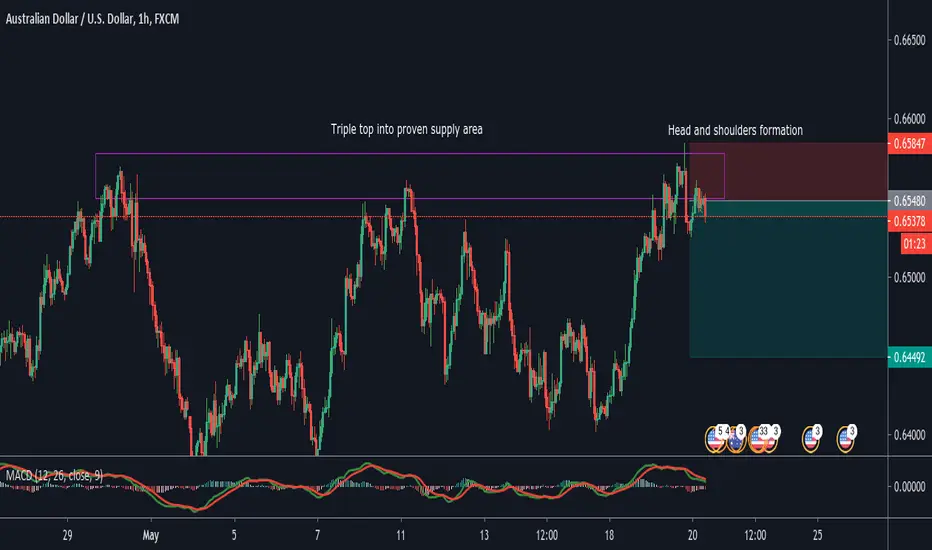
AUDUSD SellMore confirmation to me of a short potential on AUDUSD. Triple/double top (however you see it) gave me my first indicator, proven supply area in the purple box playing out, and formation of H & S pattern on the right has meant I've placed a SELL Limit.
SL placed 2 pips above the last high spike, entry placed at the start of this hourly candle, and TP giving me a good R:R ratio of 2.2/2.5 or something to 1.
If my order doesn't catch then I will look for entry on a shorter timeframe once we break the H&S, and adjust my SL to where I think the H&S pattern would prove incorrect.
Let me know your thoughts.
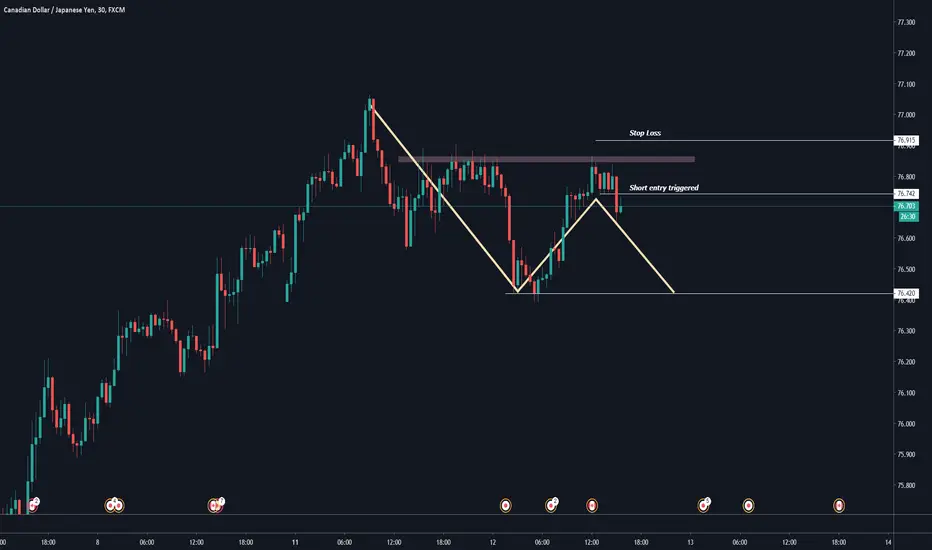
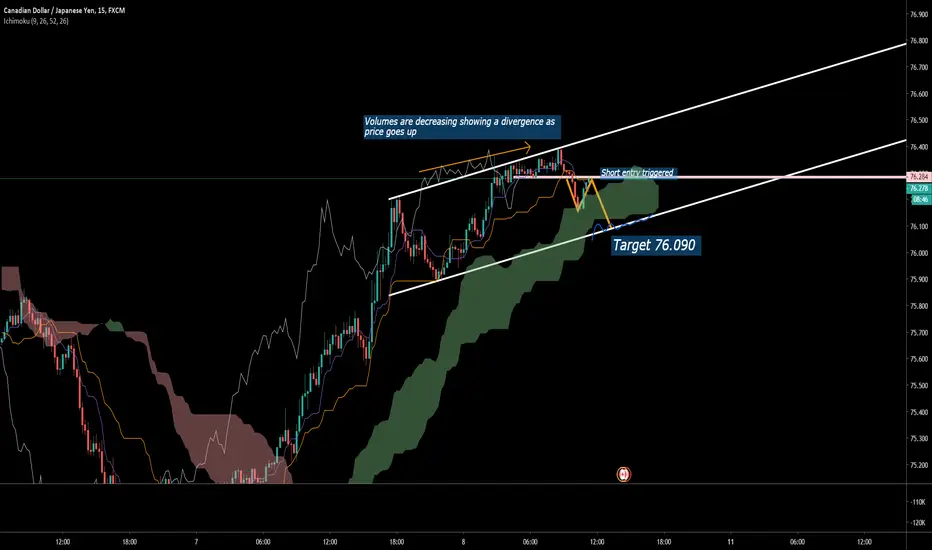
CAD/JPY Short entry triggeredMy short entry was triggered on M30 with this nice bearish candle.
My target will be the next support around 76.450.
Stop loss is also shown in my chart.
CAD/JPY: Short entry triggeredHey guys,
Just wanted to share the trade I took this morning, it's on CAD/JPY.
I have spotted a strong divergence on volumes as price was going up.
My short entry was triggered and I am targeting now the bottom of the structure.
Even though we are above the cloud on higher timeframes I believe the pair is overbought and is currently pullingback.
We've got high impact news this afternoon so I don't think I will keep the trade if it doesn't reach my target by then.
*** Trade at your own risk ***
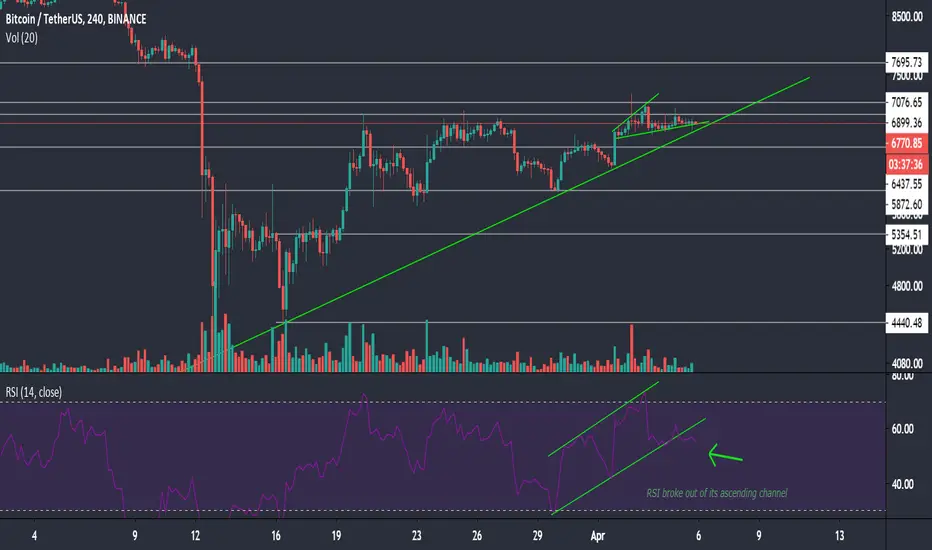
BTC about to drop for further continuation ;Generally a breakout in the price momentum ( whatever the indicator being used ) signals early buy/sell stages of both breakout side . Moment of truth for that famous ascending triangle published so many times among crypto space participants .
If btc indeed breaks out for further correction, it is all about droping for rebouncing even higher than before its decrease .
No worries for bulls team in the long run for sure .
Take it easy, it's all good !!
First target: Recent swing low. After that, who knowsNot financial advice. I’m not a financial advisor. I’m learning to trade. Learn to trade!
Like I said on 27th Jan. Future is not looking so bright. I wish safety, health and well being to you and your families. ✌️❤️🙏
Regarding this trade opportunity. We already broke down out of this possible bear flag and have come back up and retested (QE infinity and beyond) Who knows, with short term news we could retest again and form divergence for an obvious sell signal but....... future is (s&p/Dow/nasdaq) not looking so bright.
Check out bitcoins possible future moves in ‘related ideas’ below. Fractal is 40% complete
If you liked. Leave a like.

Nice Head and Shoulder.This can be a good short trade, opened my own short position 80 pips higher than now.
NZDJPY - Potential Head and ShouldersAt the end of the week we could potentially be seeing HS pattern which would give us the opportunity to short with great risk-reward ratio. Trade only after the forming of HS and when it breaks bellow the neck as I have shown in the idea.
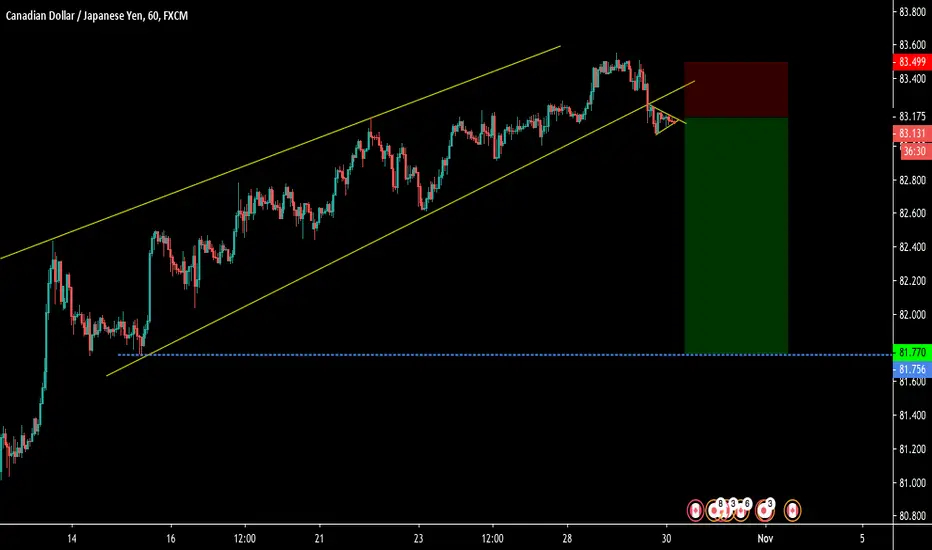
CADJPY - SHORTWeekly impulse from third touch confirmation on the bottom leg towards the upside.
Daily we identify a break in the bullish flag and break in previous high in the form of ascending reversal pattern on lower time frame.
Entry taken on 15min hover after a break out in ascending channel.
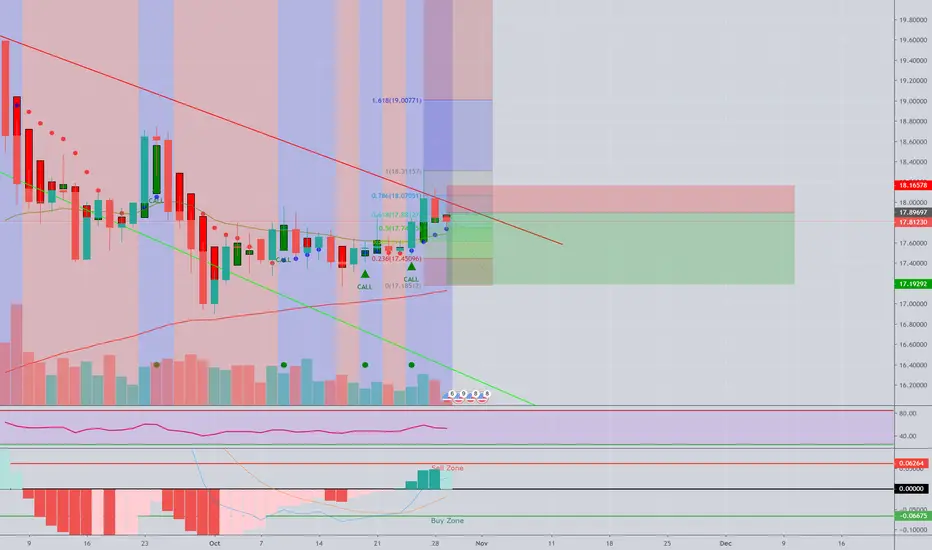
SILVER RETRACING BACKHello Traders ,
It does seems like we're making some sort of bear flag or a continuation pattern for sell. Selling the breakout wouldn't be a bad idea.
Go ahead and check the related ideas below mine and you'll find previous analysis on XAGUSD.
Good luck and trade with care.
1.50% RISK
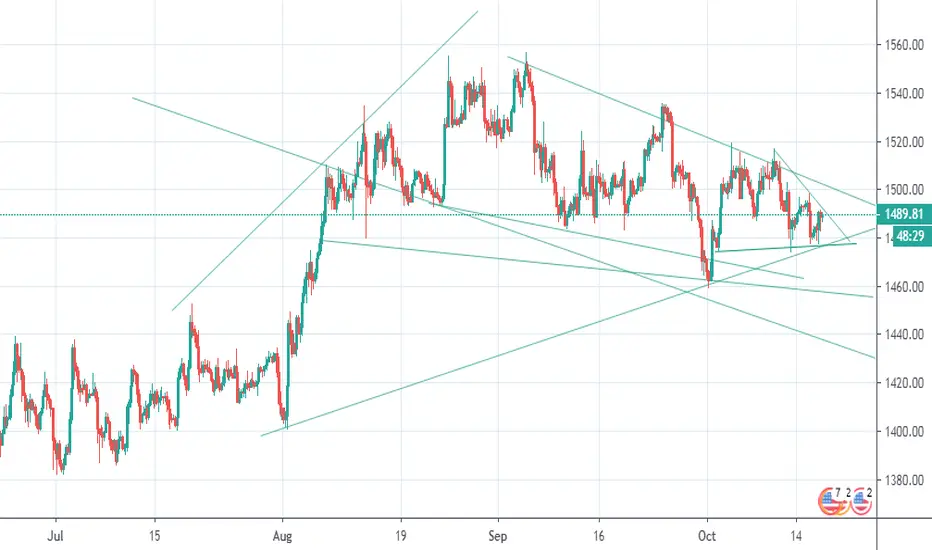
ShortI am not so much expert but what I can see here that it is changing from flag up pattern to triangle one also towards downwards. I think from 1479. It will start falling for long term because it will break out the pattern or it will go beyond if it breaks 1502 resistance which usual one for short term. but my best suggestion goes for Short Term. Rest is upto your guys. If you like my idea then Hit up. Please suggest your views as well. I analysed on H4 and Day chart.
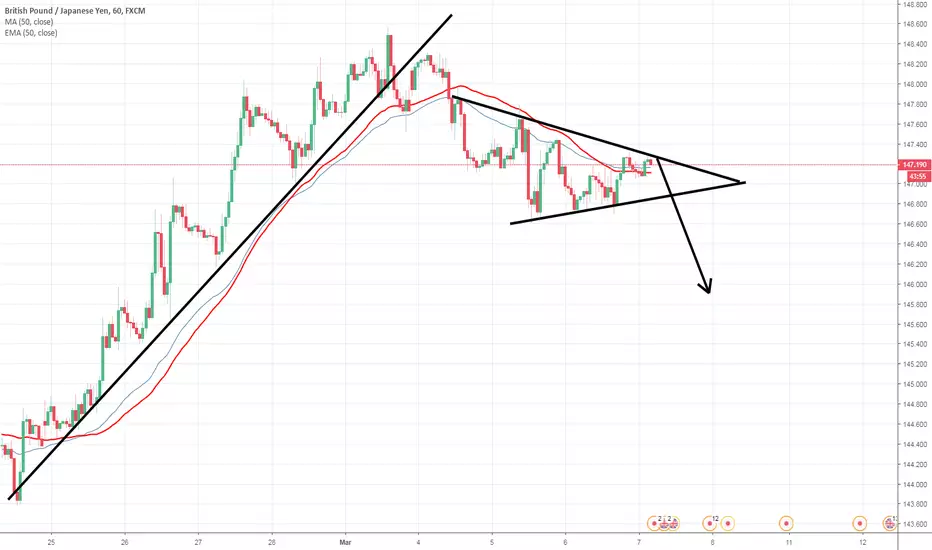
GBPJPY | Short IdeaTriangle pattern has formed, following the previous downward move, I would expect this triangle to continue a breakout to the downside.