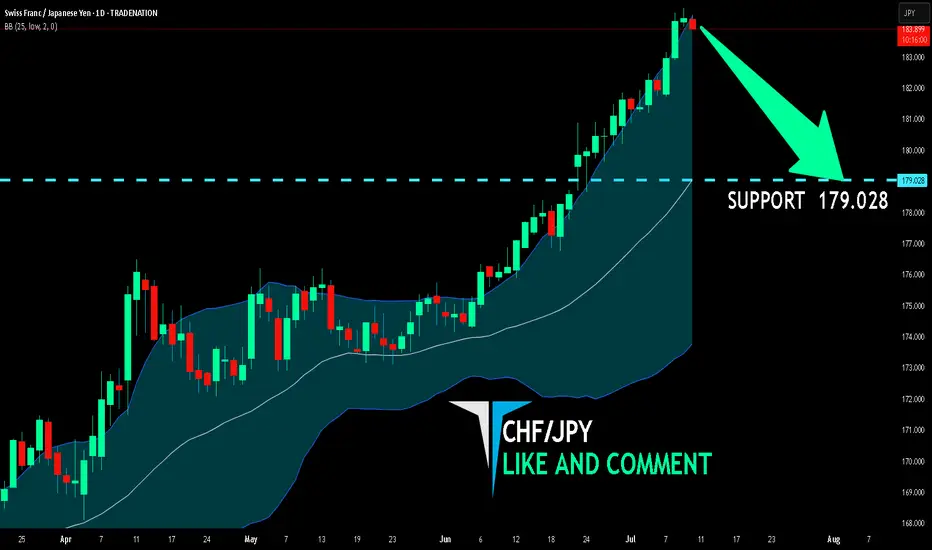
CHF/JPY BEARISH BIAS RIGHT NOW| SHORT
Hello, Friends!
We are going short on the CHF/JPY with the target of 179.028 level, because the pair is overbought and will soon hit the resistance line above. We deduced the overbought condition from the price being near to the upper BB band. However, we should use low risk here because the 1W TF is green and gives us a counter-signal.
Disclosure: I am part of Trade Nation's Influencer program and receive a monthly fee for using their TradingView charts in my analysis.
✅LIKE AND COMMENT MY IDEAS✅
Short
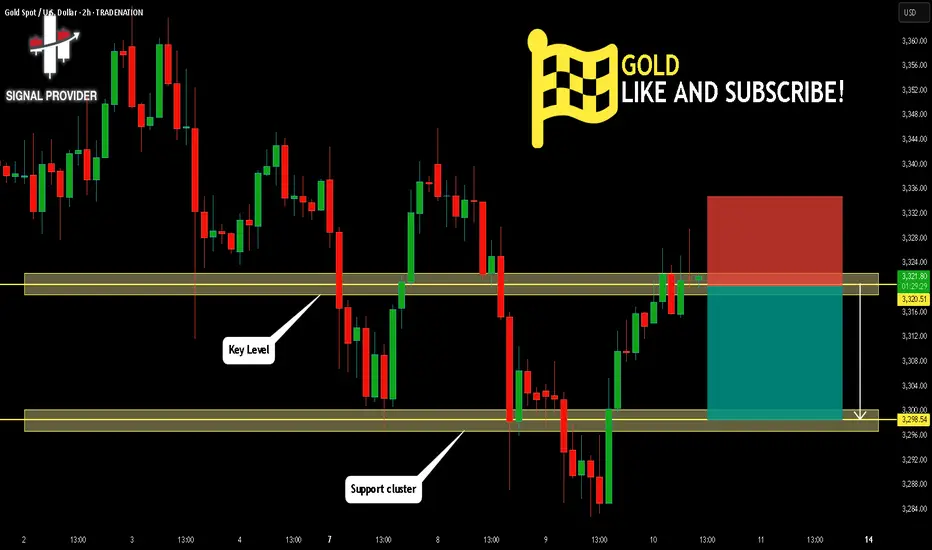
GOLD Is Very Bearish! Short!
Here is our detailed technical review for GOLD.
Time Frame: 2h
Current Trend: Bearish
Sentiment: Overbought (based on 7-period RSI)
Forecast: Bearish
The market is approaching a significant resistance area 3,320.51.
Due to the fact that we see a positive bearish reaction from the underlined area, I strongly believe that sellers will manage to push the price all the way down to 3,298.54 level.
P.S
Please, note that an oversold/overbought condition can last for a long time, and therefore being oversold/overbought doesn't mean a price rally will come soon, or at all.
Disclosure: I am part of Trade Nation's Influencer program and receive a monthly fee for using their TradingView charts in my analysis.
Like and subscribe and comment my ideas if you enjoy them!
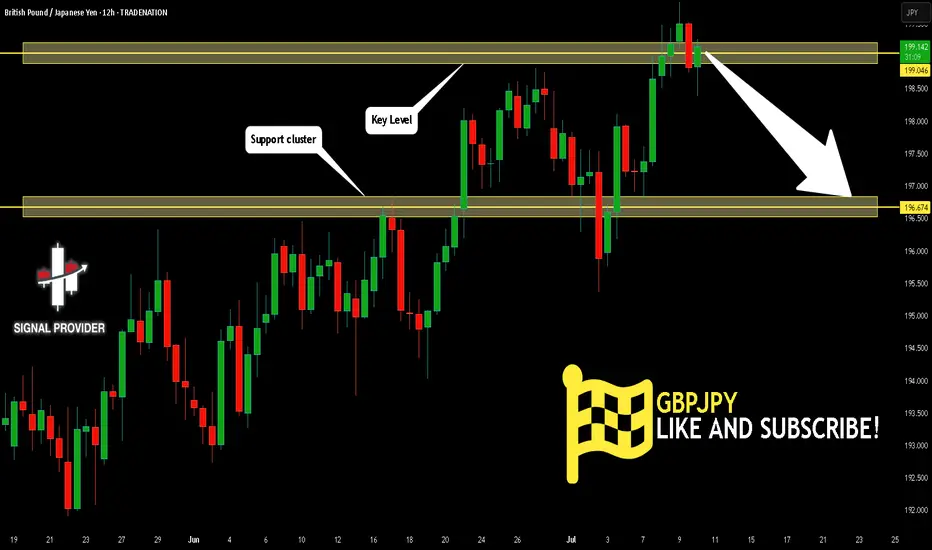
GBPJPY Will Go Lower From Resistance! Sell!
Here is our detailed technical review for GBPJPY.
Time Frame: 12h
Current Trend: Bearish
Sentiment: Overbought (based on 7-period RSI)
Forecast: Bearish
The market is trading around a solid horizontal structure 199.046.
The above observations make me that the market will inevitably achieve 196.674 level.
P.S
Overbought describes a period of time where there has been a significant and consistent upward move in price over a period of time without much pullback.
Disclosure: I am part of Trade Nation's Influencer program and receive a monthly fee for using their TradingView charts in my analysis.
Like and subscribe and comment my ideas if you enjoy them!
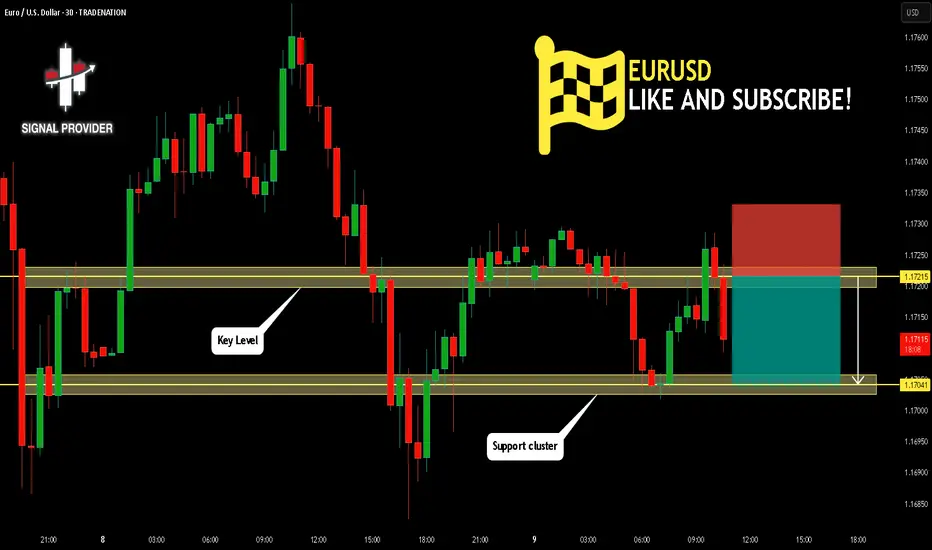
EURUSD Will Go Lower! Short!
Please, check our technical outlook for EURUSD.
Time Frame: 30m
Current Trend: Bearish
Sentiment: Overbought (based on 7-period RSI)
Forecast: Bearish
The market is approaching a key horizontal level 1.172.
Considering the today's price action, probabilities will be high to see a movement to 1.170.
P.S
The term oversold refers to a condition where an asset has traded lower in price and has the potential for a price bounce.
Overbought refers to market scenarios where the instrument is traded considerably higher than its fair value. Overvaluation is caused by market sentiments when there is positive news.
Disclosure: I am part of Trade Nation's Influencer program and receive a monthly fee for using their TradingView charts in my analysis.
Like and subscribe and comment my ideas if you enjoy them!
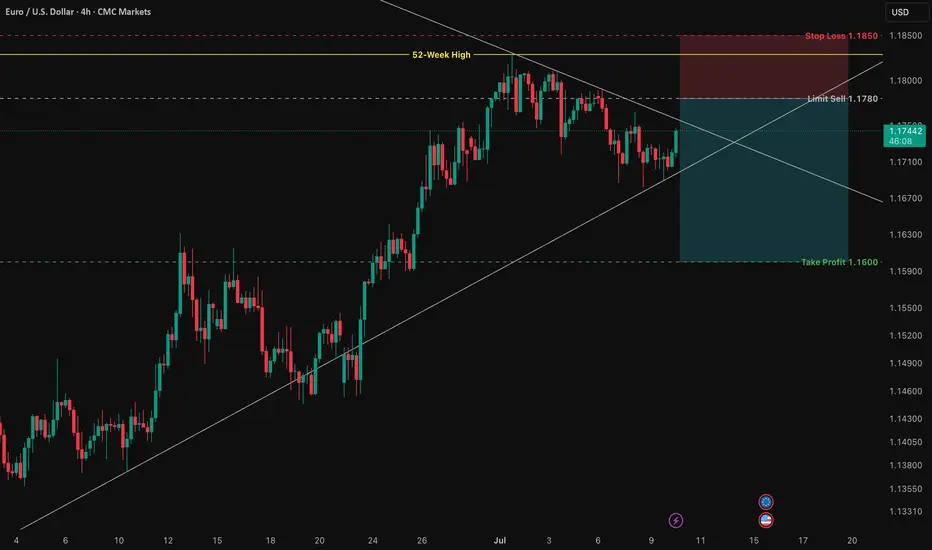
EUR/USD: A High-Probability Short Setup at 1.1829At its core, this trade is driven by a powerful and growing divergence between the US and European economies. While technicals tell us where to trade, fundamentals tell us why we're trading.
1️⃣ The Interest Rate Gap: The U.S. currently offers significantly higher interest rates (4.25% - 4.50%) compared to the Eurozone (2.15%). This makes holding the US Dollar more attractive, creating natural downward pressure on the EUR/USD.
2️⃣ Central Bank Policy: The US Federal Reserve remains hawkish, focused on strength and fighting inflation. Meanwhile, the European Central Bank is dovish, signaling a willingness to keep conditions loose to support a weaker economy.
3️⃣ Labor Market Strength: The US enjoys a robust labor market with unemployment at just 4.1%, while the Eurozone's is significantly higher at 6.3%. This points to a stronger US economy.
In simple terms, the US economy is strong, and its central bank is acting like it. The Eurozone economy is weaker, and its central bank is acting accordingly. This fundamental imbalance is the fuel for a potential significant move down in EUR/USD.
The Technical Picture: The Wall at 1.1829
As you can see on the 4H chart, the price has run into a major wall of resistance at the 52-week high of 1.1829 . After a long uptrend, the momentum has stalled, and the price is now consolidating inside a symmetrical triangle . This coiling of price action often precedes a strong breakout.
Our strategy is not to guess the breakout, but to act on a high-probability retest of resistance. We are looking to enter a short position as the price pulls back towards the upper boundary of this triangle, anticipating a failure at resistance and a subsequent break to the downside.
The Actionable Trade Plan
This setup offers an excellent risk/reward profile.
📉 Asset: EUR/USD
👉 Entry (Limit Sell): 1.1780
⛔️ Stop Loss: 1.1850
🎯 Take Profit: 1.1600
📈 Risk/Reward Ratio: ~2.57:1
Trade safe and manage your risk.
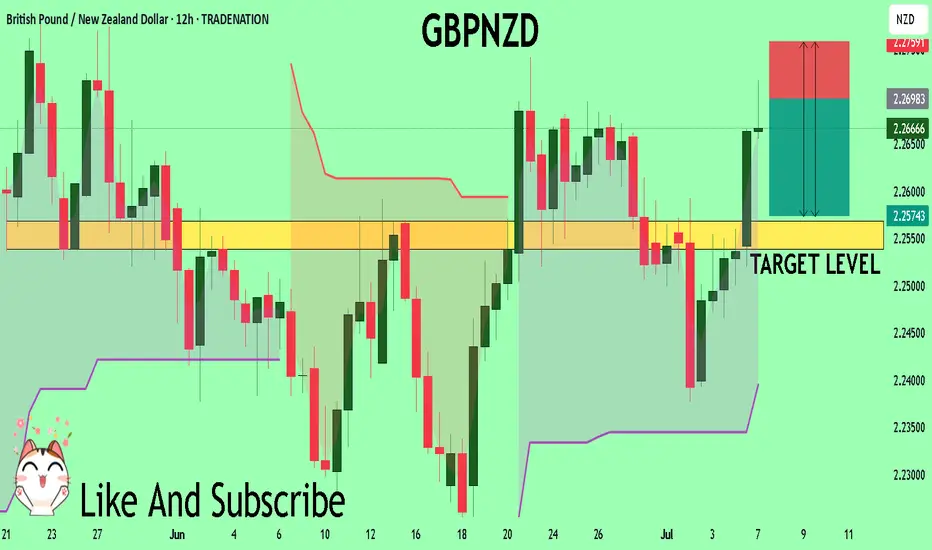
GBPNZD Set To Fall! SELL!
My dear subscribers,
This is my opinion on the GBPNZD next move:
The instrument tests an important psychological level 2.2694
Bias - Bearish
Technical Indicators: Supper Trend gives a precise Bearish signal, while Pivot Point HL predicts price changes and potential reversals in the market.
Target - 2.2568
My Stop Loss - 2.2759
About Used Indicators:
On the subsequent day, trading above the pivot point is thought to indicate ongoing bullish sentiment, while trading below the pivot point indicates bearish sentiment.
Disclosure: I am part of Trade Nation's Influencer program and receive a monthly fee for using their TradingView charts in my analysis.
———————————
WISH YOU ALL LUCK
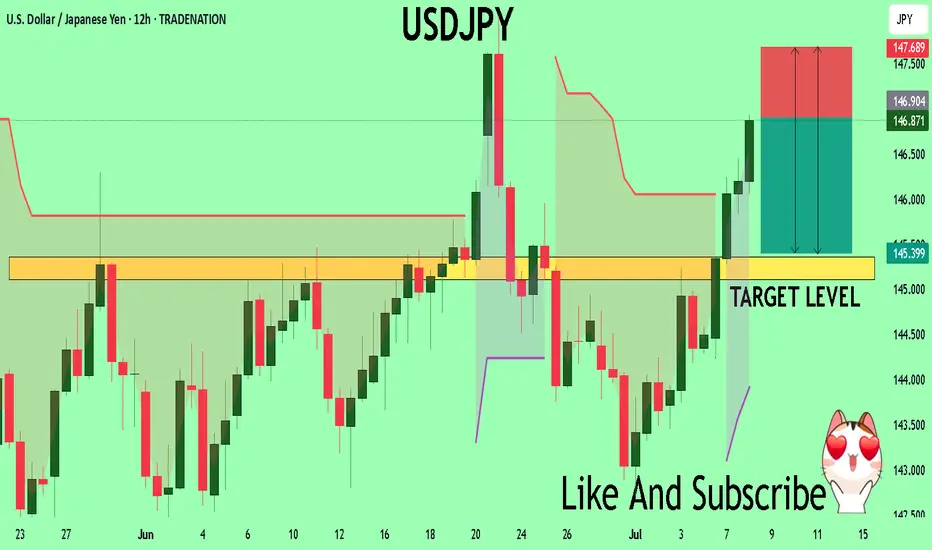
USDJPY What Next? SELL!
My dear followers,
I analysed this chart on USDJPY and concluded the following:
The market is trading on 146.88 pivot level.
Bias - Bearish
Technical Indicators: Both Super Trend & Pivot HL indicate a highly probable Bearish continuation.
Target - 145.35
Safe Stop Loss - 147.68
About Used Indicators:
A super-trend indicator is plotted on either above or below the closing price to signal a buy or sell. The indicator changes color, based on whether or not you should be buying. If the super-trend indicator moves below the closing price, the indicator turns green, and it signals an entry point or points to buy.
Disclosure: I am part of Trade Nation's Influencer program and receive a monthly fee for using their TradingView charts in my analysis.
———————————
WISH YOU ALL LUCK
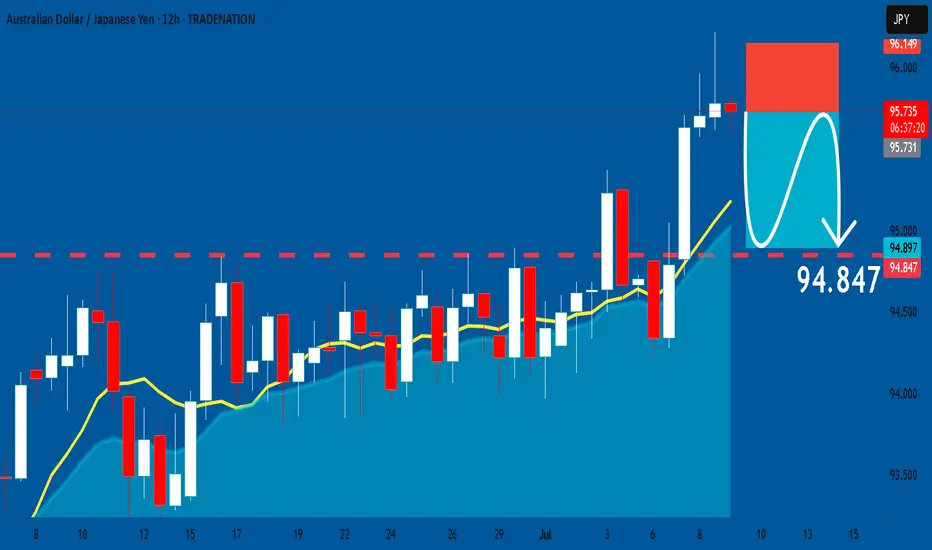
AUDJPY: Short Trade with Entry/SL/TP
AUDJPY
- Classic bearish pattern
- Our team expects retracement
SUGGESTED TRADE:
Swing Trade
Sell AUDJPY
Entry - 95.749
Stop - 96.149
Take - 94.847
Our Risk - 1%
Start protection of your profits from lower levels
Disclosure: I am part of Trade Nation's Influencer program and receive a monthly fee for using their TradingView charts in my analysis.
❤️ Please, support our work with like & comment! ❤️
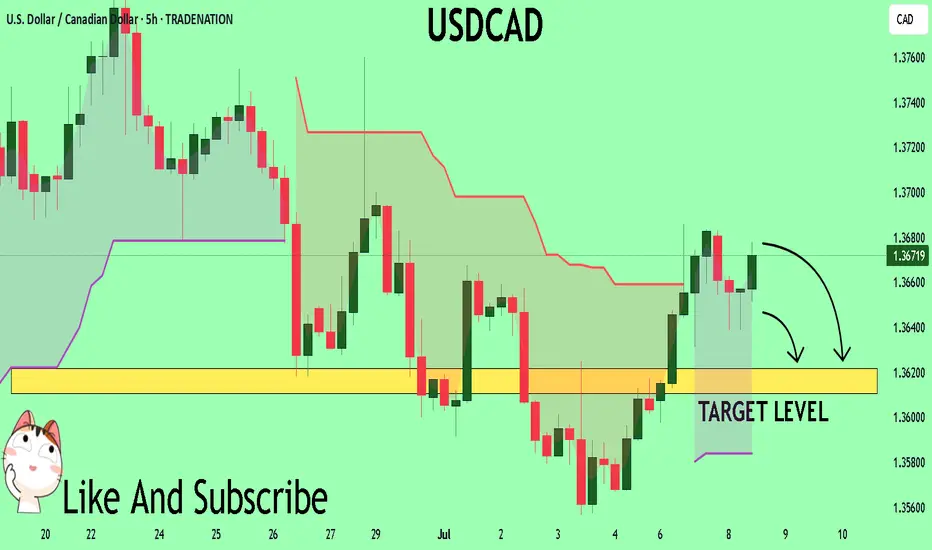
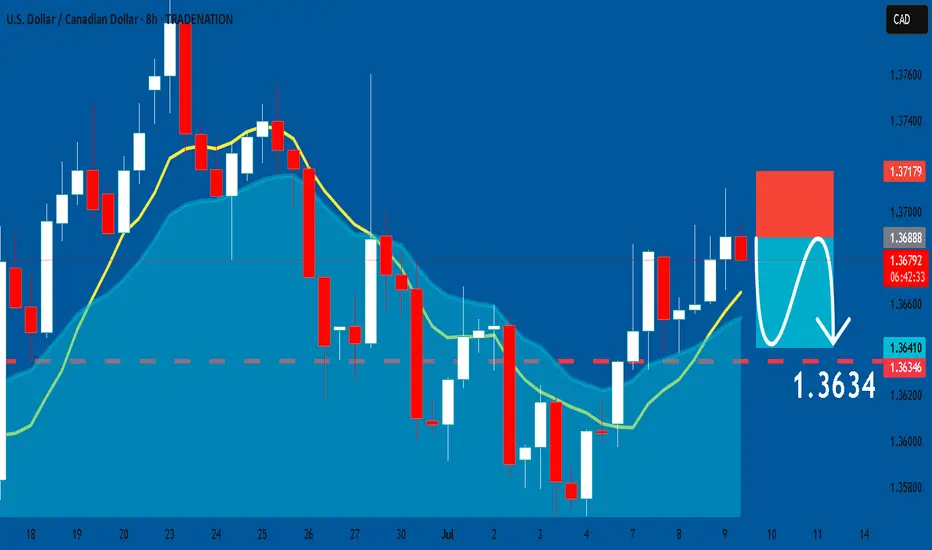
USDCAD: Bearish Continuation & Short Signal
USDCAD
- Classic bearish setup
- Our team expects bearish continuation
SUGGESTED TRADE:
Swing Trade
Short USDCAD
Entry Point - 1.3688
Stop Loss - 1.3717
Take Profit - 1.3634
Our Risk - 1%
Start protection of your profits from lower levels
Disclosure: I am part of Trade Nation's Influencer program and receive a monthly fee for using their TradingView charts in my analysis.
❤️ Please, support our work with like & comment! ❤️
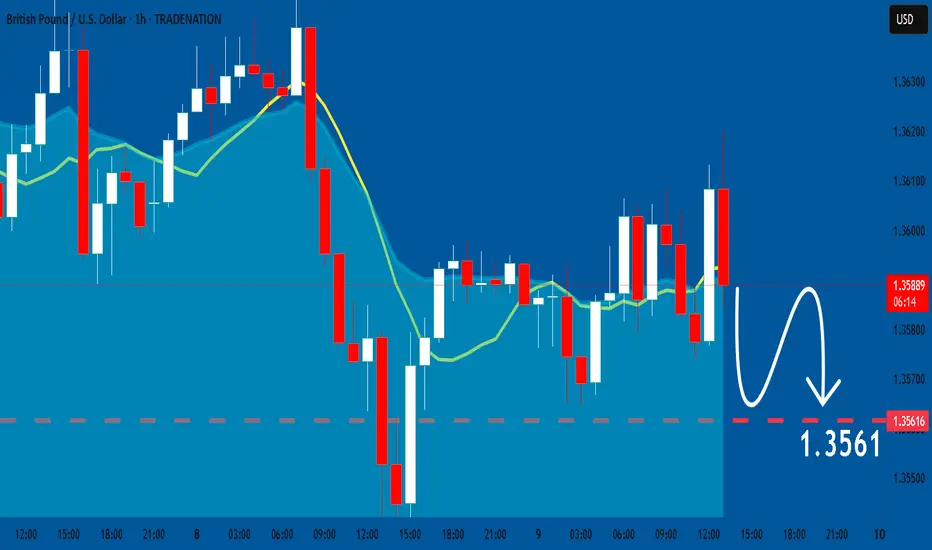
GBPUSD: Market of Sellers
The analysis of the GBPUSD chart clearly shows us that the pair is finally about to tank due to the rising pressure from the sellers.
Disclosure: I am part of Trade Nation's Influencer program and receive a monthly fee for using their TradingView charts in my analysis.
❤️ Please, support our work with like & comment! ❤️
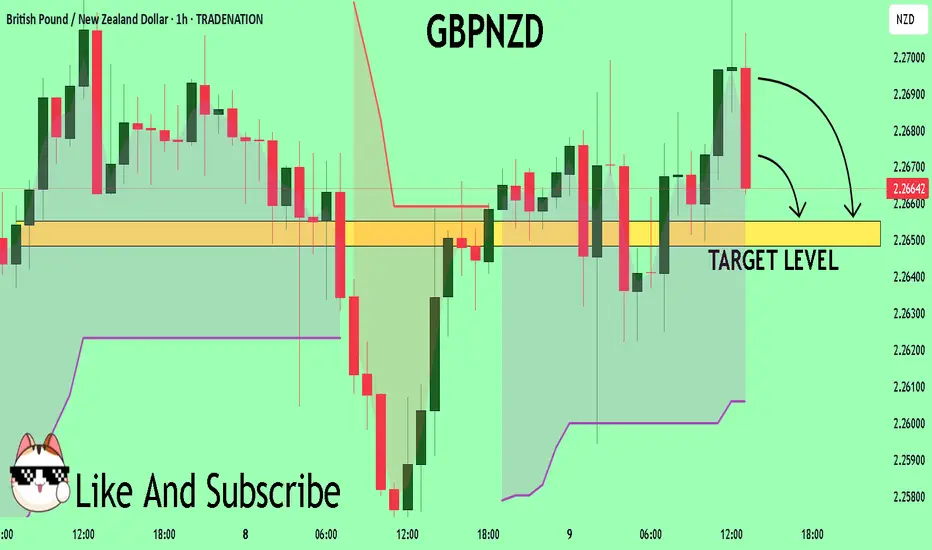
GBPNZD A Fall Expected! SELL!
My dear subscribers,
This is my opinion on the GBPNZD next move:
The instrument tests an important psychological level 2.2683
Bias - Bearish
Technical Indicators: Supper Trend gives a precise Bearish signal, while Pivot Point HL predicts price changes and potential reversals in the market.
Target - 2.2655
About Used Indicators:
On the subsequent day, trading above the pivot point is thought to indicate ongoing bullish sentiment, while trading below the pivot point indicates bearish sentiment.
Disclosure: I am part of Trade Nation's Influencer program and receive a monthly fee for using their TradingView charts in my analysis.
———————————
WISH YOU ALL LUCK
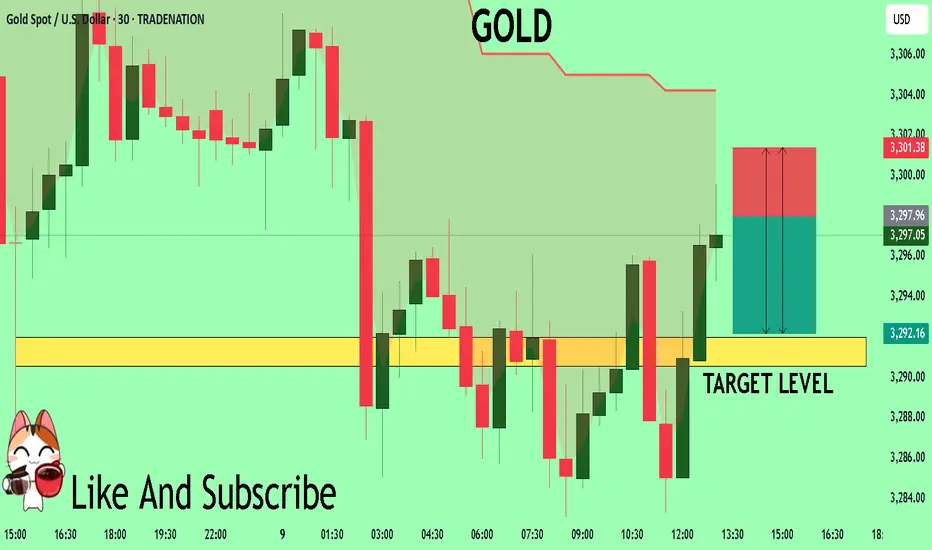
GOLD Trading Opportunity! SELL!
My dear subscribers,
My technical analysis for GOLD is below:
The price is coiling around a solid key level - 3297.6
Bias - Bearish
Technical Indicators: Pivot Points High anticipates a potential price reversal.
Super trend shows a clear sell, giving a perfect indicators' convergence.
Goal - 3291.9
My Stop Loss - 3301.3
About Used Indicators:
By the very nature of the supertrend indicator, it offers firm support and resistance levels for traders to enter and exit trades. Additionally, it also provides signals for setting stop losses
Disclosure: I am part of Trade Nation's Influencer program and receive a monthly fee for using their TradingView charts in my analysis.
———————————
WISH YOU ALL LUCK
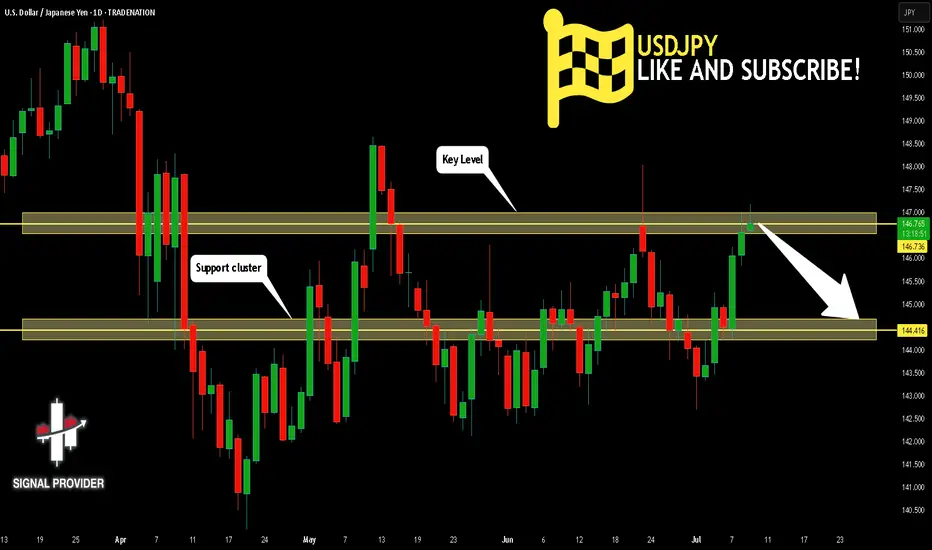
USDJPY Will Go Down! Sell!
Here is our detailed technical review for USDJPY.
Time Frame: 1D
Current Trend: Bearish
Sentiment: Overbought (based on 7-period RSI)
Forecast: Bearish
The market is approaching a significant resistance area 146.736.
Due to the fact that we see a positive bearish reaction from the underlined area, I strongly believe that sellers will manage to push the price all the way down to 144.416 level.
P.S
We determine oversold/overbought condition with RSI indicator.
When it drops below 30 - the market is considered to be oversold.
When it bounces above 70 - the market is considered to be overbought.
Disclosure: I am part of Trade Nation's Influencer program and receive a monthly fee for using their TradingView charts in my analysis.
Like and subscribe and comment my ideas if you enjoy them!
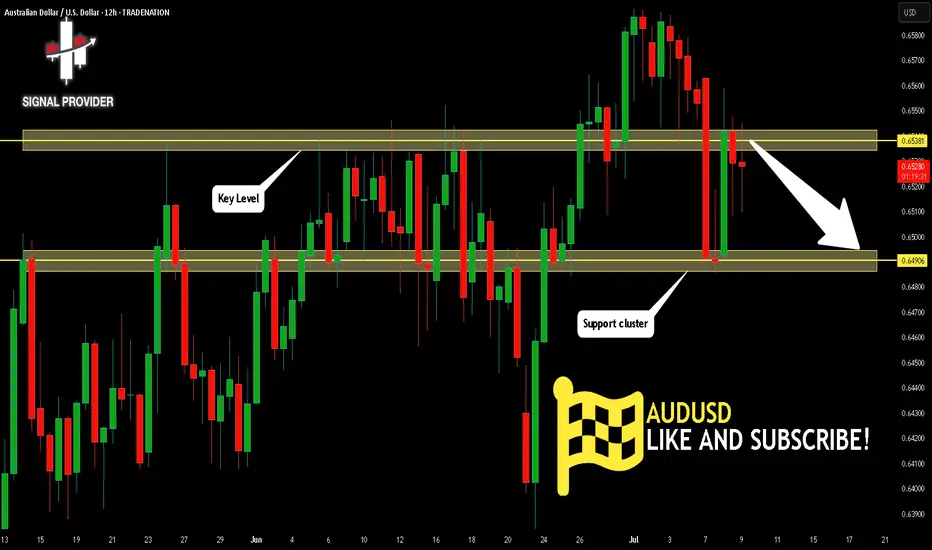
AUDUSD Will Move Lower! Short!
Take a look at our analysis for AUDUSD.
Time Frame: 12h
Current Trend: Bearish
Sentiment: Overbought (based on 7-period RSI)
Forecast: Bearish
The market is on a crucial zone of supply 0.653.
The above-mentioned technicals clearly indicate the dominance of sellers on the market. I recommend shorting the instrument, aiming at 0.649 level.
P.S
Overbought describes a period of time where there has been a significant and consistent upward move in price over a period of time without much pullback.
Disclosure: I am part of Trade Nation's Influencer program and receive a monthly fee for using their TradingView charts in my analysis.
Like and subscribe and comment my ideas if you enjoy them!
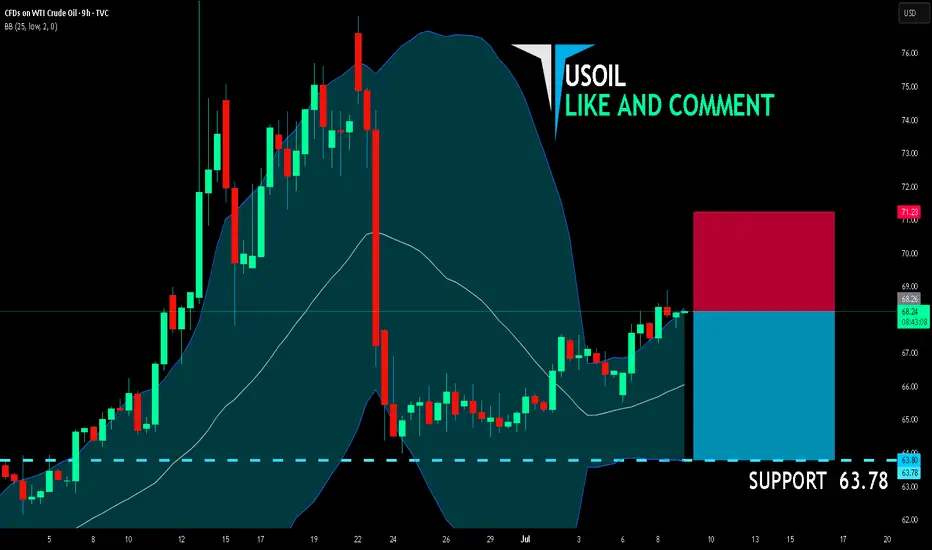
USOIL BEST PLACE TO SELL FROM|SHORT
USOIL SIGNAL
Trade Direction: short
Entry Level: 68.26
Target Level: 63.78
Stop Loss: 71.23
RISK PROFILE
Risk level: medium
Suggested risk: 1%
Timeframe: 9h
Disclosure: I am part of Trade Nation's Influencer program and receive a monthly fee for using their TradingView charts in my analysis.
✅LIKE AND COMMENT MY IDEAS✅
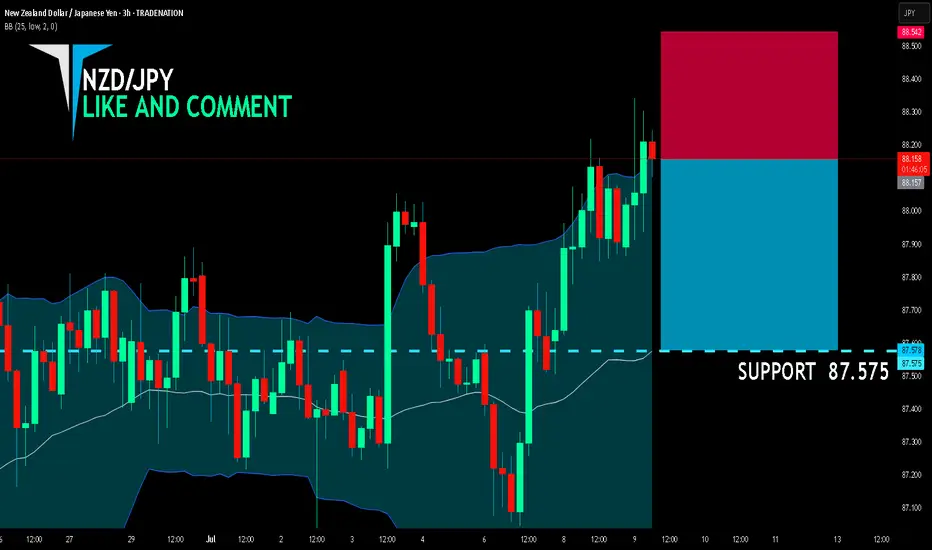
NZD/JPY BEARS ARE STRONG HERE|SHORT
NZD/JPY SIGNAL
Trade Direction: short
Entry Level: 88.157
Target Level: 87.575
Stop Loss: 88.542
RISK PROFILE
Risk level: medium
Suggested risk: 1%
Timeframe: 3h
Disclosure: I am part of Trade Nation's Influencer program and receive a monthly fee for using their TradingView charts in my analysis.
✅LIKE AND COMMENT MY IDEAS✅
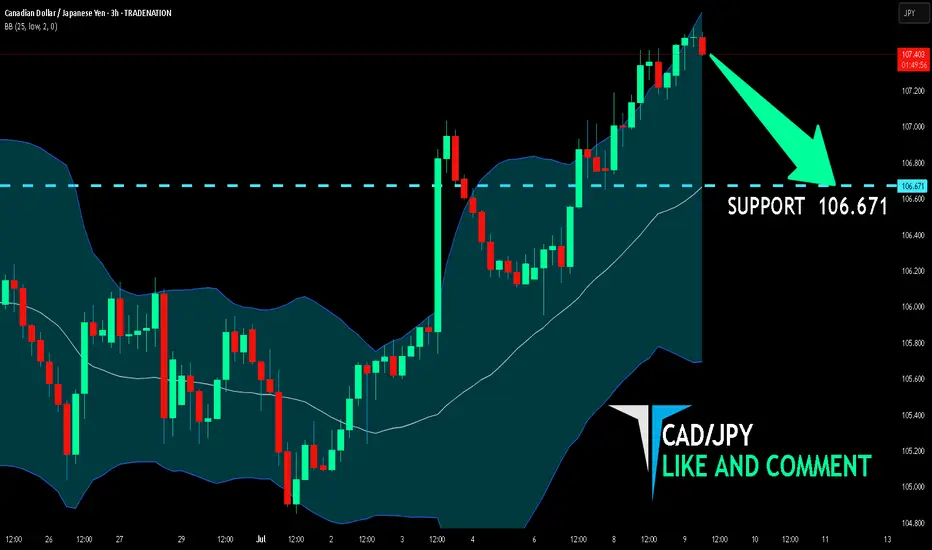
CAD/JPY SHORT FROM RESISTANCE
Hello, Friends!
CAD/JPY is making a bullish rebound on the 3H TF and is nearing the resistance line above while we are generally bearish biased on the pair due to our previous 1W candle analysis, thus making a trend-following short a good option for us with the target being the 106.671 level.
Disclosure: I am part of Trade Nation's Influencer program and receive a monthly fee for using their TradingView charts in my analysis.
✅LIKE AND COMMENT MY IDEAS✅
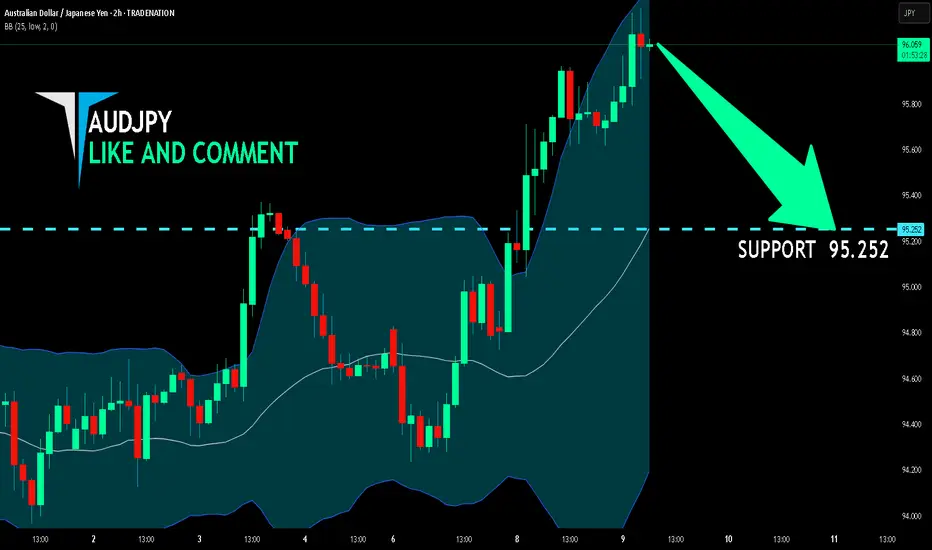
AUD/JPY BEARS WILL DOMINATE THE MARKET|SHORT
Hello, Friends!
The BB upper band is nearby so AUD/JPY is in the overbought territory. Thus, despite the uptrend on the 1W timeframe I think that we will see a bearish reaction from the resistance line above and a move down towards the target at around 95.252.
Disclosure: I am part of Trade Nation's Influencer program and receive a monthly fee for using their TradingView charts in my analysis.
✅LIKE AND COMMENT MY IDEAS✅
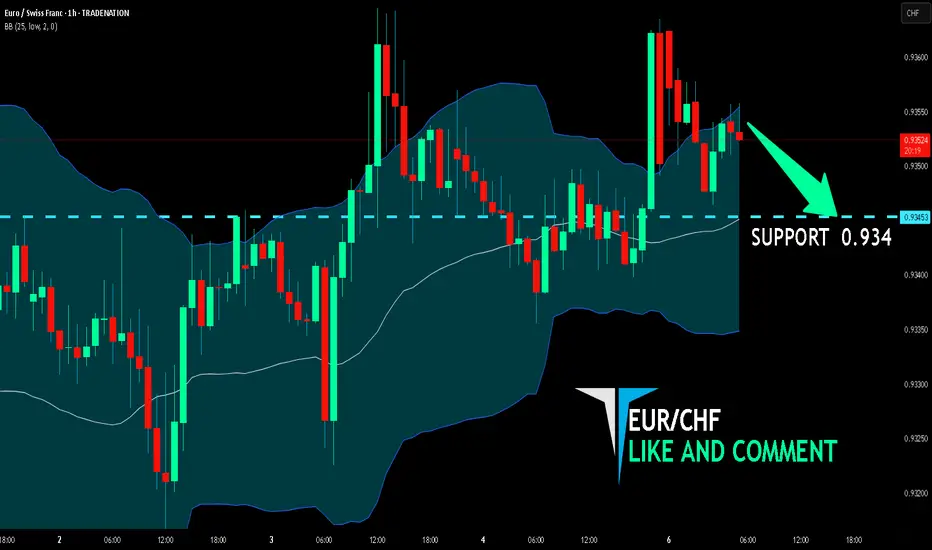
EUR/CHF BEARS WILL DOMINATE THE MARKET|SHORT
Hello, Friends!
EUR/CHF pair is trading in a local downtrend which know by looking at the previous 1W candle which is red. On the 1H timeframe the pair is going up. The pair is overbought because the price is close to the upper band of the BB indicator. So we are looking to sell the pair with the upper BB line acting as resistance. The next target is 0.934 area.
Disclosure: I am part of Trade Nation's Influencer program and receive a monthly fee for using their TradingView charts in my analysis.
✅LIKE AND COMMENT MY IDEAS✅
HYPE — Targeting Liquidity Below Monday Low1. While below Monday low — bearish, target liquidity
2. TP1: 35.34
3. TP2: 30.60
4. Above Monday low = scenario invalid

Running Flat FormationHere we have a Running Flat Formation. At point C it looks to me that price has broken the small upward trend it was in and has imprinted a H&S formation and broken to the downside. I'm waiting for a retest on the previous new structure low (NSL) before taking an entry.

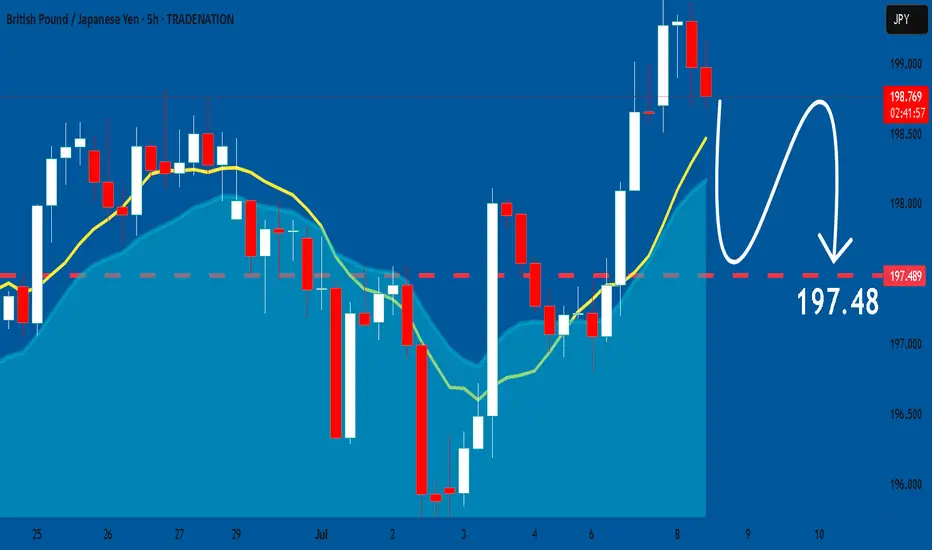
GBPJPY: Bearish Forecast & Outlook
Looking at the chart of GBPJPY right now we are seeing some interesting price action on the lower timeframes. Thus a local move down seems to be quite likely.
Disclosure: I am part of Trade Nation's Influencer program and receive a monthly fee for using their TradingView charts in my analysis.
❤️ Please, support our work with like & comment! ❤️
USDCAD My Opinion! SELL!
My dear friends,
Please, find my technical outlook for USDCAD below:
The price is coiling around a solid key level - 1.3669
Bias - Bearish
Technical Indicators: Pivot Points High anticipates a potential price reversal.
Super trend shows a clear sell, giving a perfect indicators' convergence.
Goal - 1.3621
About Used Indicators:
The pivot point itself is simply the average of the high, low and closing prices from the previous trading day.
Disclosure: I am part of Trade Nation's Influencer program and receive a monthly fee for using their TradingView charts in my analysis.
———————————
WISH YOU ALL LUCK