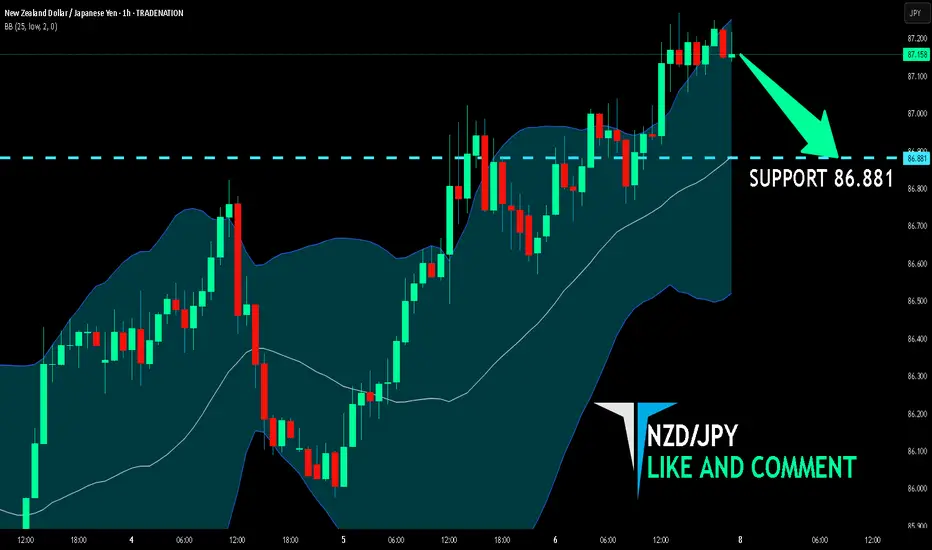
NZD/JPY BEARS WILL DOMINATE THE MARKET|SHORT
Hello, Friends!
NZD-JPY uptrend evident from the last 1W green candle makes short trades more risky, but the current set-up targeting 86.881 area still presents a good opportunity for us to sell the pair because the resistance line is nearby and the BB upper band is close which indicates the overbought state of the NZD/JPY pair.
Disclosure: I am part of Trade Nation's Influencer program and receive a monthly fee for using their TradingView charts in my analysis.
✅LIKE AND COMMENT MY IDEAS✅
Short
dydx sell midterm "🌟 Welcome to Golden Candle! 🌟
We're a team of 📈 passionate traders 📉 who love sharing our 🔍 technical analysis insights 🔎 with the TradingView community. 🌎
Our goal is to provide 💡 valuable perspectives 💡 on market trends and patterns, but 🚫 please note that our analyses are not intended as buy or sell recommendations. 🚫
Instead, they reflect our own 💭 personal attitudes and thoughts. 💭
Follow along and 📚 learn 📚 from our analyses! 📊💡"

Short TSLA, Long QQQTSLA is expected to under-perform the QQQ ETF.
Whether it goes up or down in price, this trade will make money as long as the Nasdaq-100 index is stronger than TSLA.
VERY WIDE stop-loss is required.

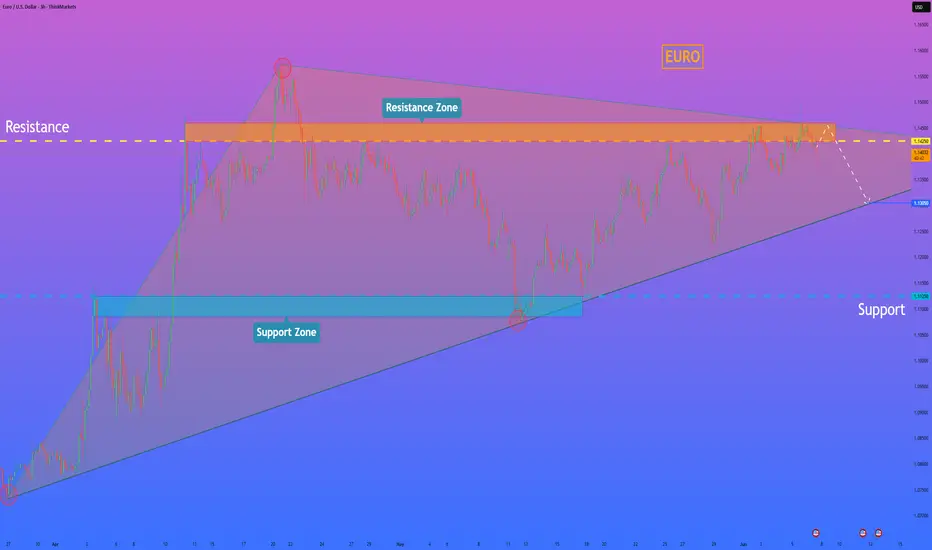
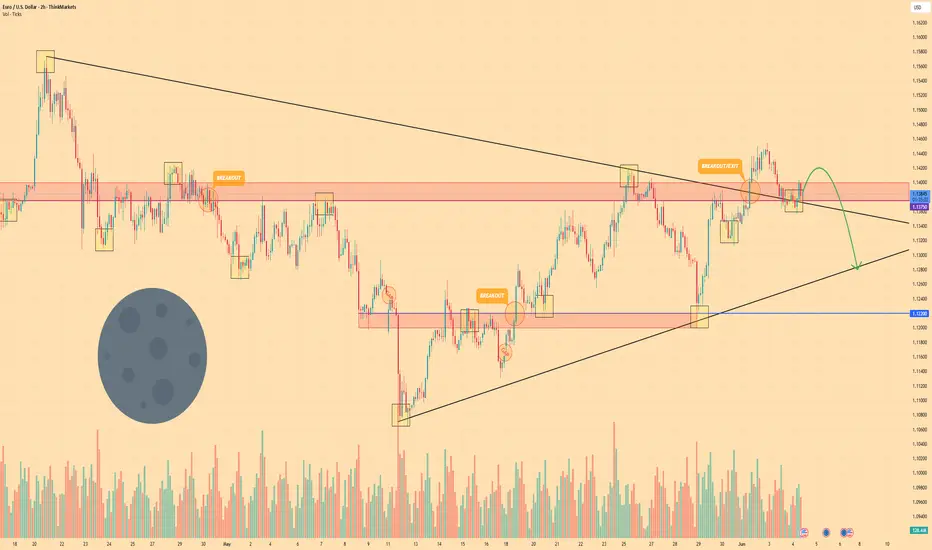
HelenP. I Euro may continue to decline to trend lineHi folks today I'm prepared for you Euro analytics. In this chart, we can see how the price reached the trend line and then started to grow inside a triangle pattern. Price some time traded near the trend line and then made an impulse up to the support level, which coincided with the support zone, and then made a correction, after which it turned around and made an impulse up one more time, breaking the support level. The euro reached the resistance level, which coincided with the resistance zone, and then made a small correction, after which it continued to move up and rose to the resistance line of the triangle. But then the Euro dropped below the resistance level, breaking it, and then continued to decline, after a retest. Price fell to the support zone, where it rebounded from the trend line, which is the support line of the triangle as well, and then started to grow. The euro has grown to a resistance zone, but recently it started to fall and now trades below the 1.1425 resistance level. So, I think that EURUSD will enter to resistance zone one more time and then continue to fall to the trend line. For this case, I set my goal at 1.1305 points, which coincided with this line. If you like my analytics you may support me with your like/comment ❤️
Disclaimer: As part of ThinkMarkets’ Influencer Program, I am sponsored to share and publish their charts in my analysis.
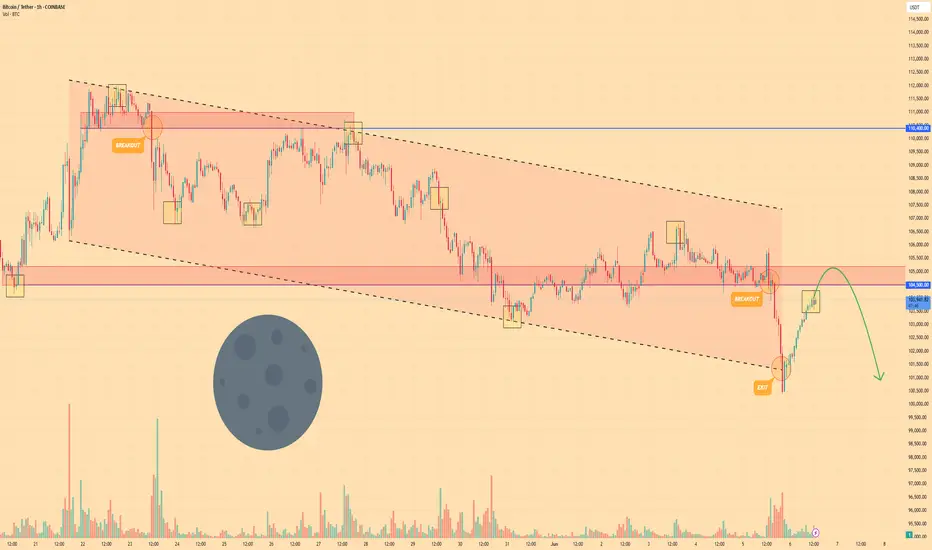
BITCOIN - Price can reach resistance area and then dropHi guys, this is my overview for BTCUSDT, feel free to check it and write your feedback in comments👊
Recently, the price bounced from the $104500 level and rose to the $110400 level, breaking this level and rising a little more.
But then price turned around and started to decline inside a falling channel, where it fell below $110400 level.
Price tried to back up, but failed and when it touched $110400 level, it in a short time declined to support line of channel.
Then price rose above $104500 level and some time traded near this level, but not long time ago it dropped.
BTC broke $104500 level and even fell further and exited from falling channel, after which it started to grow.
Now, I expect that Bitcoin can enter to resistance area and then drop to $100900 from this area.
If this post is useful to you, you can support me with like/boost and advice in comments❤️
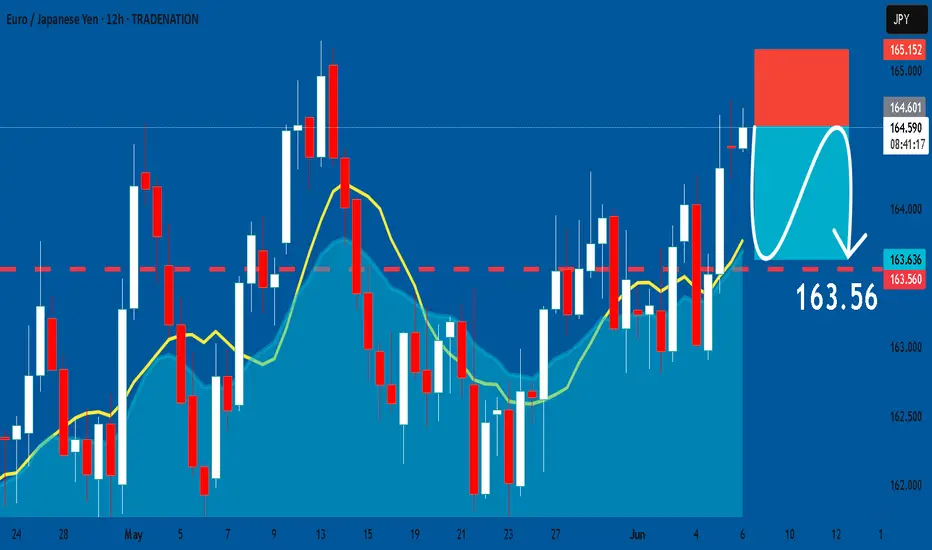
EURJPY: Short Trade with Entry/SL/TP
EURJPY
- Classic bearish setup
- Our team expects bearish continuation
SUGGESTED TRADE:
Swing Trade
Short EURJPY
Entry Point - 164.60
Stop Loss - 165.15
Take Profit - 163.56
Our Risk - 1%
Start protection of your profits from lower levels
Disclosure: I am part of Trade Nation's Influencer program and receive a monthly fee for using their TradingView charts in my analysis.
❤️ Please, support our work with like & comment! ❤️
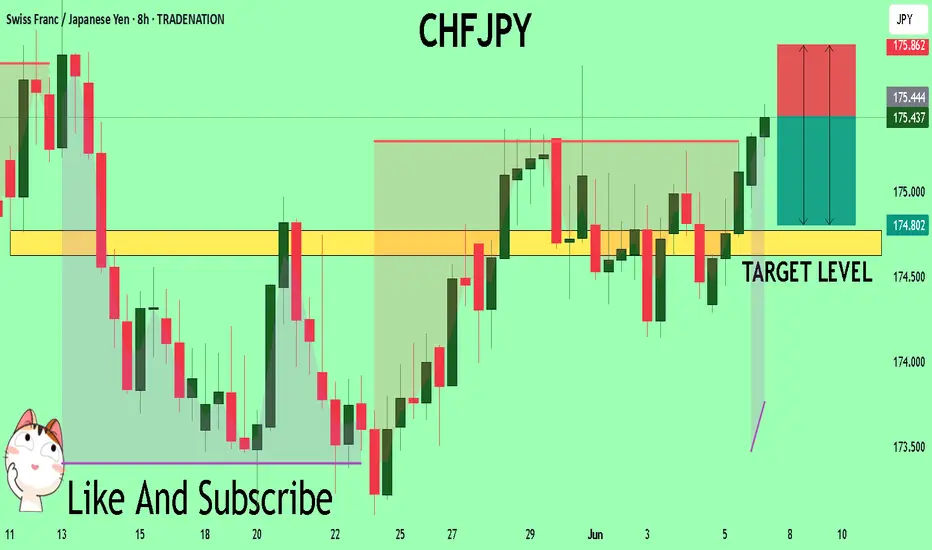
CHFJPY Massive Short! SELL!
My dear subscribers,
CHFJPY looks like it will make a good move, and here are the details:
The market is trading on 175.45 pivot level.
Bias - Bearish
My Stop Loss - 175.86
Technical Indicators: Both Super Trend & Pivot HL indicate a highly probable Bearish continuation.
Target - 174.76
About Used Indicators:
The average true range (ATR) plays an important role in 'Supertrend' as the indicator uses ATR to calculate its value. The ATR indicator signals the degree of price volatility.
Disclosure: I am part of Trade Nation's Influencer program and receive a monthly fee for using their TradingView charts in my analysis.
———————————
WISH YOU ALL LUCK
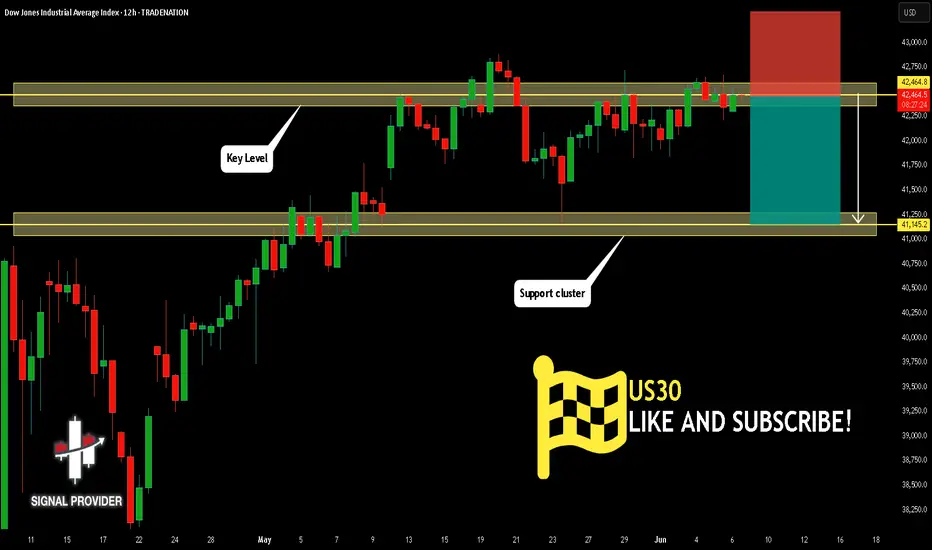
US30 Will Move Lower! Short!
Here is our detailed technical review for US30.
Time Frame: 12h
Current Trend: Bearish
Sentiment: Overbought (based on 7-period RSI)
Forecast: Bearish
The market is approaching a significant resistance area 42,464.8.
Due to the fact that we see a positive bearish reaction from the underlined area, I strongly believe that sellers will manage to push the price all the way down to 41,145.2 level.
P.S
The term oversold refers to a condition where an asset has traded lower in price and has the potential for a price bounce.
Overbought refers to market scenarios where the instrument is traded considerably higher than its fair value. Overvaluation is caused by market sentiments when there is positive news.
Disclosure: I am part of Trade Nation's Influencer program and receive a monthly fee for using their TradingView charts in my analysis.
Like and subscribe and comment my ideas if you enjoy them!
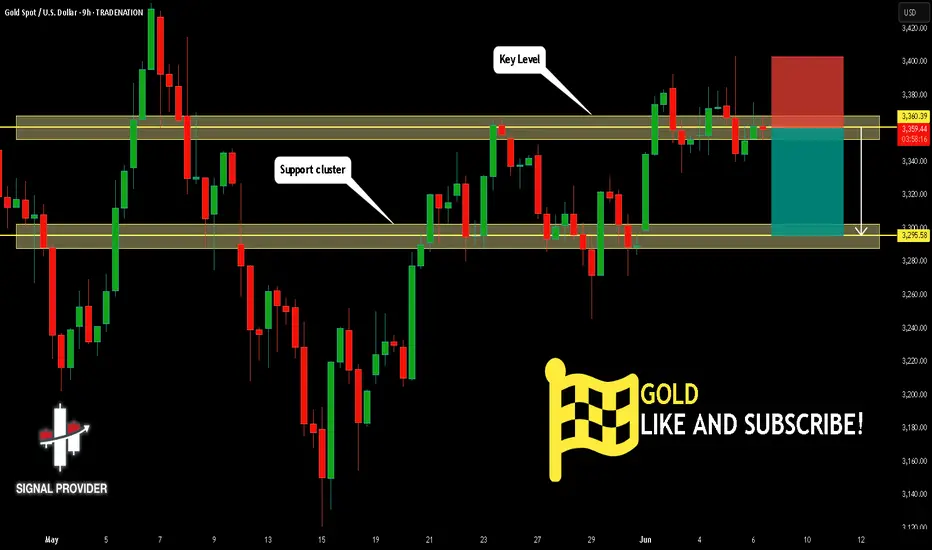
GOLD Is Bearish! Sell!
Take a look at our analysis for GOLD.
Time Frame: 9h
Current Trend: Bearish
Sentiment: Overbought (based on 7-period RSI)
Forecast: Bearish
The market is on a crucial zone of supply 3,360.39.
The above-mentioned technicals clearly indicate the dominance of sellers on the market. I recommend shorting the instrument, aiming at 3,295.58 level.
P.S
We determine oversold/overbought condition with RSI indicator.
When it drops below 30 - the market is considered to be oversold.
When it bounces above 70 - the market is considered to be overbought.
Disclosure: I am part of Trade Nation's Influencer program and receive a monthly fee for using their TradingView charts in my analysis.
Like and subscribe and comment my ideas if you enjoy them!
CADJPY: Bearish Forecast & Bearish Scenario
The charts are full of distraction, disturbance and are a graveyard of fear and greed which shall not cloud our judgement on the current state of affairs in the CADJPY pair price action which suggests a high likelihood of a coming move down.
Disclosure: I am part of Trade Nation's Influencer program and receive a monthly fee for using their TradingView charts in my analysis.
❤️ Please, support our work with like & comment! ❤️

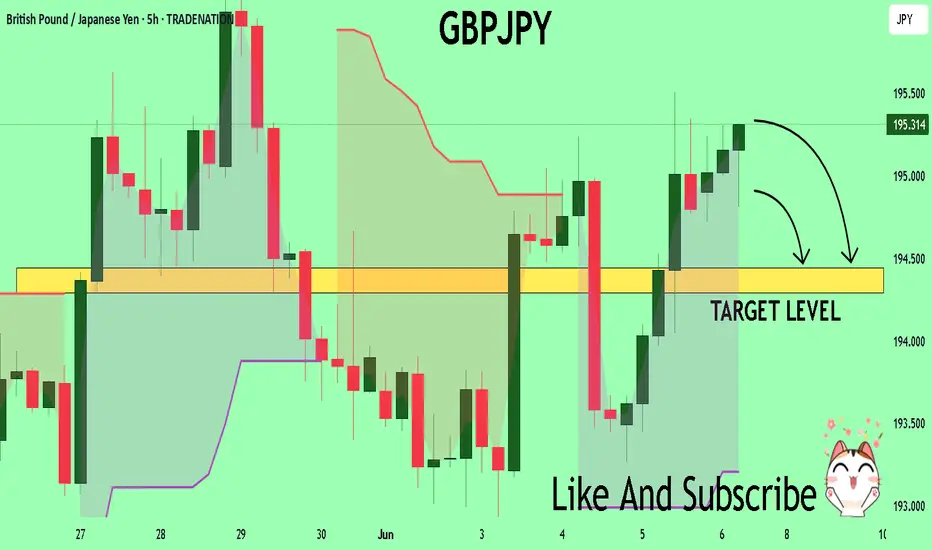
GBPJPY Under Pressure! SELL!
My dear friends,
Please, find my technical outlook for GBPJPY below:
The price is coiling around a solid key level - 195.26
Bias - Bearish
Technical Indicators: Pivot Points High anticipates a potential price reversal.
Super trend shows a clear sell, giving a perfect indicators' convergence.
Goal - 194.44
About Used Indicators:
The pivot point itself is simply the average of the high, low and closing prices from the previous trading day.
Disclosure: I am part of Trade Nation's Influencer program and receive a monthly fee for using their TradingView charts in my analysis.
———————————
WISH YOU ALL LUCK
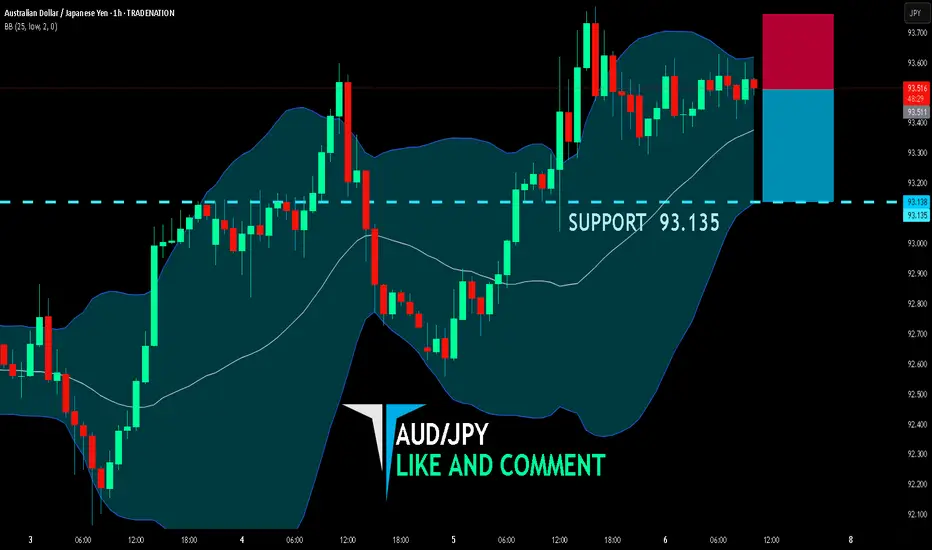
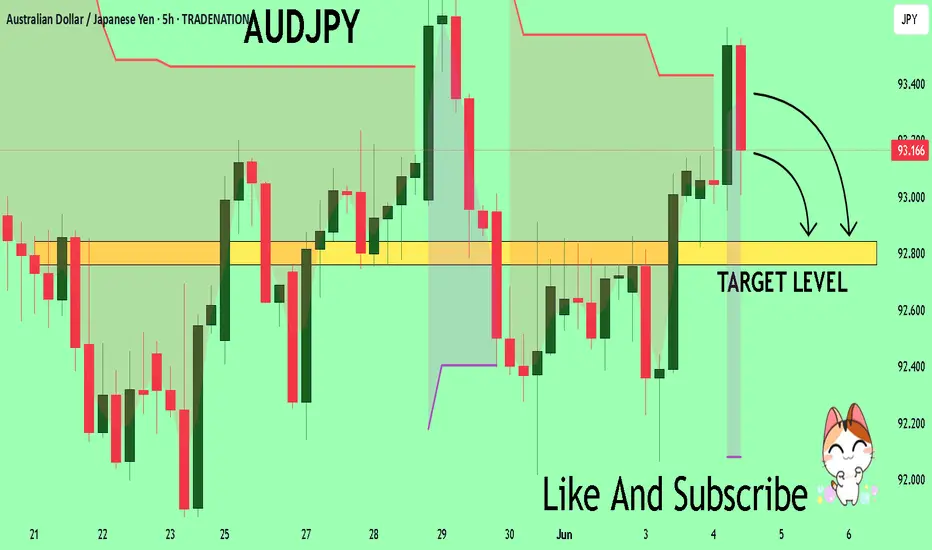
AUD/JPY SELLERS WILL DOMINATE THE MARKET|SHORT
AUD/JPY SIGNAL
Trade Direction: short
Entry Level: 93.511
Target Level: 93.135
Stop Loss: 93.760
RISK PROFILE
Risk level: medium
Suggested risk: 1%
Timeframe: 1h
Disclosure: I am part of Trade Nation's Influencer program and receive a monthly fee for using their TradingView charts in my analysis.
✅LIKE AND COMMENT MY IDEAS✅
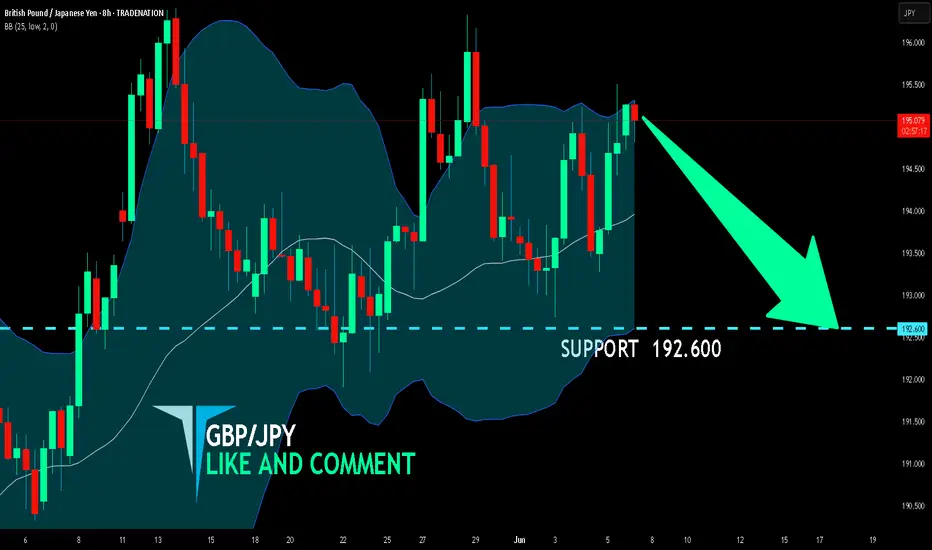
GBP/JPY BEST PLACE TO SELL FROM|SHORT
Hello, Friends!
We are going short on the GBP/JPY with the target of 192.600 level, because the pair is overbought and will soon hit the resistance line above. We deduced the overbought condition from the price being near to the upper BB band. However, we should use low risk here because the 1W TF is green and gives us a counter-signal.
Disclosure: I am part of Trade Nation's Influencer program and receive a monthly fee for using their TradingView charts in my analysis.
✅LIKE AND COMMENT MY IDEAS✅
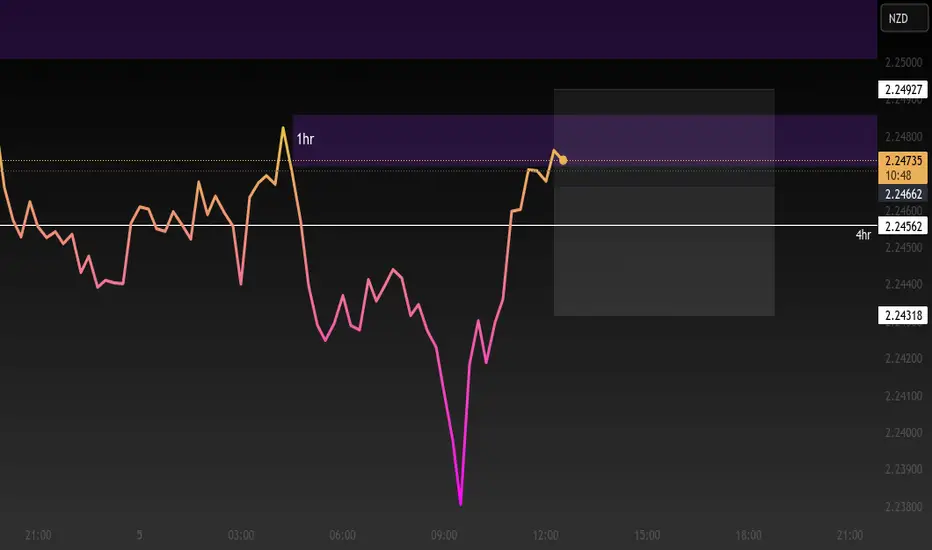
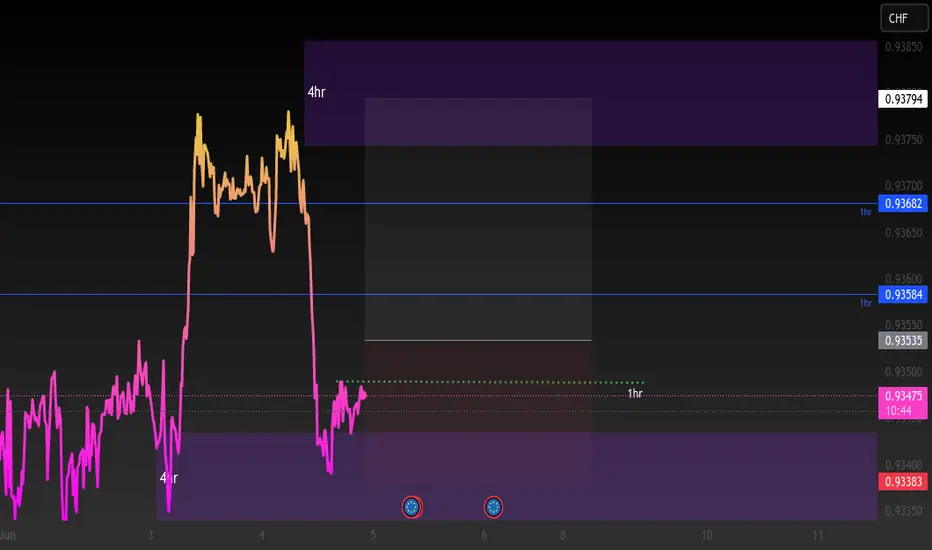
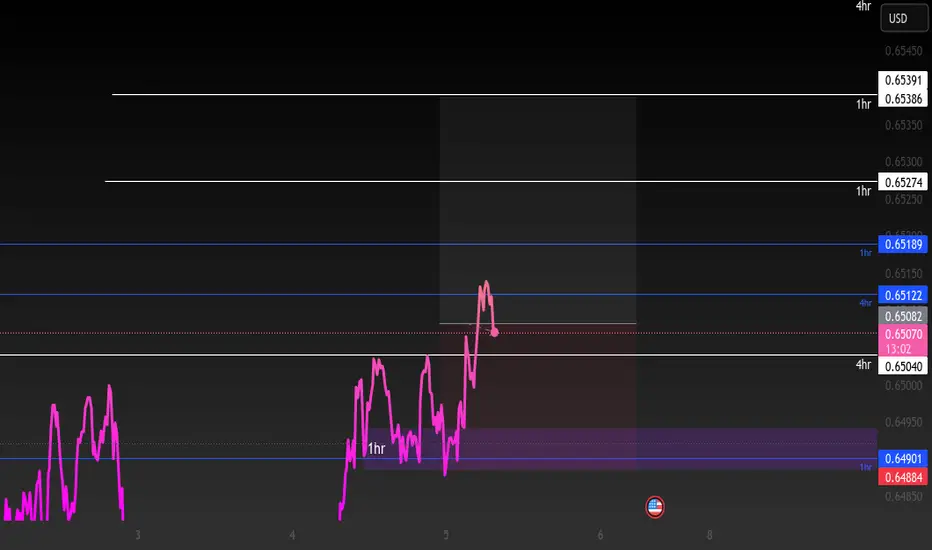
gbpnzd sellprice is in a 1hr supply at the moment and trend is bearish on 1hr 4hr tf. price is visiting the 1hr zone for the first time on 15m tf. it will form a double top if it closes fueling sell momentum. since its been in a steady uptrend it may look to retrace if it wants to go up. im looking to enter once price trade below the leg of the swing entering the 1hr zone.
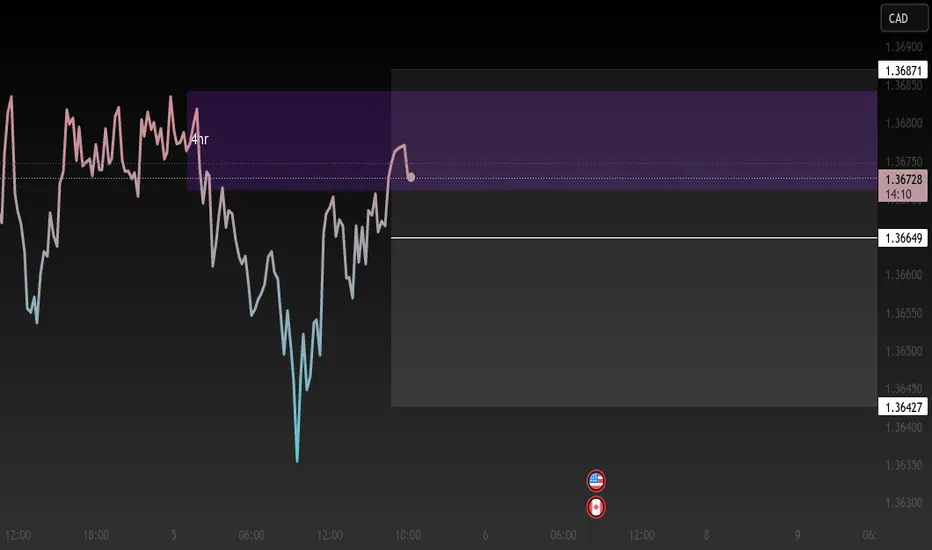
Usdcad Sellprice is bearish still on the 4hr tf and is in a 4hr supply zone. there are supplies across the lower tfs within the 4hr zone. there is a particular one on the 15m tf that is strong. looking to sell once price trades below last ll.
USDCAD Potential DownsidesHey traders, in today's trading session we are monitoring USDCAD for a selling opportunity around 1.37500 zone, USDCAD is trading in a downtrend and currently is in a correction phase in which it is approaching the trend at 1.37500 support and resistance area.
Trade safe, Joe.

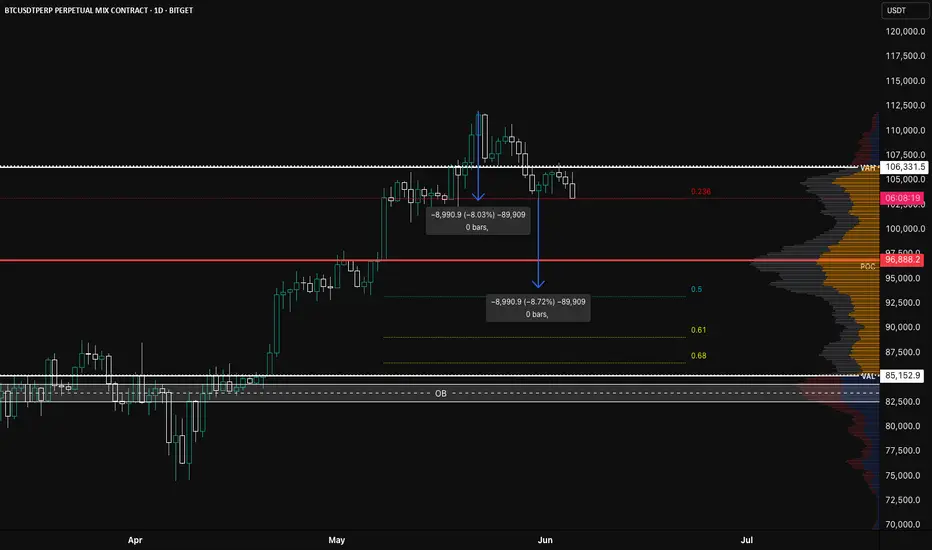
BTC/USDT.P Rejection Confirmed? Eyeing Breakdown Toward 50% FibBitcoin just lost two critical levels in rapid succession:
1️⃣ Value Area High ($106,331)
2️⃣ Previous Monthly High ($105,000)
We’re now closing candles back inside prior structure, showing signs of weakness and potential distribution at the highs.
📉 The Bearish Setup
Price is hovering above the 0.236 retracement. A break and daily close below this level could complete what looks to be the right shoulder of a developing head and shoulders pattern. The distance from head to neckline lines up with a projected move down toward the 50% Fibonacci level ($91,500) — which also aligns closely with the POC ($96,888) as an intermediate stop.
🎯 Targets:
• Neckline/Break Level: $102,800
• Mid-Target (POC): $96,888
• Main Target (0.5 Fib): $91,500
• Confluence zone lower: 0.618 to 0.68 (watch for reversals)
🧠 Context Notes:
• The current 2-leg rejection (~8% each) gives symmetry to the pattern
• High volume nodes around POC could act as reaction areas
• This short setup remains valid while price is closing below ~105k and failing to reclaim VAH
If this structure plays out, it’s a classic example of a failed breakout turning into a strong breakdown — the kind of move that catches late bulls off guard.
Eurchf BuyEurchf is in a bullish trend on the 4hr tf and is currently trading around a 4 hr demand that was made some days ago. once price closes above the green line which is a supply on the 1hr its should suggest buyers are still interested. if so there is a 5m supply that i need price to break which is my entry point targeting 4hr supply above
EURO - Price can drop to $1.1280, breaking support levelHi guys, this is my overview for EURO, feel free to check it and write your feedback in comments👊
A few days ago price broke $1.1375 level and then entered to triangle pattern, where it at once dropped from resistance line.
Price fell to $1.1375 level, where it some time traded between and then continued to decline to $1.1220 level.
When Euro declined to this level, it at once broke this level and fell to support line of a triangle pattern.
Next, price turned around and in a short time rose higher than $1.1220 level, breaking it and continued to grow next.
Euro rose to resistance line and then corrected, after which it made an upward impulse, thereby exiting from triangle.
Now, price traded inside resistance area, near $1.1375 level, and I think EUR can drop to $1.1280
If this post is useful to you, you can support me with like/boost and advice in comments❤️
Disclaimer: As part of ThinkMarkets’ Influencer Program, I am sponsored to share and publish their charts in my analysis.
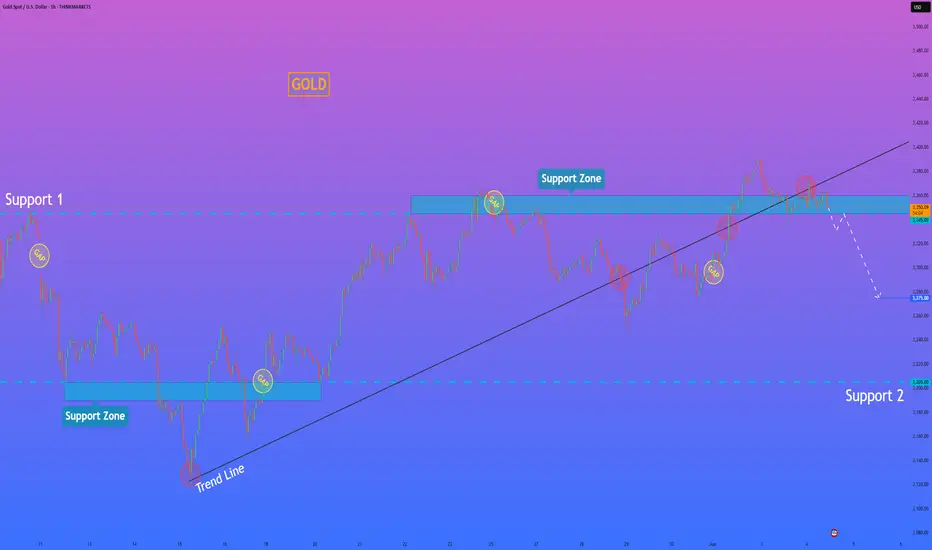
HelenP. I Gold will break support level and fall to $3275 pointsHi folks today I'm prepared for you Gold analytics. In this chart, we can see how the price reached support 1 and then at once dropped to support 2, which coincided with the support zone, making a first gap. Then the price tried to grow, but failed and continued to decline, breaking support 2 and later reaching the trend line. After this movement, Gold turned around and made an impulse up, breaking support 2 and making a first-second gap. Next, Gold made a correction movement to support 2 and then made an impulse up to support 1, which coincided with the support zone. After this, Gold made a small correction and then rose to the support zone, where it made a third gap. Next, XAU in a short time declined to the trend line, broke it, but then started to grow above this line. Some time later, Gold rose to support 1, making a fourth gap, and recently broke support 1 with a trend line. At the moment, the price is traded inside the support zone, and I think that XAUUSD will break the support level, make a retest, and continue to decline. For this case, I set my goal at 3275 points. If you like my analytics you may support me with your like/comment ❤️
Disclaimer: As part of ThinkMarkets’ Influencer Program, I am sponsored to share and publish their charts in my analysis.
Audusd Longprice is in bullish trend on the 4hr timeframe. price was consolidating around a 1hr poi and demand zone/ it recently broke through a 4hr key level and reached a 4hr poi. im expecting a minor pullback before continuing to the upside
AUDJPY Trading Opportunity! SELL!
My dear friends,
Please, find my technical outlook for AUDJPY below:
The instrument tests an important psychological level 93.263
Bias - Bearish
Technical Indicators: Supper Trend gives a precise Bearish signal, while Pivot Point HL predicts price changes and potential reversals in the market.
Target - 92.841
About Used Indicators:
Super-trend indicator is more useful in trending markets where there are clear uptrends and downtrends in price.
Disclosure: I am part of Trade Nation's Influencer program and receive a monthly fee for using their TradingView charts in my analysis.
———————————
WISH YOU ALL LUCK
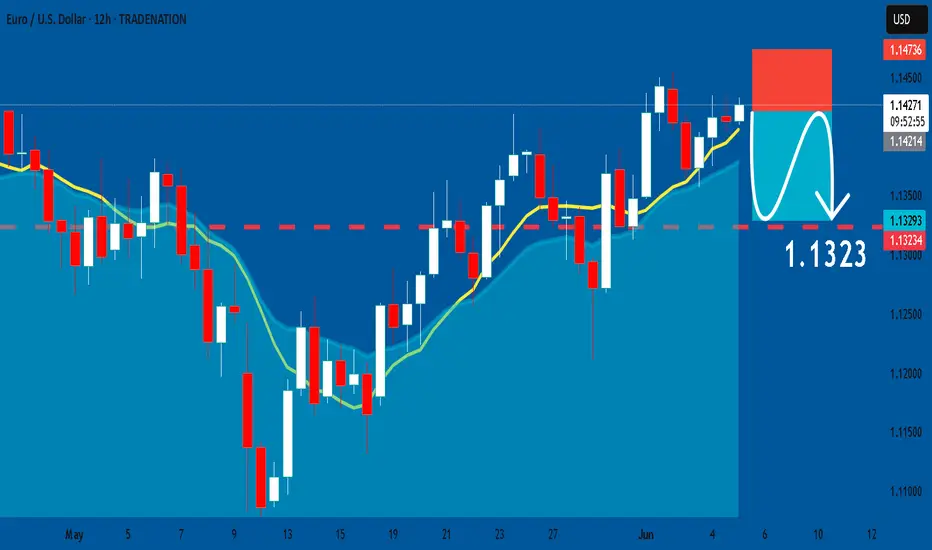
EURUSD: Bearish Continuation & Short Signal
EURUSD
- Classic bearish formation
- Our team expects pullback
SUGGESTED TRADE:
Swing Trade
Short EURUSD
Entry - 1.1423
Sl - 1.1473
Tp - 1.1323
Our Risk - 1%
Start protection of your profits from lower levels
Disclosure: I am part of Trade Nation's Influencer program and receive a monthly fee for using their TradingView charts in my analysis.
❤️ Please, support our work with like & comment! ❤️