BTC Educational Idea by 1PercentFundedBTC Update : These are the possible scenarios for BTC based on 2021
Scenario A. BTC rejects 108/109k (Purple Arrow) & retest 98k (High Probability)
Scenario B. BTC retest 110/111k (Black Arrow) & creates a double top before dumping to 88/98k
Our team will be building shorts at 108k onwards & will add if 111k is given. 117.5k invalidation.
Short

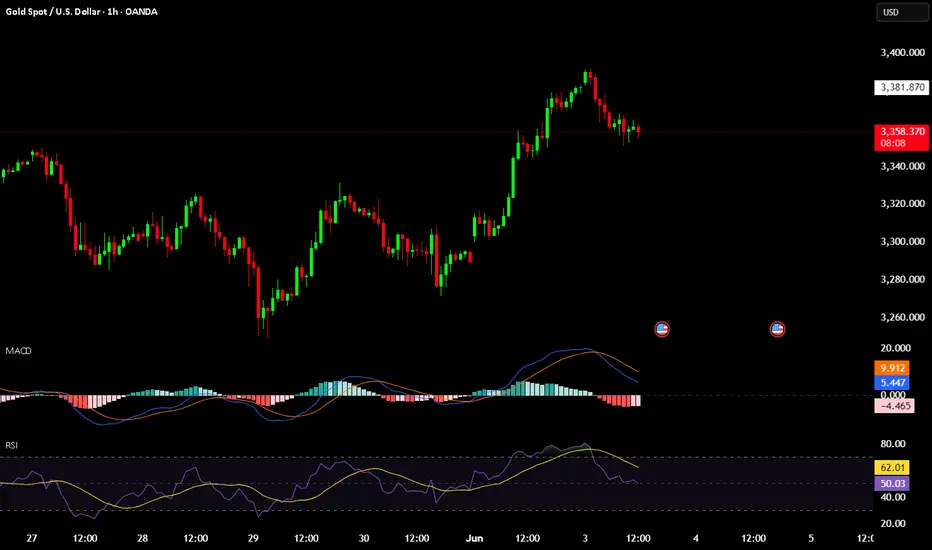
GOLD 1H TRADE IDEA - JUNE 3, 2025🔴 GOLD 1H TRADE IDEA – June 3, 2025
📉 Bias: Short (Bearish Rejection from Supply / Trend Exhaustion)
🔽 SELL SETUP
Entry:
🔹 $3,360 (after clean rejection from local high / liquidity grab near $3,381)
Stop-Loss (SL):
🔺 $3,385 (above the recent swing high and trap wick)
Take-Profit 1 (TP1):
✅ $3,330 (last minor structure + psychological level)
Take-Profit 2 (TP2):
✅ $3,305 (key support / demand zone before breakout)
📊 Technical Confluence
MACD: Bearish crossover confirmed; histogram red and growing — momentum shift to the downside
RSI: Rejection from 62+ level, bearish divergence forming — now pointing down at ~51
Price Action:
Wick rejection at ~$3,381
Lower high formed on the 1H chart
Shift from bullish to neutral/bearish candles
Structure: Broke minor uptrend line, now hovering under key rejection zone
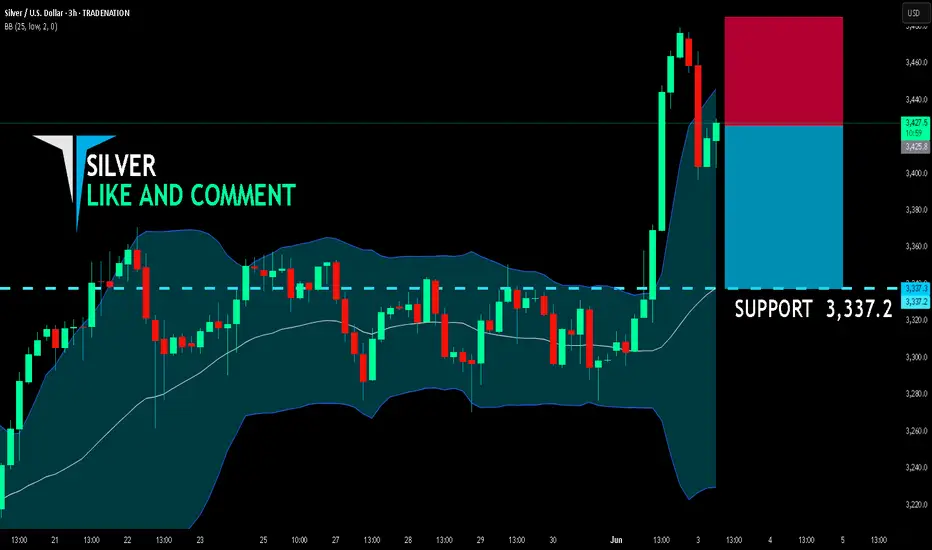
SILVER BEARS ARE STRONG HERE|SHORT
SILVER SIGNAL
Trade Direction: short
Entry Level: 3,425.8
Target Level: 3,337.2
Stop Loss: 3,484.9
RISK PROFILE
Risk level: medium
Suggested risk: 1%
Timeframe: 3h
Disclosure: I am part of Trade Nation's Influencer program and receive a monthly fee for using their TradingView charts in my analysis.
✅LIKE AND COMMENT MY IDEAS✅
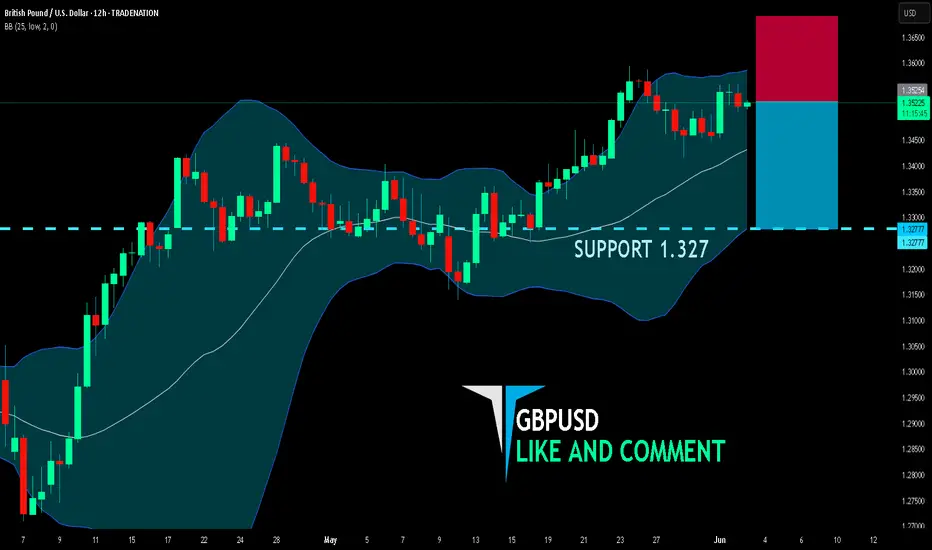
GBP/USD SHORT FROM RESISTANCE
GBP/USD SIGNAL
Trade Direction: short
Entry Level: 1.352
Target Level: 1.327
Stop Loss: 1.369
RISK PROFILE
Risk level: medium
Suggested risk: 1%
Timeframe: 12h
Disclosure: I am part of Trade Nation's Influencer program and receive a monthly fee for using their TradingView charts in my analysis.
✅LIKE AND COMMENT MY IDEAS✅
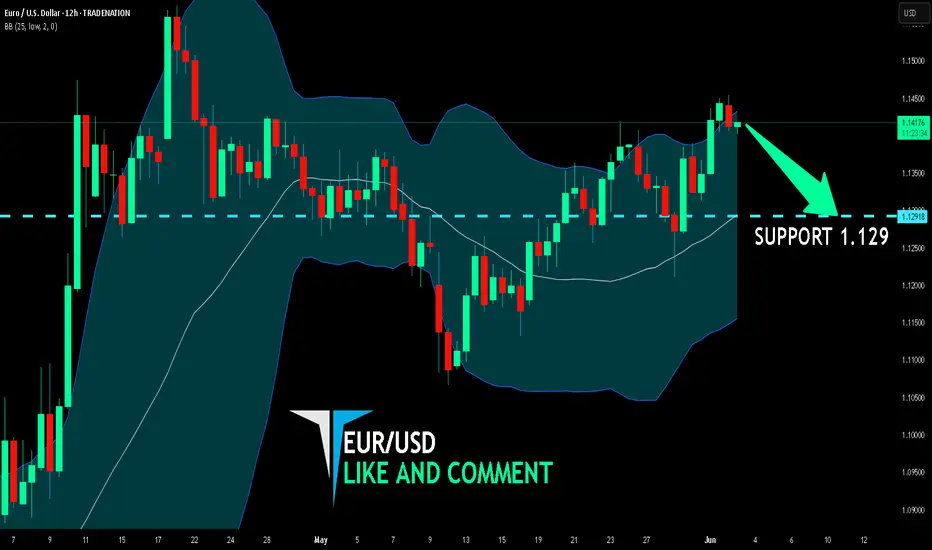
EUR/USD BEARS WILL DOMINATE THE MARKET|SHORT
Hello, Friends!
EUR/USD pair is in the downtrend because previous week’s candle is red, while the price is obviously rising on the 12H timeframe. And after the retest of the resistance line above I believe we will see a move down towards the target below at 1.129 because the pair is overbought due to its proximity to the upper BB band and a bearish correction is likely.
Disclosure: I am part of Trade Nation's Influencer program and receive a monthly fee for using their TradingView charts in my analysis.
✅LIKE AND COMMENT MY IDEAS✅
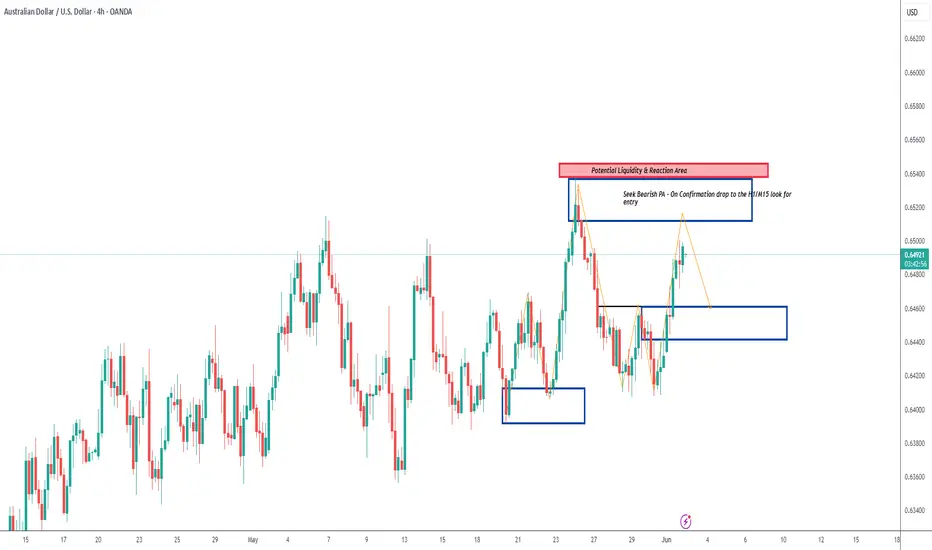
AUDUSD Asia SessionWe could see bullish momentum during the Asian session pushing price into the upper supply zone around 0.65200. From there, we’ll be monitoring for bearish price action (PA) to potentially confirm a short setup.
If confirmation aligns, the short idea targets the demand zone between 0.64600–0.64500.
This is a forecast — not a signal. Trade execution will depend on what price does upon reaching the supply. We’ll drop to the H1 or M15 to refine entries if bearish confirmations present themselves.
Higher Timeframe Context: clearly marked HTF supply. Price has made a corrective leg up into this zone.
Liquidity & Reaction Area: There's likely resting liquidity above the most recent highs before the 0.65200 zone — perfect for a sweep.
Entry Plan: Smart to wait for CHoCH or BOS on LTF once we enter the supply zone. Avoid rushing — let the zone prove itself.
Target Area: The 0.64600–0.64500 zone aligns with previous structure and a minor FVG — solid short-term TP.
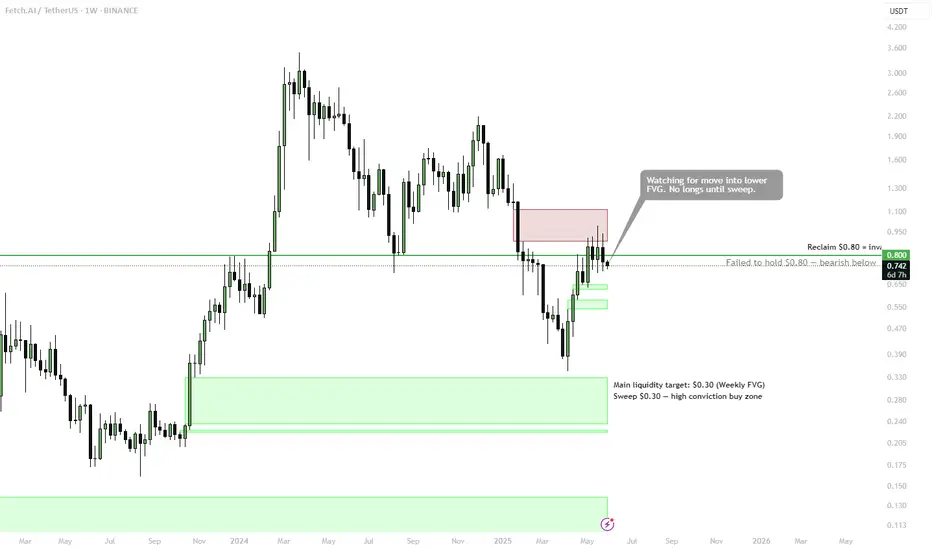
FET | — No Longs Until LowerNYSE:FET is showing weakness after failing to reclaim the $0.80 level, which now acts as invalidation for any bullish setups. Price continues to grind below a key FVG resistance, with no clear breakout.
Plan:
🔻 No Long Setup While Below $0.80
• Bearish bias as long as price remains below reclaimed resistance
• Watching for potential move into lower FVG zones
• No interest in longs unless we see a sweep of key liquidity
🟩 Main Buy Zone: $0.30 (Weekly FVG)
• High-conviction area for long positioning if reached
• Deep liquidity pocket with HTF demand — ideal for spot entries
🎯 Reclaim of $0.80 = Invalidation of Bearish Bias
• Clean weekly close above flips structure bullish again
📌 Let the market flush first. No reason to catch a knife — play from strength, not hope.
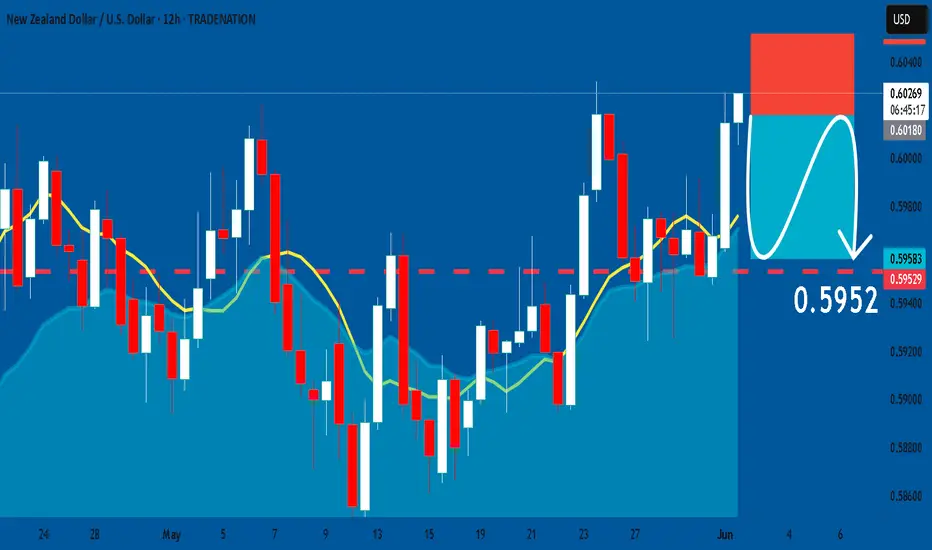
NZDUSD: Bearish Continuation & Short Trade
NZDUSD
- Classic bearish setup
- Our team expects bearish continuation
SUGGESTED TRADE:
Swing Trade
Short NZDUSD
Entry Point - 0.6018
Stop Loss - 0.6051
Take Profit - 0.5952
Our Risk - 1%
Start protection of your profits from lower levels
Disclosure: I am part of Trade Nation's Influencer program and receive a monthly fee for using their TradingView charts in my analysis.
❤️ Please, support our work with like & comment! ❤️
AUDUSD The Target Is DOWN! SELL!
My dear friends,
My technical analysis for AUDUSD is below:
The market is trading on 0.6477 pivot level.
Bias - Bearish
Technical Indicators: Both Super Trend & Pivot HL indicate a highly probable Bearish continuation.
Target - 0.6446
Recommended Stop Loss - 0.6495
About Used Indicators:
A pivot point is a technical analysis indicator, or calculations, used to determine the overall trend of the market over different time frames.
Disclosure: I am part of Trade Nation's Influencer program and receive a monthly fee for using their TradingView charts in my analysis.
———————————
WISH YOU ALL LUCK
AUDCAD: Will Start Falling! Here is Why:
Our strategy, polished by years of trial and error has helped us identify what seems to be a great trading opportunity and we are here to share it with you as the time is ripe for us to sell AUDCAD.
Disclosure: I am part of Trade Nation's Influencer program and receive a monthly fee for using their TradingView charts in my analysis.
❤️ Please, support our work with like & comment! ❤️

GOLD: Short Signal with Entry/SL/TP
GOLD
- Classic bearish formation
- Our team expects fall
SUGGESTED TRADE:
Swing Trade
Sell GOLD
Entry Level - 3369.0
Sl - 3381.1
Tp - 3345.8
Our Risk - 1%
Start protection of your profits from lower levels
Disclosure: I am part of Trade Nation's Influencer program and receive a monthly fee for using their TradingView charts in my analysis.
❤️ Please, support our work with like & comment! ❤️

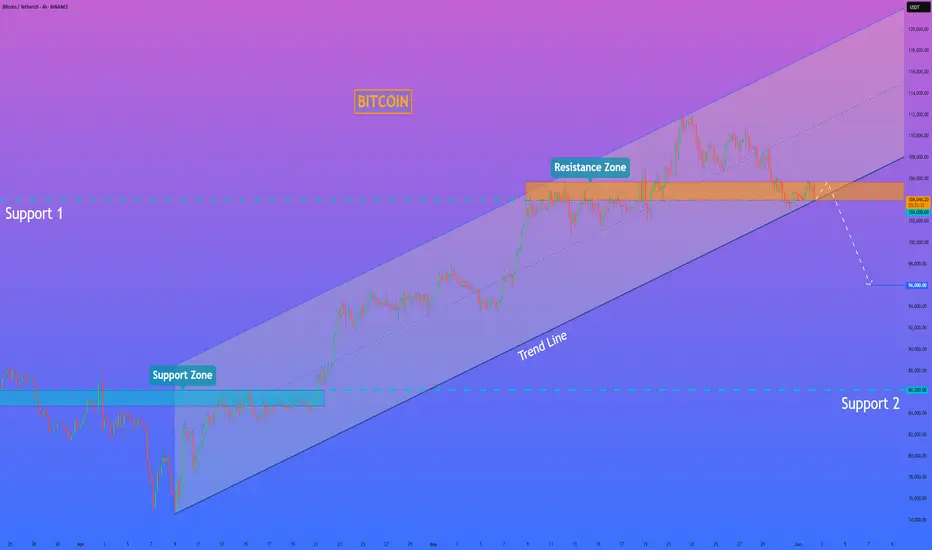
HelenP. I Bitcoin can exit break trend line and continue to fallHi folks today I'm prepared for you Bitcoin analytics. After looking at the chart, we can see how the price declined and broke support 2, which coincided with the support zone. Then the price rose to the support zone but turned around and dropped to the trend line. After this movement, BTC started to grow inside an upward channel, where it soon rose to support 2, which soon broke it and continued to move up. In the channel, price rose to support 1 and some time traded near this level. Later, BTC broke it and rose to the resistance line of the channel and turned around, and dropped to support 1. And at the moment, it traded inside the resistance zone, which coincided with the support level. So, I expect that BTCUSDT will break the support level, which coincides with the trend line, and continue to decline, thereby exiting from upward channel. That's why I set my goal at 96000 points. If you like my analytics you may support me with your like/comment ❤️
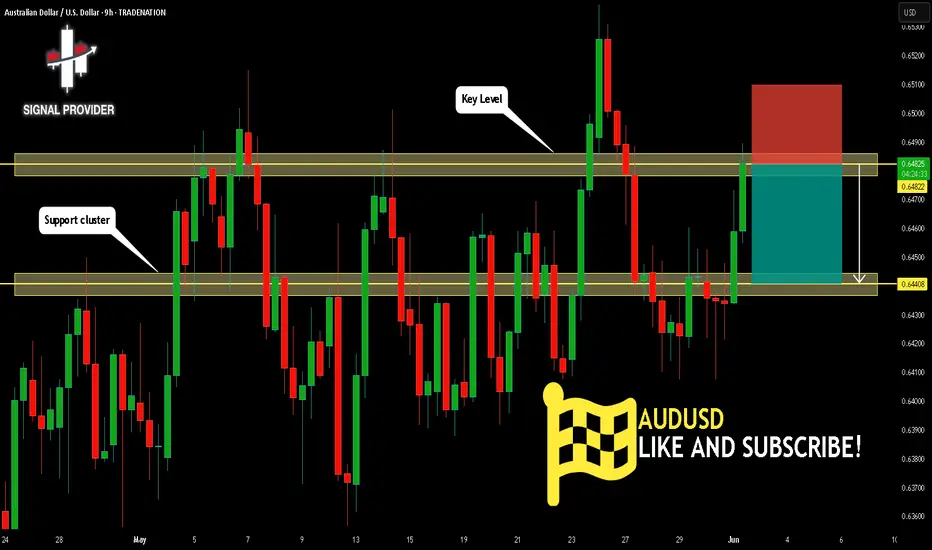
AUDUSD Will Move Lower! Sell!
Please, check our technical outlook for AUDUSD.
Time Frame: 9h
Current Trend: Bearish
Sentiment: Overbought (based on 7-period RSI)
Forecast: Bearish
The market is approaching a key horizontal level 0.648.
Considering the today's price action, probabilities will be high to see a movement to 0.644.
P.S
Overbought describes a period of time where there has been a significant and consistent upward move in price over a period of time without much pullback.
Disclosure: I am part of Trade Nation's Influencer program and receive a monthly fee for using their TradingView charts in my analysis.
Like and subscribe and comment my ideas if you enjoy them!
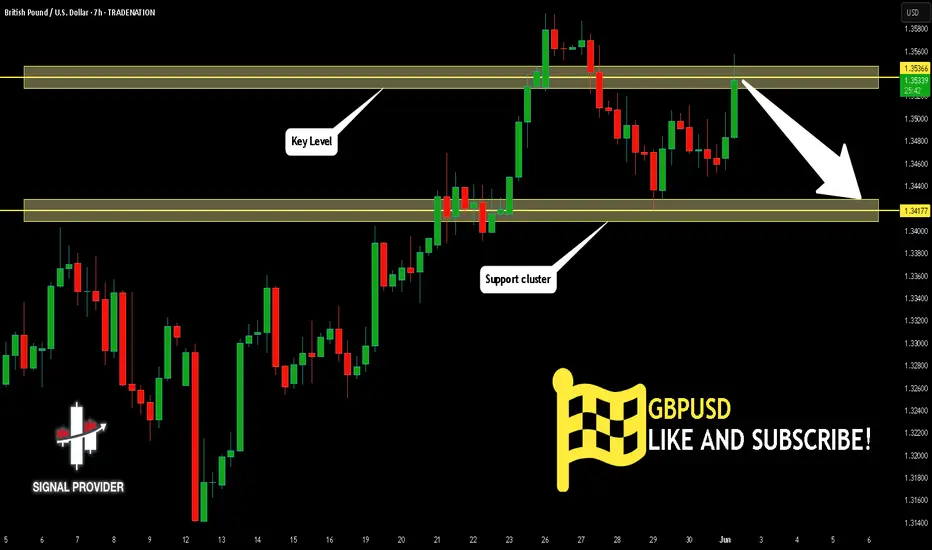
GBPUSD Is Bearish! Short!
Here is our detailed technical review for GBPUSD.
Time Frame: 7h
Current Trend: Bearish
Sentiment: Overbought (based on 7-period RSI)
Forecast: Bearish
The market is approaching a significant resistance area 1.353.
Due to the fact that we see a positive bearish reaction from the underlined area, I strongly believe that sellers will manage to push the price all the way down to 1.341 level.
P.S
Overbought describes a period of time where there has been a significant and consistent upward move in price over a period of time without much pullback.
Disclosure: I am part of Trade Nation's Influencer program and receive a monthly fee for using their TradingView charts in my analysis.
Like and subscribe and comment my ideas if you enjoy them!
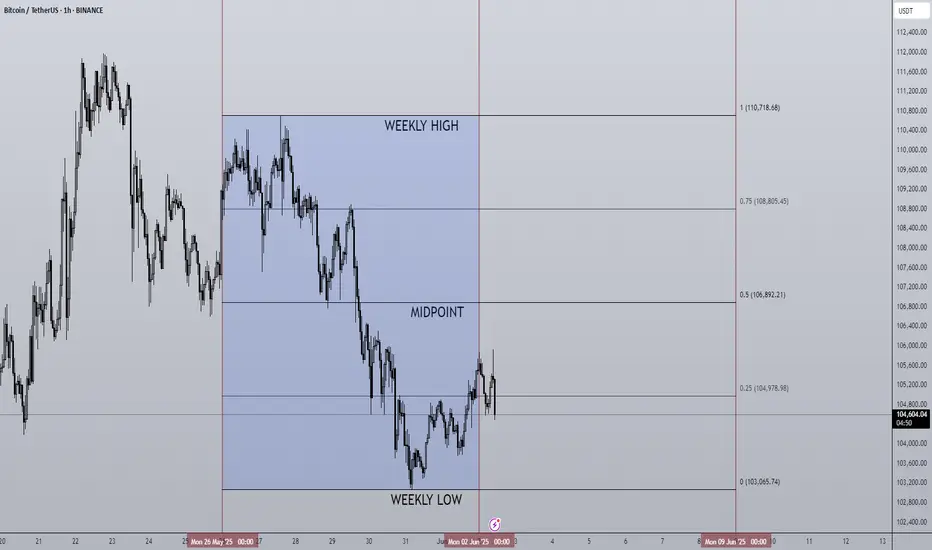
02/06/25 Weekly OutlookLast weeks high: $110,718.68
Last weeks low: $103,065.74
Midpoint: $106,892.21
As we approach the middle of the year, Bitcoin is back above $100,000 despite pulling back from a new ATH of $112,000. In the month of MAY BlackRocks ETF had record inflows of over $6B propelling prices 11% higher.
Last week we saw as the month closed and with that it's natural to have a window dressing period that usually leads to de-risking slightly. BTC stayed within the previous weeks range and maintains the pattern of:
Chop/consolidation --> expansion to the upside --> chop/consolidation...
However in this case the consolidation week had a much larger range than in the past which is a sign to me that the rally is exhausted for now. It's because of this I feel we may see a weekly low break for the first time in a month and get a more meaningful pullback than we've seen since early April. My target would be around the $97,000 area.
The case for the bulls is still a convincing one despite some red flags. Record ETF inflows continue to pour, M2 money supply continues to grow and a general shift to risk-on assets is clear. However these are longer term factors and just for this weeks outlook the momentum is with the bears briefly.
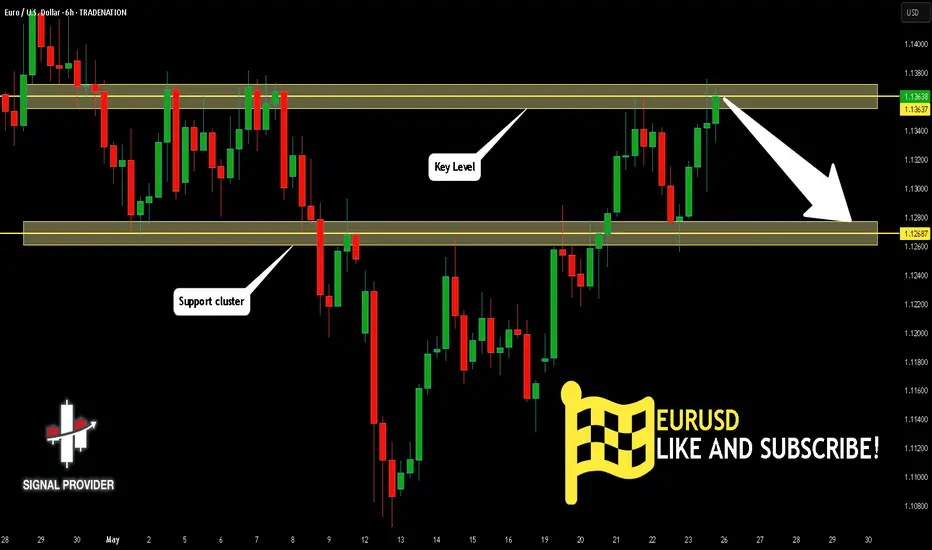
EURUSD Will Go Down From Resistance! Short!
Here is our detailed technical review for EURUSD.
Time Frame: 6h
Current Trend: Bearish
Sentiment: Overbought (based on 7-period RSI)
Forecast: Bearish
The market is trading around a solid horizontal structure 1.136.
The above observations make me that the market will inevitably achieve 1.126 level.
P.S
The term oversold refers to a condition where an asset has traded lower in price and has the potential for a price bounce.
Overbought refers to market scenarios where the instrument is traded considerably higher than its fair value. Overvaluation is caused by market sentiments when there is positive news.
Disclosure: I am part of Trade Nation's Influencer program and receive a monthly fee for using their TradingView charts in my analysis.
Like and subscribe and comment my ideas if you enjoy them!
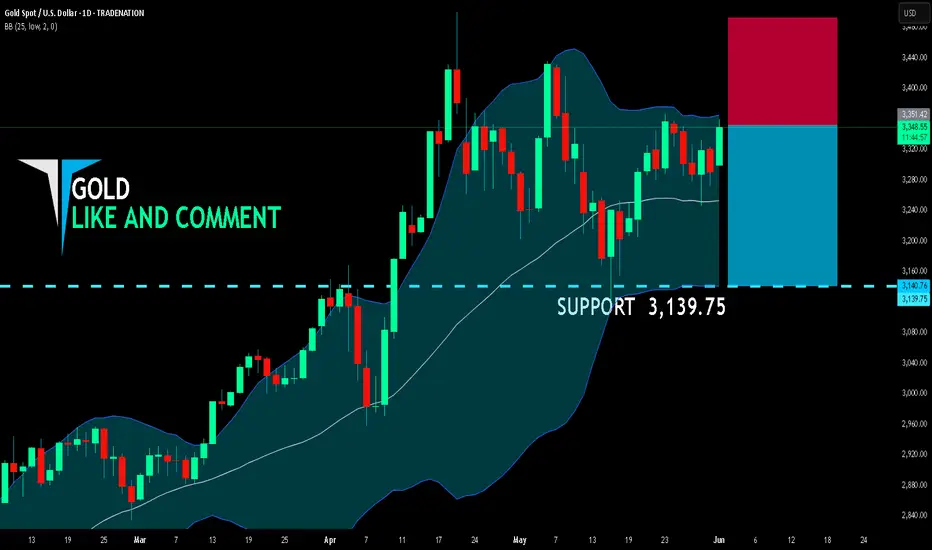
GOLD BEARS ARE GAINING STRENGTH|SHORT
GOLD SIGNAL
Trade Direction: short
Entry Level: 3,351.42
Target Level: 3,139.75
Stop Loss: 3,492.20
RISK PROFILE
Risk level: medium
Suggested risk: 1%
Timeframe: 1D
Disclosure: I am part of Trade Nation's Influencer program and receive a monthly fee for using their TradingView charts in my analysis.
✅LIKE AND COMMENT MY IDEAS✅
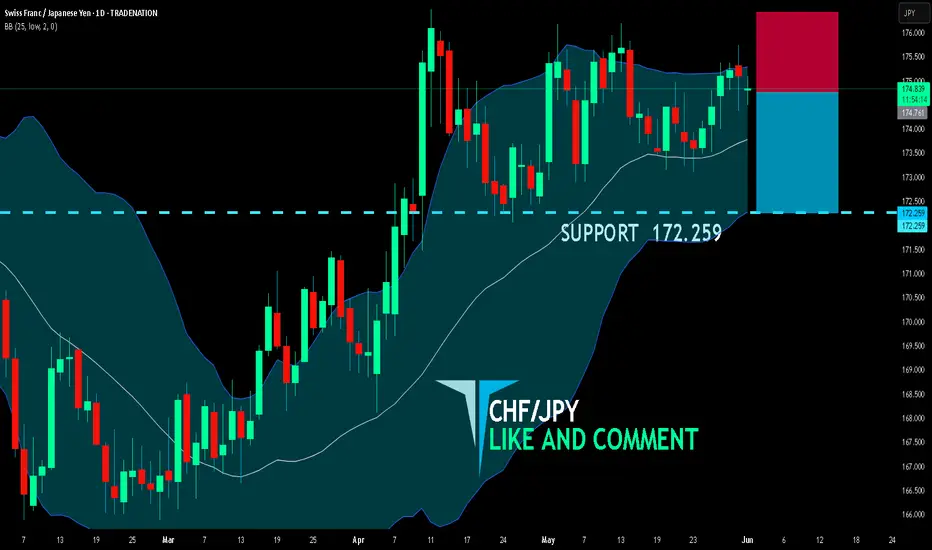
CHF/JPY SELLERS WILL DOMINATE THE MARKET|SHORT
CHF/JPY SIGNAL
Trade Direction: short
Entry Level: 174.761
Target Level: 172.259
Stop Loss: 176.429
RISK PROFILE
Risk level: medium
Suggested risk: 1%
Timeframe: 1D
Disclosure: I am part of Trade Nation's Influencer program and receive a monthly fee for using their TradingView charts in my analysis.
✅LIKE AND COMMENT MY IDEAS✅
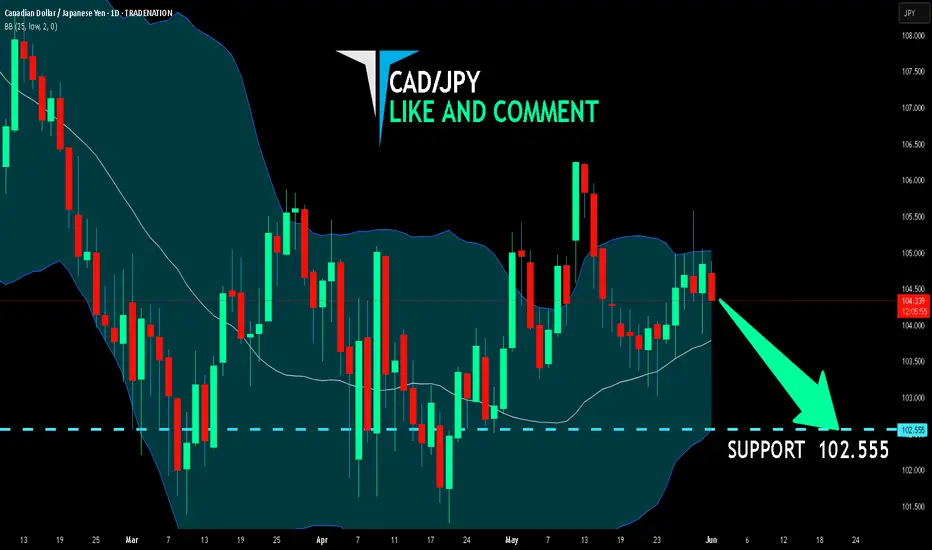
CAD/JPY BEARISH BIAS RIGHT NOW| SHORT
Hello, Friends!
We are going short on the CAD/JPY with the target of 102.555 level, because the pair is overbought and will soon hit the resistance line above. We deduced the overbought condition from the price being near to the upper BB band. However, we should use low risk here because the 1W TF is green and gives us a counter-signal.
Disclosure: I am part of Trade Nation's Influencer program and receive a monthly fee for using their TradingView charts in my analysis.
✅LIKE AND COMMENT MY IDEAS✅
USD/CHF BEARS ARE GAINING STRENGTH|SHORT
Hello, Friends!
We are now examining the USD/CHF pair and we can see that the pair is going up locally while also being in a uptrend on the 1W TF. But there is also a powerful signal from the BB upper band being nearby, indicating that the pair is overbought so we can go short from the resistance line above and a target at 0.817 level.
Disclosure: I am part of Trade Nation's Influencer program and receive a monthly fee for using their TradingView charts in my analysis.
✅LIKE AND COMMENT MY IDEAS✅

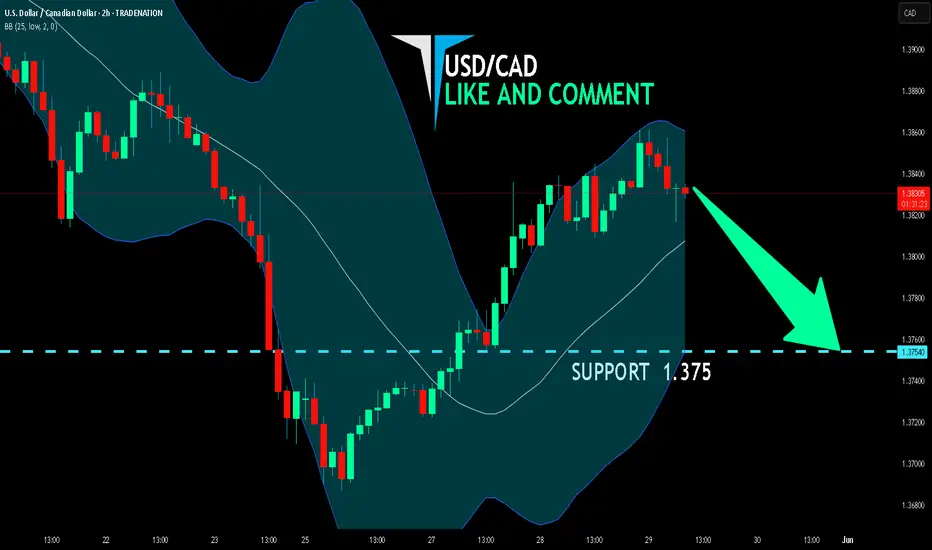
USD/CAD SENDS CLEAR BEARISH SIGNALS|SHORT
Hello, Friends!
We are going short on the USD/CAD with the target of 1.375 level, because the pair is overbought and will soon hit the resistance line above. We deduced the overbought condition from the price being near to the upper BB band. However, we should use low risk here because the 1W TF is green and gives us a counter-signal.
Disclosure: I am part of Trade Nation's Influencer program and receive a monthly fee for using their TradingView charts in my analysis.
✅LIKE AND COMMENT MY IDEAS✅
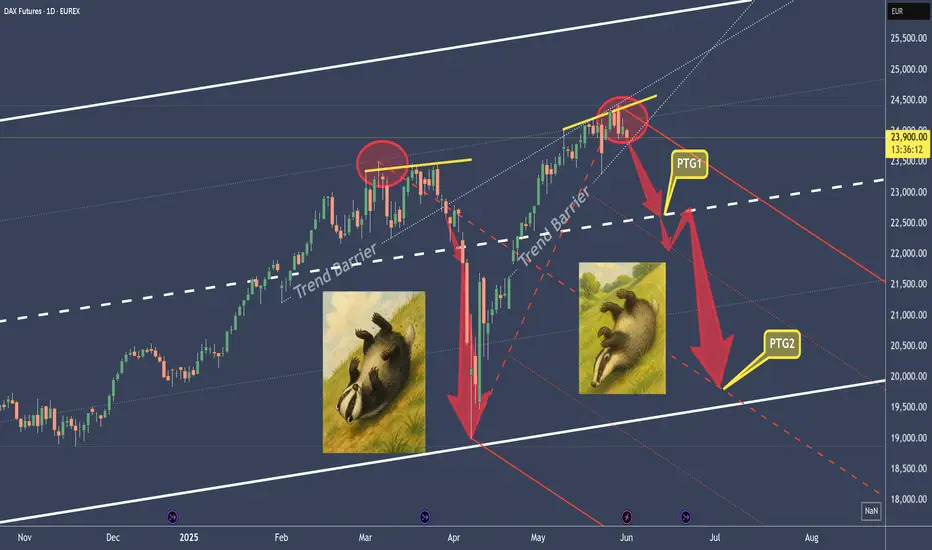
DAX Take 1 Part 2 – Reloaded but not yet good to goThe first time, we saw the DAX poke the 1/4 line.
This was followed by several attempts (distribution by the big players), and from that point on, it headed south and the DAX rolled down the hill.
Currently, it looks very similar.
I’m watching and observing the break of the trend barrier very closely, even on smaller timeframes than the daily.
The profit targets are indicated by the red arrows.
After the break of the thick white centerline, a strong retest of the CL could be in store.
My main target would then be the red centerline.
Since the markets are behaving completely irrationally, I’ll need more “breathing room” in the trade and will handle this trade using long-dated LEAP options.
...poor little guy §8-)
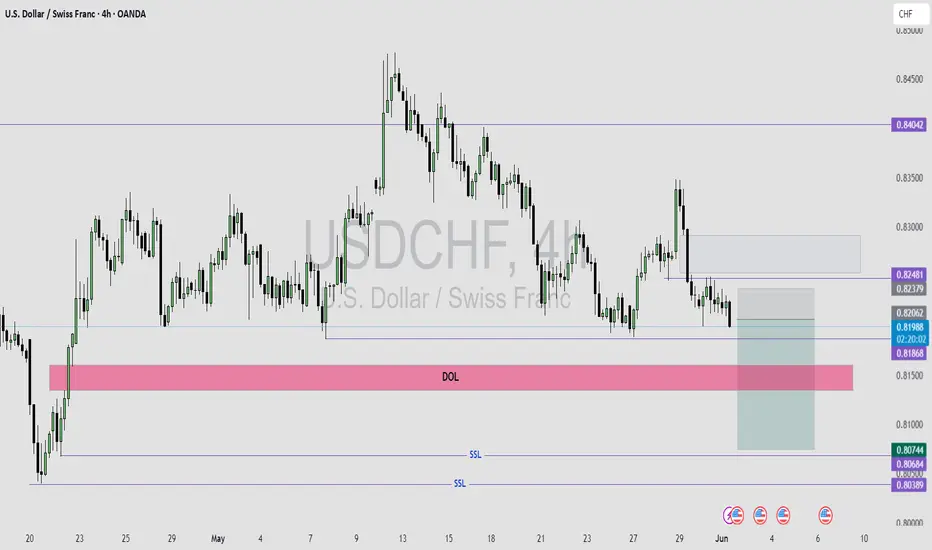
USDCHF SELL IDEAUSDCHF is Ready to continue It's SELL Move to the higher time frame recent swing low of 0.803.
SELL IDEA BREAKDOWN;
Weekly is bearish and price is moving closer to the 0.803 swing low.
Daily is also bearish, price is moving towards the weekly swing low.
4HR had a bearish break in market structure, followed by a retest of the recent swing low that was broken by price to give MSS.
My entry was taken after the formation of a swing low and price is done retesting the old low.
This is a continuation trade.