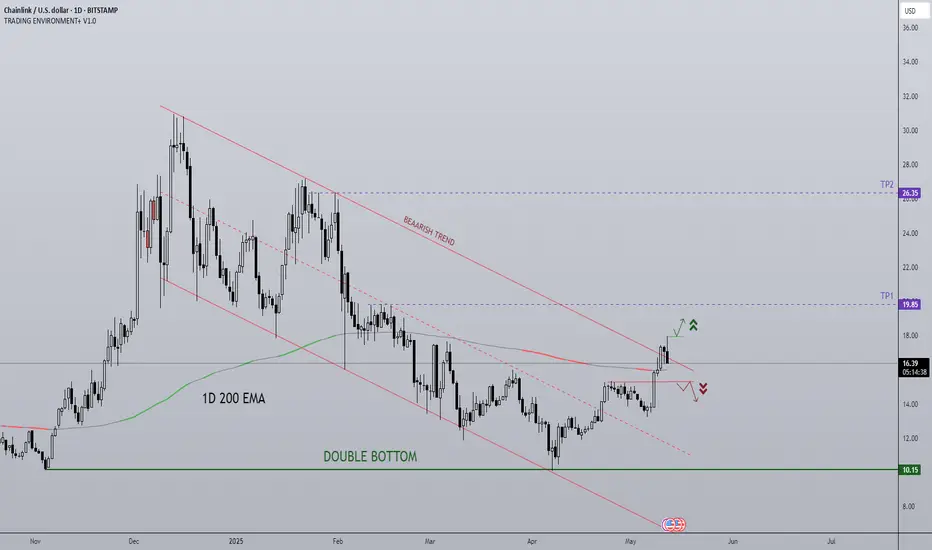
LINK Daily breakout?One of the most important crypto projects is undoubtedly Chainlink. Having been in a downtrend like must altcoins ever since President Trumps inauguration , LINK looks to finally be ready to exit the bearish trend channel for the first time this calendar year using the newly flipped 1D 200 EMA as a launchpad or is this a local top and the trend continues?
For the bulls a double bottom at $10.15 followed by a higher lows and now a higher high is a strong argument for a flip to bullish structure, however a breakout is needed to confirm this bullish flip in structure and with BTC + most majors at local resistance levels and looking in need of a cool off, this may be too much to ask of LINK at this time.
The bears would say this is business as usual and a rejection off the upper limit maintains the bearish trend, a loss of the 1D 200 EMA would definitely increase the likeliness this outcome.
Short
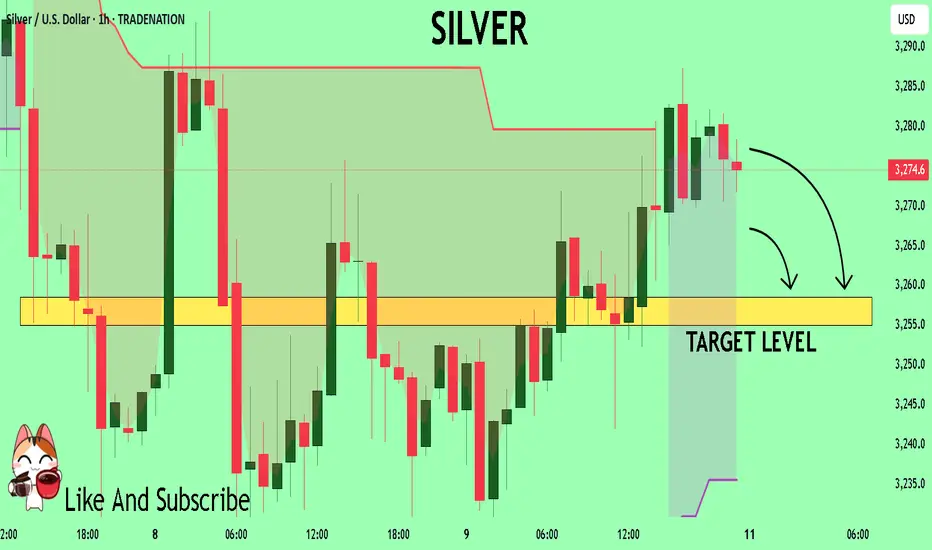
SILVER Massive Short! SELL!
My dear friends,
My technical analysis for SILVER is below:
The market is trading on 32.746 pivot level.
Bias - Bearish
Technical Indicators: Both Super Trend & Pivot HL indicate a highly probable Bearish continuation.
Target -32.586
About Used Indicators:
A pivot point is a technical analysis indicator, or calculations, used to determine the overall trend of the market over different time frames.
Disclosure: I am part of Trade Nation's Influencer program and receive a monthly fee for using their TradingView charts in my analysis.
———————————
WISH YOU ALL LUCK
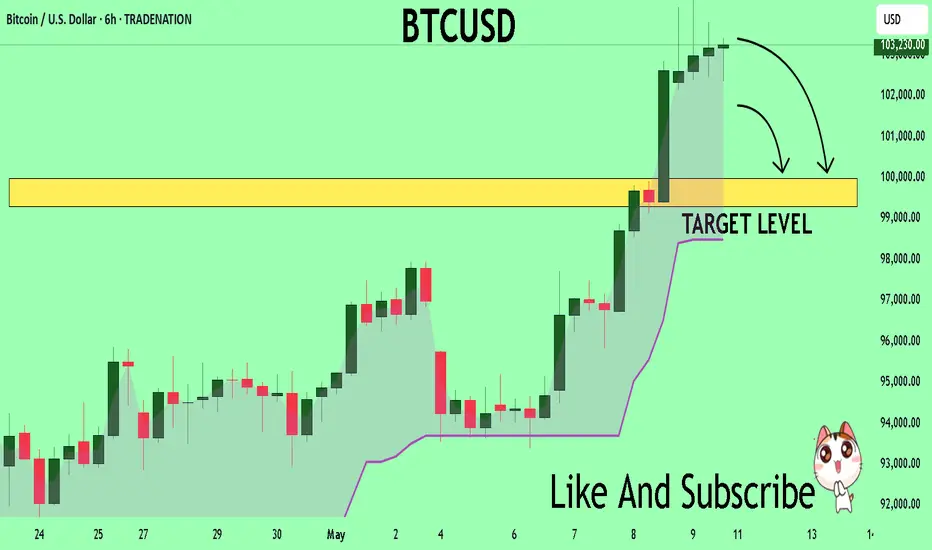
BTCUSD Buyers In Panic! SELL!
My dear friends,
Please, find my technical outlook for BTCUSD below:
The price is coiling around a solid key level - 10323
Bias - Bearish
Technical Indicators: Pivot Points Low anticipates a potential price reversal.
Super trend shows a clear sell, giving a perfect indicators' convergence.
Goal - 99977
About Used Indicators:
The pivot point itself is simply the average of the high, low and closing prices from the previous trading day.
Disclosure: I am part of Trade Nation's Influencer program and receive a monthly fee for using their TradingView charts in my analysis.
———————————
WISH YOU ALL LUCK
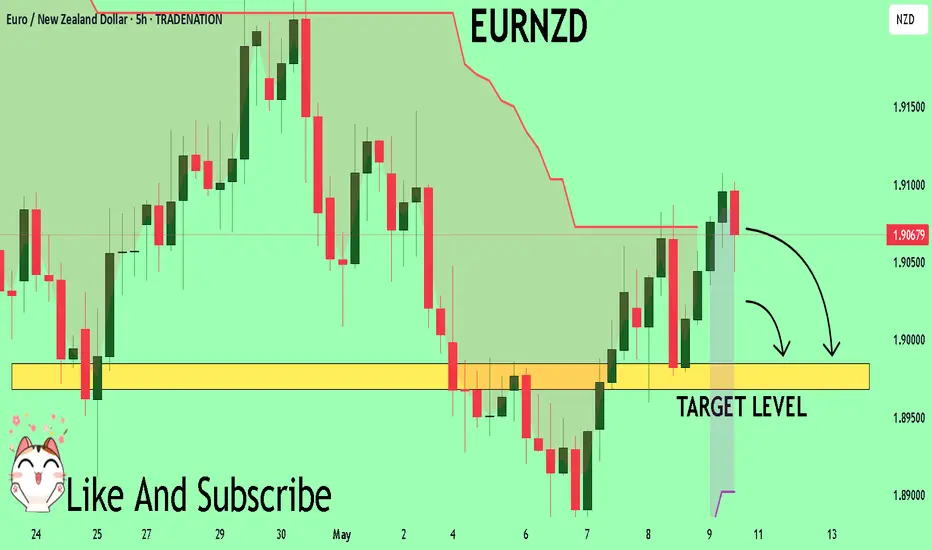
EURNZD Under Pressure! SELL!
My dear subscribers,
EURNZD looks like it will make a good move, and here are the details:
The market is trading on 1.9051 pivot level.
Bias - Bearish
Technical Indicators: Both Super Trend & Pivot HL indicate a highly probable Bearish continuation.
Target - 1.8984
About Used Indicators:
The average true range (ATR) plays an important role in 'Supertrend' as the indicator uses ATR to calculate its value. The ATR indicator signals the degree of price volatility.
Disclosure: I am part of Trade Nation's Influencer program and receive a monthly fee for using their TradingView charts in my analysis.
———————————
WISH YOU ALL LUCK
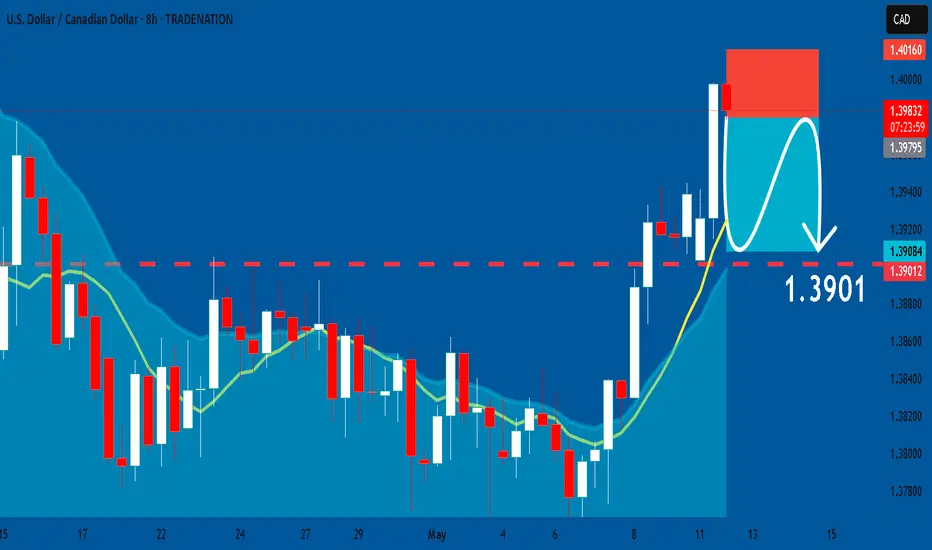
USDCAD: Short Trade Explained
USDCAD
- Classic bearish formation
- Our team expects fall
SUGGESTED TRADE:
Swing Trade
Sell USDCAD
Entry Level - 1.3979
Sl - 1.4016
Tp - 1.3901
Our Risk - 1%
Start protection of your profits from lower levels
Disclosure: I am part of Trade Nation's Influencer program and receive a monthly fee for using their TradingView charts in my analysis.
❤️ Please, support our work with like & comment! ❤️
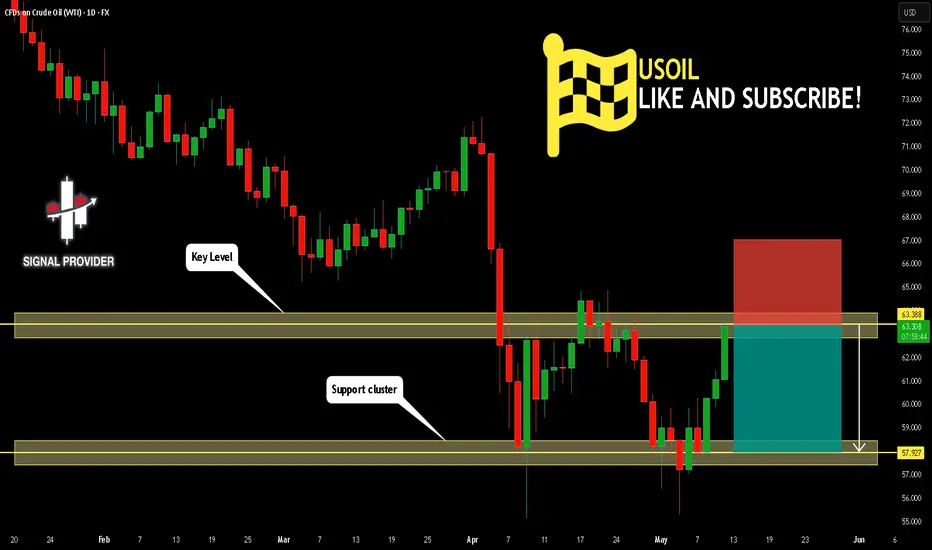
USOIL Is Going Down! Short!
Take a look at our analysis for USOIL.
Time Frame: 1D
Current Trend: Bearish
Sentiment: Overbought (based on 7-period RSI)
Forecast: Bearish
The market is on a crucial zone of supply 63.388.
The above-mentioned technicals clearly indicate the dominance of sellers on the market. I recommend shorting the instrument, aiming at 57.927 level.
P.S
Please, note that an oversold/overbought condition can last for a long time, and therefore being oversold/overbought doesn't mean a price rally will come soon, or at all.
Disclosure: I am part of Trade Nation's Influencer program and receive a monthly fee for using their TradingView charts in my analysis.
Like and subscribe and comment my ideas if you enjoy them!
EURUSD Will Go Down! Short!
Here is our detailed technical review for EURUSD.
Time Frame: 4h
Current Trend: Bearish
Sentiment: Overbought (based on 7-period RSI)
Forecast: Bearish
The market is approaching a significant resistance area 1.125.
Due to the fact that we see a positive bearish reaction from the underlined area, I strongly believe that sellers will manage to push the price all the way down to 1.114 level.
P.S
The term oversold refers to a condition where an asset has traded lower in price and has the potential for a price bounce.
Overbought refers to market scenarios where the instrument is traded considerably higher than its fair value. Overvaluation is caused by market sentiments when there is positive news.
Disclosure: I am part of Trade Nation's Influencer program and receive a monthly fee for using their TradingView charts in my analysis.
Like and subscribe and comment my ideas if you enjoy them!

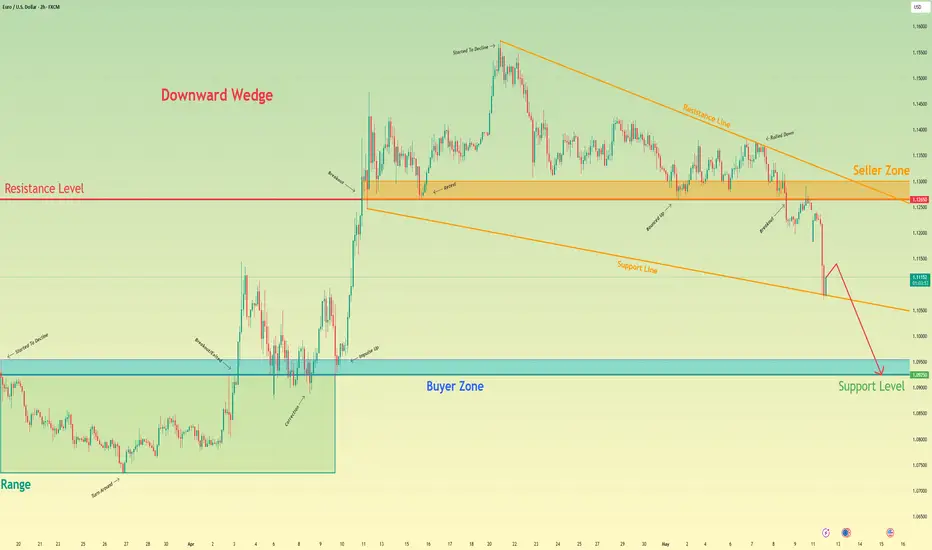
Euro may exit from wedge and then drop to support levelHello traders, I want share with you my opinion about Euro. After a strong impulse to the upside and a retest of the 1.1265 resistance area, the Euro started to consolidate inside a downward wedge. Despite repeated attempts to hold above the 1.1265 - 1.1300 zone, price action gradually shifted lower, creating lower highs within the wedge formation. This pattern often signals continuation or deeper correction, especially when formed after a large bullish move. The recent breakout below both the support area and the lower wedge boundary confirms that bearish pressure is taking control. The rejection from the seller zone and the sharp decline reinforce this shift in sentiment. Now the price is trading near the support line of the wedge and showing weak attempts to recover, forming a potential retest of the broken structure. Given the break of support, I expect the Euro may continue its decline toward the 1.0925 level, which coincides with both the buyer zone and a well-defined support level, thereby exiting from wedge pattern. This zone serves as my current TP 1. Please share this idea with your friends and click Boost 🚀
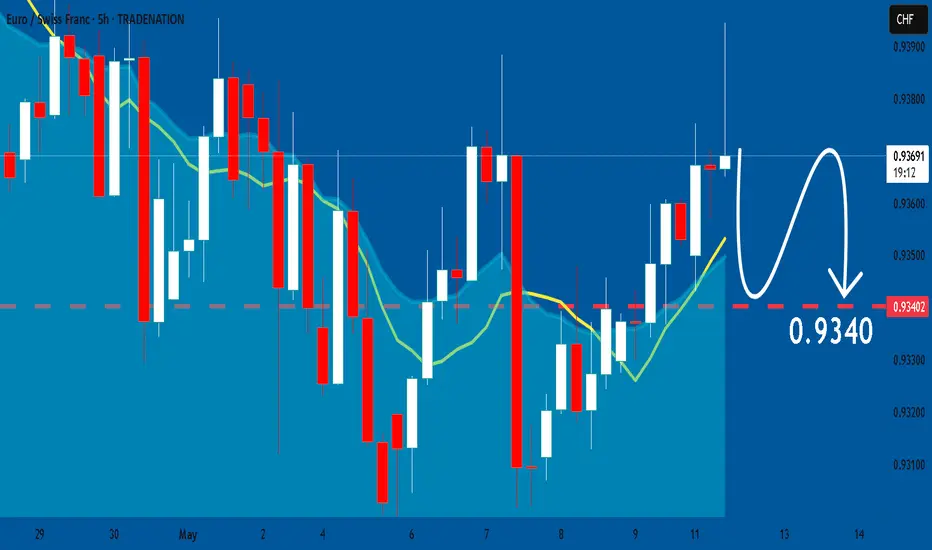
EURCHF: Market of Sellers
The analysis of the EURCHF chart clearly shows us that the pair is finally about to tank due to the rising pressure from the sellers.
Disclosure: I am part of Trade Nation's Influencer program and receive a monthly fee for using their TradingView charts in my analysis.
❤️ Please, support our work with like & comment! ❤️
EURO - Price can break support level and continue to fallHi guys, this is my overview for EURUSD, feel free to check it and write your feedback in comments👊
A few moments ago price traded near $1.0835 level and then it made strong upward impulse, breaking this level.
Then it continued to move up inside an upward pennant, where it reached the next support level, which broke soon too.
After this movement, it reached the resistance line of the pennant and then corrected the support line.
Euro tried to grow more, but failed and started to decline inside falling channel, exiting from pennant pattern.
In falling channel, price declined to $1.1200 support level and then turn around and start to move up.
I think that Euro can grow a little and then fall to $1.1065 support line of channel, breaking support level.
If this post is useful to you, you can support me with like/boost and advice in comments❤️

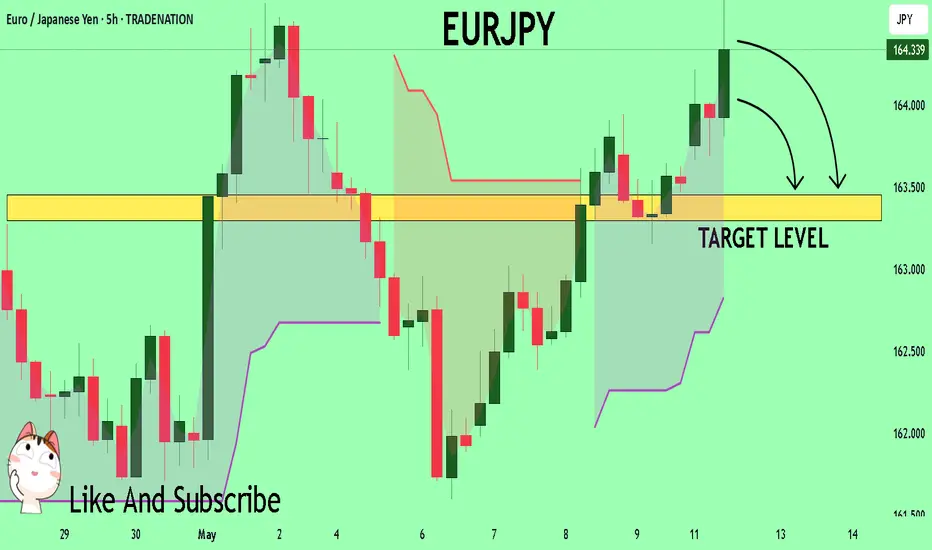
EURJPY Trading Opportunity! SELL!
My dear subscribers,
My technical analysis for EURJPY is below:
The price is coiling around a solid key level - 164.33
Technical Indicators: Pivot Points Low anticipates a potential price reversal.
Super trend shows a clear sell, giving a perfect indicators' convergence.
Goal - 163.45
About Used Indicators:
By the very nature of the supertrend indicator, it offers firm support and resistance levels for traders to enter and exit trades. Additionally, it also provides signals for setting stop losses
Disclosure: I am part of Trade Nation's Influencer program and receive a monthly fee for using their TradingView charts in my analysis.
———————————
WISH YOU ALL LUCK
AUD/CHF BEARISH BIAS RIGHT NOW| SHORT
Hello, Friends!
AUD/CHF is trending down which is clear from the red colour of the previous weekly candle. However, the price has locally surged into the overbought territory. Which can be told from its proximity to the BB upper band. Which presents a classical trend following opportunity for a short trade from the resistance line above towards the demand level of 0.520.
Disclosure: I am part of Trade Nation's Influencer program and receive a monthly fee for using their TradingView charts in my analysis.
✅LIKE AND COMMENT MY IDEAS✅

NZD/CHF BEST PLACE TO SELL FROM|SHORT
Hello, Friends!
NZD/CHF pair is in the uptrend because previous week’s candle is green, while the price is clearly rising on the 1D timeframe. And after the retest of the resistance line above I believe we will see a move down towards the target below at 0.483 because the pair overbought due to its proximity to the upper BB band and a bearish correction is likely.
Disclosure: I am part of Trade Nation's Influencer program and receive a monthly fee for using their TradingView charts in my analysis.
✅LIKE AND COMMENT MY IDEAS✅

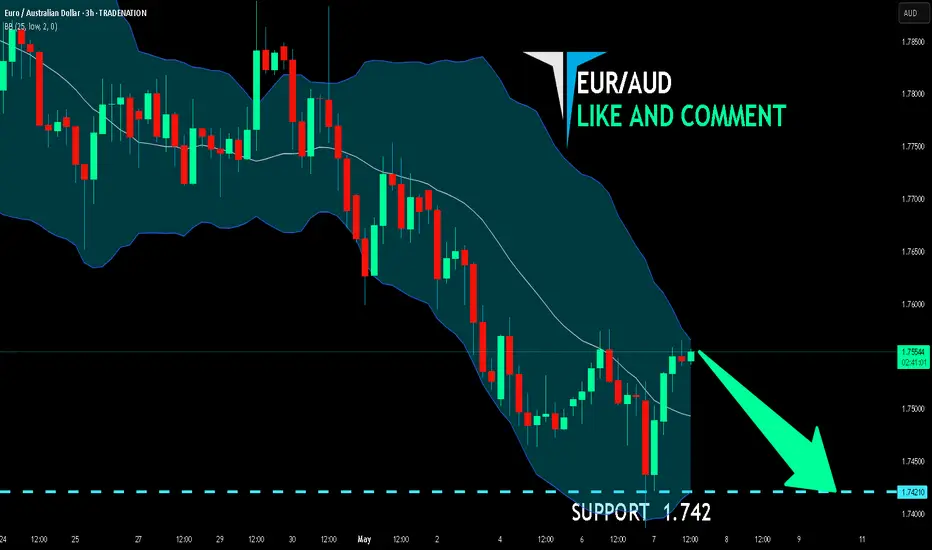
EUR/AUD BEARISH BIAS RIGHT NOW| SHORT
Hello, Friends!
We are targeting the 1.742 level area with our short trade on EUR/AUD which is based on the fact that the pair is overbought on the BB band scale and is also approaching a resistance line above thus going us a good entry option.
Disclosure: I am part of Trade Nation's Influencer program and receive a monthly fee for using their TradingView charts in my analysis.
✅LIKE AND COMMENT MY IDEAS✅
BITCOIN - Price can correct to support line of rising channelHi guys, this is my overview for BTCUSDT, feel free to check it and write your feedback in comments👊
Some days ago, the price entered a triangle, where it dropped to the support line, after which it rose briefly to the resistance line.
Then, price exited from the triangle pattern and made a retest at once, after which it corrected $81500 level.
Next, price some time traded near this level and later fell below, but soon turned around and started to grow inside a rising channel.
In channel BTC broke the $81500 level and later rose to the $93000 level, which broke soon too, and then made a retest.
Later price bounced and continued to grow, and now it trades near the resistance line of a rising channel.
Possibly, BTC can grow a little more and then make a correction movement to $99000
If this post is useful to you, you can support me with like/boost and advice in comments❤️

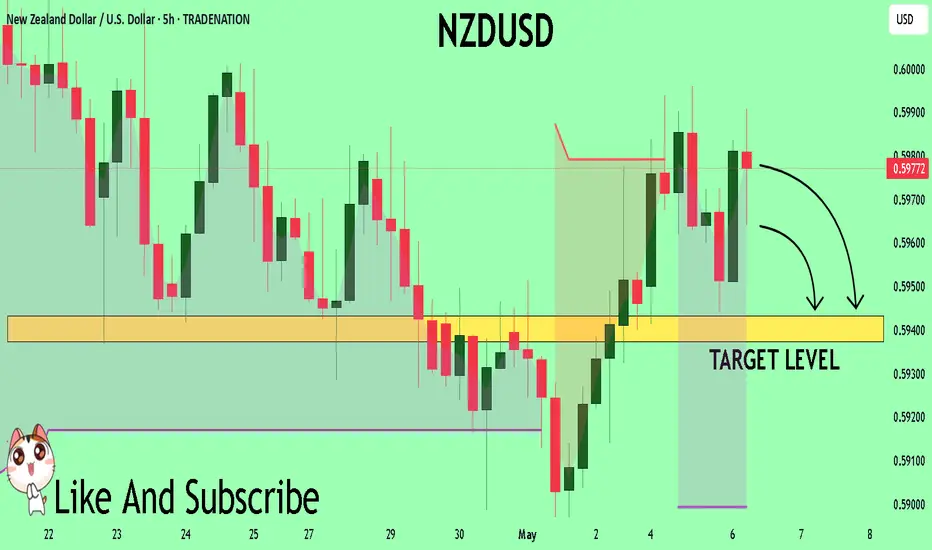
NZDUSD Will Collapse! SELL!
My dear subscribers,
This is my opinion on the NZDUSD next move:
The instrument tests an important psychological level 0.5975
Bias - Bearish
Technical Indicators: Supper Trend gives a precise Bearish signal, while Pivot Point HL predicts price changes and potential reversals in the market.
Target -0.5943
About Used Indicators:
On the subsequent day, trading above the pivot point is thought to indicate ongoing bullish sentiment, while trading below the pivot point indicates bearish sentiment.
Disclosure: I am part of Trade Nation's Influencer program and receive a monthly fee for using their TradingView charts in my analysis.
———————————
WISH YOU ALL LUCK